lampiran : 1 kuesioner kuesioner penelitian analisis...
TRANSCRIPT
69
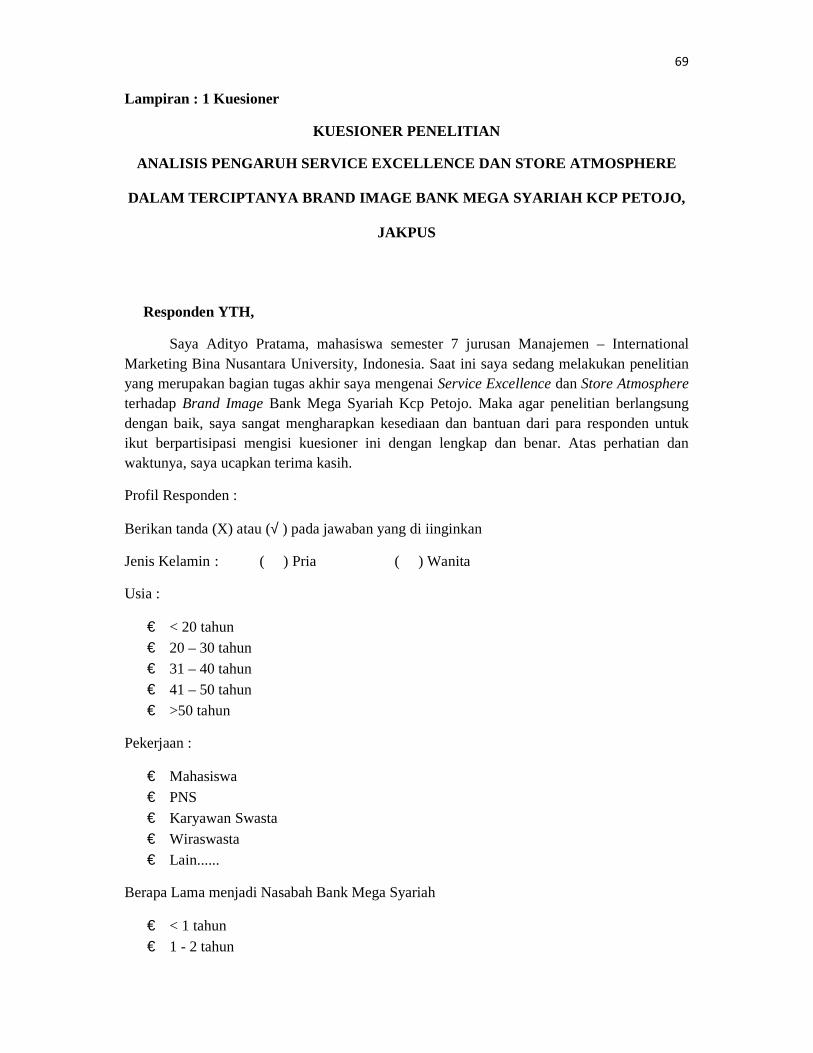
Lampiran : 1 Kuesioner
KUESIONER PENELITIAN
ANALISIS PENGARUH SERVICE EXCELLENCE DAN STORE ATMOSPHERE
DALAM TERCIPTANYA BRAND IMAGE BANK MEGA SYARIAH KCP PETOJO,
JAKPUS
Responden YTH,
Saya Adityo Pratama, mahasiswa semester 7 jurusan Manajemen – International Marketing Bina Nusantara University, Indonesia. Saat ini saya sedang melakukan penelitian yang merupakan bagian tugas akhir saya mengenai Service Excellence dan Store Atmosphere terhadap Brand Image Bank Mega Syariah Kcp Petojo. Maka agar penelitian berlangsung dengan baik, saya sangat mengharapkan kesediaan dan bantuan dari para responden untuk ikut berpartisipasi mengisi kuesioner ini dengan lengkap dan benar. Atas perhatian dan waktunya, saya ucapkan terima kasih.
Profil Responden :
Berikan tanda (X) atau (√ ) pada jawaban yang di iinginkan
Jenis Kelamin : ( ) Pria ( ) Wanita
Usia :
€ < 20 tahun € 20 – 30 tahun € 31 – 40 tahun € 41 – 50 tahun € >50 tahun
Pekerjaan :
€ Mahasiswa € PNS € Karyawan Swasta € Wiraswasta € Lain......
Berapa Lama menjadi Nasabah Bank Mega Syariah
€ < 1 tahun € 1 - 2 tahun
70
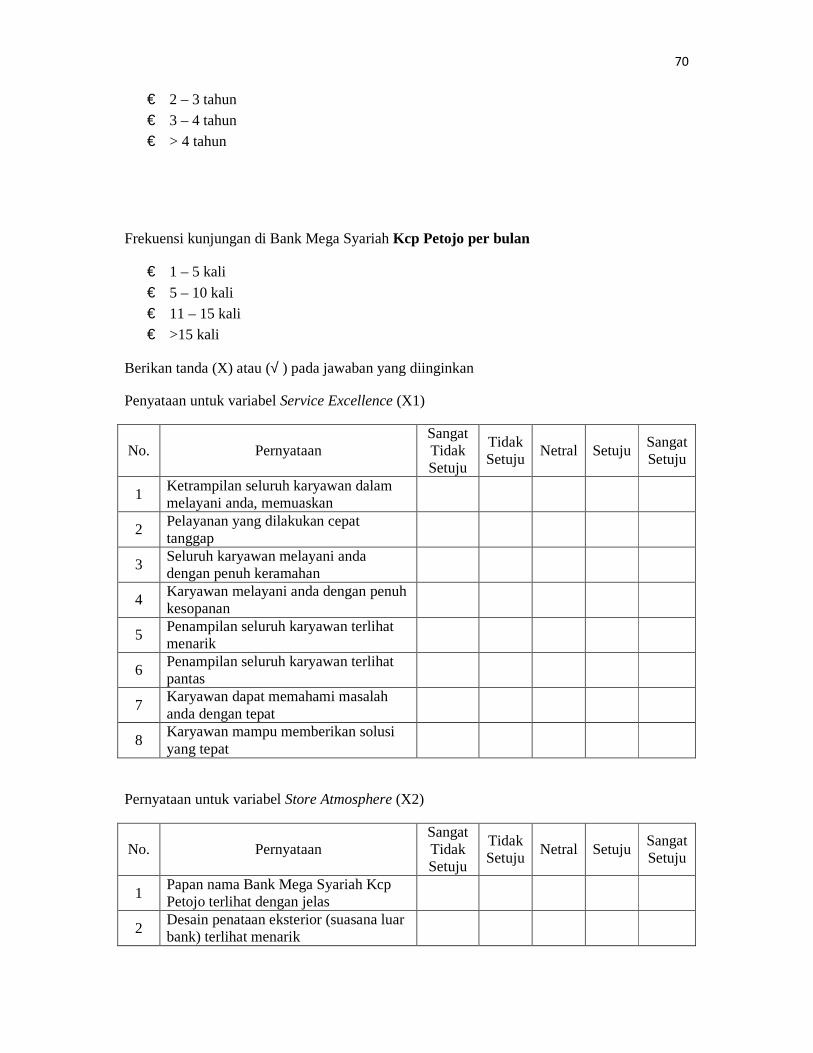
€ 2 – 3 tahun € 3 – 4 tahun € > 4 tahun
Frekuensi kunjungan di Bank Mega Syariah Kcp Petojo per bulan
€ 1 – 5 kali € 5 – 10 kali € 11 – 15 kali € >15 kali
Berikan tanda (X) atau (√ ) pada jawaban yang diinginkan
Penyataan untuk variabel Service Excellence (X1)
No. Pernyataan Sangat Tidak Setuju
Tidak Setuju
Netral Setuju Sangat Setuju
1 Ketrampilan seluruh karyawan dalam melayani anda, memuaskan
2 Pelayanan yang dilakukan cepat tanggap
3 Seluruh karyawan melayani anda dengan penuh keramahan
4 Karyawan melayani anda dengan penuh kesopanan
5 Penampilan seluruh karyawan terlihat menarik
6 Penampilan seluruh karyawan terlihat pantas
7 Karyawan dapat memahami masalah anda dengan tepat
8 Karyawan mampu memberikan solusi yang tepat
Pernyataan untuk variabel Store Atmosphere (X2)
No. Pernyataan Sangat Tidak Setuju
Tidak Setuju
Netral Setuju Sangat Setuju
1 Papan nama Bank Mega Syariah Kcp Petojo terlihat dengan jelas
2 Desain penataan eksterior (suasana luar bank) terlihat menarik
71
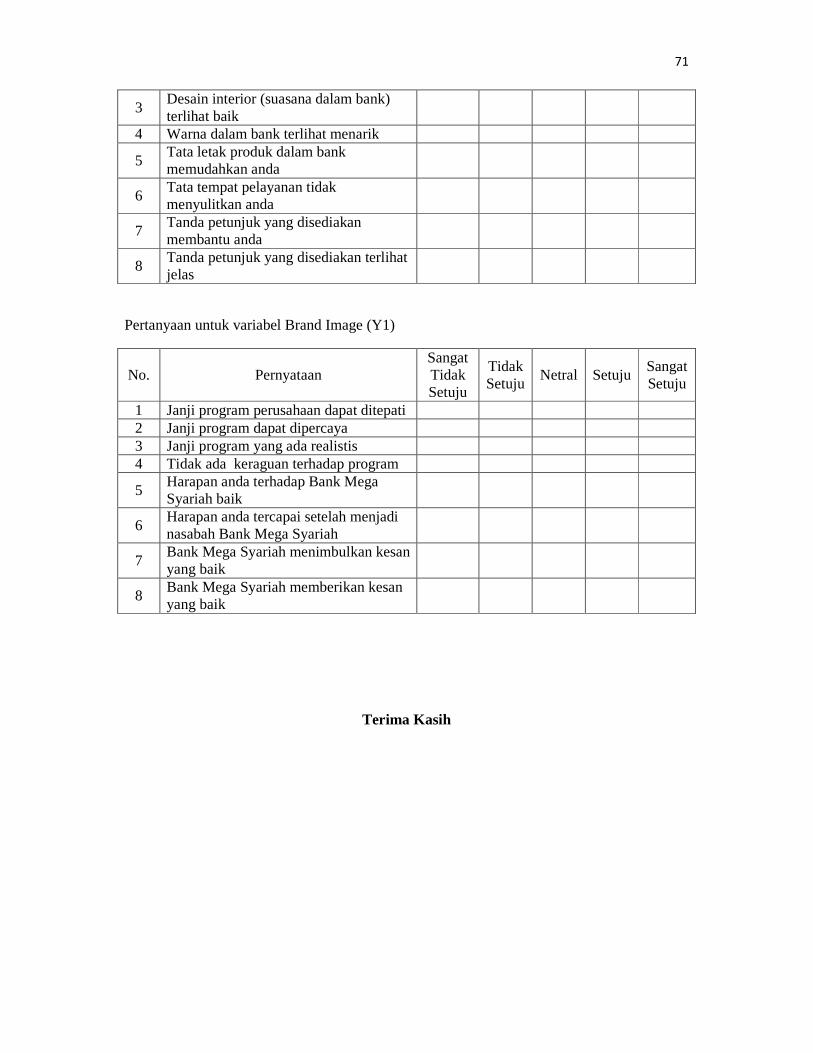
3 Desain interior (suasana dalam bank) terlihat baik
4 Warna dalam bank terlihat menarik
5 Tata letak produk dalam bank memudahkan anda
6 Tata tempat pelayanan tidak menyulitkan anda
7 Tanda petunjuk yang disediakan membantu anda
8 Tanda petunjuk yang disediakan terlihat jelas
Pertanyaan untuk variabel Brand Image (Y1)
No. Pernyataan Sangat Tidak Setuju
Tidak Setuju
Netral Setuju Sangat Setuju
1 Janji program perusahaan dapat ditepati 2 Janji program dapat dipercaya 3 Janji program yang ada realistis 4 Tidak ada keraguan terhadap program
5 Harapan anda terhadap Bank Mega Syariah baik
6 Harapan anda tercapai setelah menjadi nasabah Bank Mega Syariah
7 Bank Mega Syariah menimbulkan kesan yang baik
8 Bank Mega Syariah memberikan kesan yang baik
Terima Kasih
72
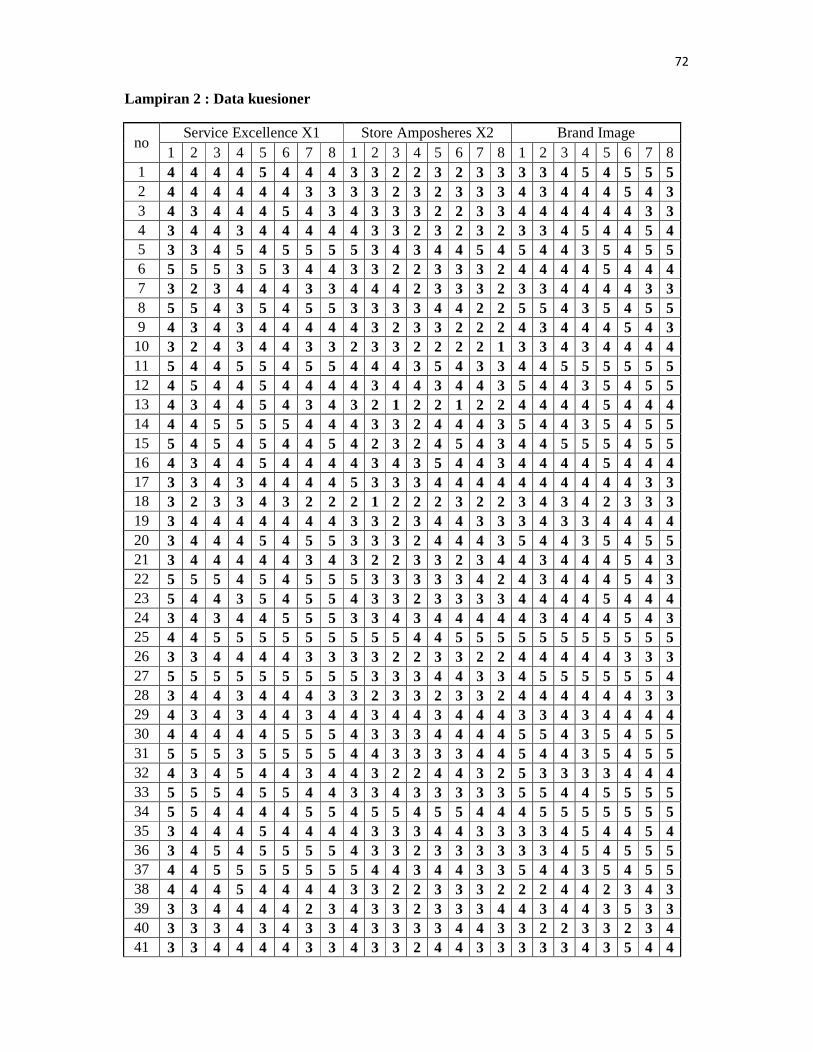
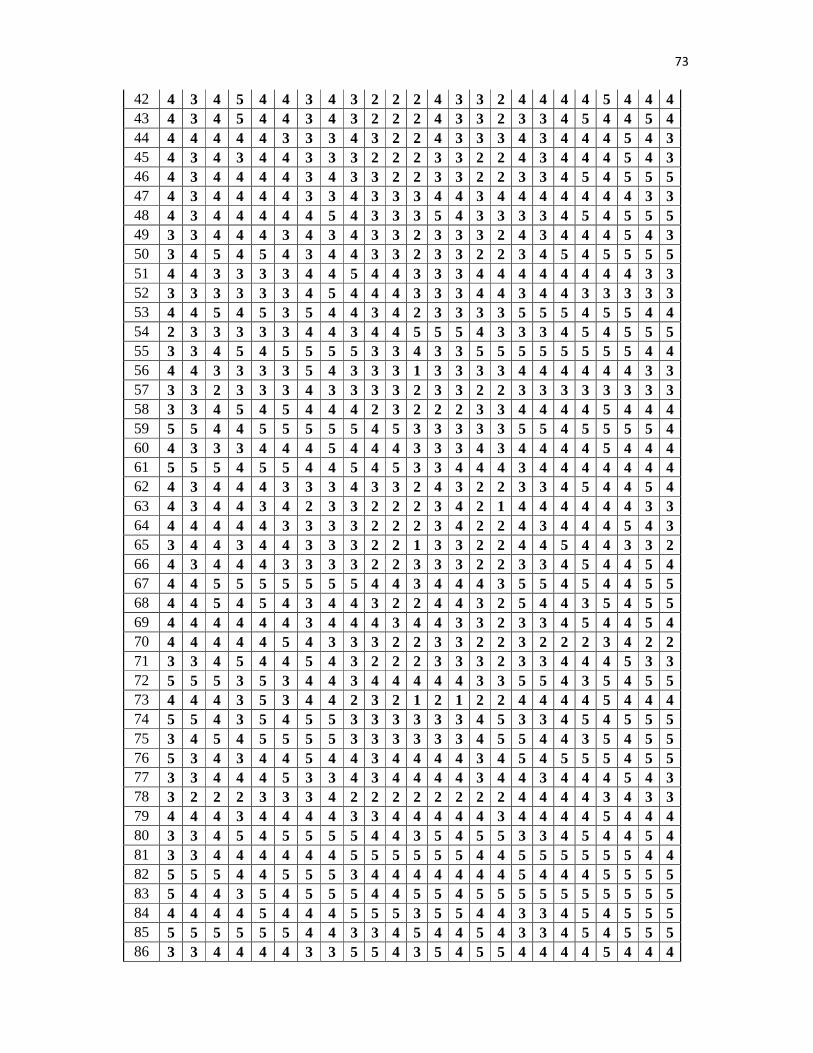
Lampiran 2 : Data kuesioner
no Service Excellence X1 Store Amposheres X2 Brand Image
1 2 3 4 5 6 7 8 1 2 3 4 5 6 7 8 1 2 3 4 5 6 7 8 1 4 4 4 4 5 4 4 4 3 3 2 2 3 2 3 3 3 3 4 5 4 5 5 5 2 4 4 4 4 4 4 3 3 3 3 2 3 2 3 3 3 4 3 4 4 4 5 4 3 3 4 3 4 4 4 5 4 3 4 3 3 3 2 2 3 3 4 4 4 4 4 4 3 3 4 3 4 4 3 4 4 4 4 4 3 3 2 3 2 3 2 3 3 4 5 4 4 5 4 5 3 3 4 5 4 5 5 5 5 3 4 3 4 4 5 4 5 4 4 3 5 4 5 5 6 5 5 5 3 5 3 4 4 3 3 2 2 3 3 3 2 4 4 4 4 5 4 4 4 7 3 2 3 4 4 4 3 3 4 4 4 2 3 3 3 2 3 3 4 4 4 4 3 3 8 5 5 4 3 5 4 5 5 3 3 3 3 4 4 2 2 5 5 4 3 5 4 5 5 9 4 3 4 3 4 4 4 4 4 3 2 3 3 2 2 2 4 3 4 4 4 5 4 3 10 3 2 4 3 4 4 3 3 2 3 3 2 2 2 2 1 3 3 4 3 4 4 4 4 11 5 4 4 5 5 4 5 5 4 4 4 3 5 4 3 3 4 4 5 5 5 5 5 5 12 4 5 4 4 5 4 4 4 4 3 4 4 3 4 4 3 5 4 4 3 5 4 5 5 13 4 3 4 4 5 4 3 4 3 2 1 2 2 1 2 2 4 4 4 4 5 4 4 4 14 4 4 5 5 5 5 4 4 4 3 3 2 4 4 4 3 5 4 4 3 5 4 5 5 15 5 4 5 4 5 4 4 5 4 2 3 2 4 5 4 3 4 4 5 5 5 4 5 5 16 4 3 4 4 5 4 4 4 4 3 4 3 5 4 4 3 4 4 4 4 5 4 4 4 17 3 3 4 3 4 4 4 4 5 3 3 3 4 4 4 4 4 4 4 4 4 4 3 3 18 3 2 3 3 4 3 2 2 2 1 2 2 2 3 2 2 3 4 3 4 2 3 3 3 19 3 4 4 4 4 4 4 4 3 3 2 3 4 4 3 3 3 4 3 3 4 4 4 4 20 3 4 4 4 5 4 5 5 3 3 3 2 4 4 4 3 5 4 4 3 5 4 5 5 21 3 4 4 4 4 4 3 4 3 2 2 3 3 2 3 4 4 3 4 4 4 5 4 3 22 5 5 5 4 5 4 5 5 5 3 3 3 3 3 4 2 4 3 4 4 4 5 4 3 23 5 4 4 3 5 4 5 5 4 3 3 2 3 3 3 3 4 4 4 4 5 4 4 4 24 3 4 3 4 4 5 5 5 3 3 4 3 4 4 4 4 4 3 4 4 4 5 4 3 25 4 4 5 5 5 5 5 5 5 5 5 4 4 5 5 5 5 5 5 5 5 5 5 5 26 3 3 4 4 4 4 3 3 3 3 2 2 3 3 2 2 4 4 4 4 4 3 3 3 27 5 5 5 5 5 5 5 5 5 3 3 3 4 4 3 3 4 5 5 5 5 5 5 4 28 3 4 4 3 4 4 4 3 3 2 3 3 2 3 3 2 4 4 4 4 4 4 3 3 29 4 3 4 3 4 4 3 4 4 3 4 4 3 4 4 4 3 3 4 3 4 4 4 4 30 4 4 4 4 4 5 5 5 4 3 3 3 4 4 4 4 5 5 4 3 5 4 5 5 31 5 5 5 3 5 5 5 5 4 4 3 3 3 3 4 4 5 4 4 3 5 4 5 5 32 4 3 4 5 4 4 3 4 4 3 2 2 4 4 3 2 5 3 3 3 3 4 4 4 33 5 5 5 4 5 5 4 4 3 3 4 3 3 3 3 3 5 5 4 4 5 5 5 5 34 5 5 4 4 4 4 5 5 4 5 5 4 5 5 4 4 4 5 5 5 5 5 5 5 35 3 4 4 4 5 4 4 4 4 3 3 3 4 4 3 3 3 3 4 5 4 4 5 4 36 3 4 5 4 5 5 5 5 4 3 3 2 3 3 3 3 3 3 4 5 4 5 5 5 37 4 4 5 5 5 5 5 5 5 4 4 3 4 4 3 3 5 4 4 3 5 4 5 5 38 4 4 4 5 4 4 4 4 3 3 2 2 3 3 3 2 2 2 4 4 2 3 4 3 39 3 3 4 4 4 4 2 3 4 3 3 2 3 3 3 4 4 3 4 4 3 5 3 3 40 3 3 3 4 3 4 3 3 4 3 3 3 3 4 4 3 3 2 2 3 3 2 3 4 41 3 3 4 4 4 4 3 3 4 3 3 2 4 4 3 3 3 3 3 4 3 5 4 4
73
42 4 3 4 5 4 4 3 4 3 2 2 2 4 3 3 2 4 4 4 4 5 4 4 4 43 4 3 4 5 4 4 3 4 3 2 2 2 4 3 3 2 3 3 4 5 4 4 5 4 44 4 4 4 4 4 3 3 3 4 3 2 2 4 3 3 3 4 3 4 4 4 5 4 3 45 4 3 4 3 4 4 3 3 3 2 2 2 3 3 2 2 4 3 4 4 4 5 4 3 46 4 3 4 4 4 4 3 4 3 3 2 2 3 3 2 2 3 3 4 5 4 5 5 5 47 4 3 4 4 4 4 3 3 4 3 3 3 4 4 3 4 4 4 4 4 4 4 3 3 48 4 3 4 4 4 4 4 5 4 3 3 3 5 4 3 3 3 3 4 5 4 5 5 5 49 3 3 4 4 4 3 4 3 4 3 3 2 3 3 3 2 4 3 4 4 4 5 4 3 50 3 4 5 4 5 4 3 4 4 3 3 2 3 3 2 2 3 4 5 4 5 5 5 5 51 4 4 3 3 3 3 4 4 5 4 4 3 3 3 4 4 4 4 4 4 4 4 3 3 52 3 3 3 3 3 3 4 5 4 4 4 3 3 3 4 4 3 4 4 3 3 3 3 3 53 4 4 5 4 5 3 5 4 4 3 4 2 3 3 3 3 5 5 5 4 5 5 4 4 54 2 3 3 3 3 3 4 4 3 4 4 5 5 5 4 3 3 3 4 5 4 5 5 5 55 3 3 4 5 4 5 5 5 5 3 3 4 3 3 5 5 5 5 5 5 5 5 4 4 56 4 4 3 3 3 3 5 4 3 3 3 1 3 3 3 3 4 4 4 4 4 4 3 3 57 3 3 2 3 3 3 4 3 3 3 3 2 3 3 2 2 3 3 3 3 3 3 3 3 58 3 3 4 5 4 5 4 4 4 2 3 2 2 2 3 3 4 4 4 4 5 4 4 4 59 5 5 4 4 5 5 5 5 5 4 5 3 3 3 3 3 5 5 4 5 5 5 5 4 60 4 3 3 3 4 4 4 5 4 4 4 3 3 3 4 3 4 4 4 4 5 4 4 4 61 5 5 5 4 5 5 4 4 5 4 5 3 3 4 4 4 3 4 4 4 4 4 4 4 62 4 3 4 4 4 3 3 3 4 3 3 2 4 3 2 2 3 3 4 5 4 4 5 4 63 4 3 4 4 3 4 2 3 3 2 2 2 3 4 2 1 4 4 4 4 4 4 3 3 64 4 4 4 4 4 3 3 3 3 2 2 2 3 4 2 2 4 3 4 4 4 5 4 3 65 3 4 4 3 4 4 3 3 3 2 2 1 3 3 2 2 4 4 5 4 4 3 3 2 66 4 3 4 4 4 3 3 3 3 2 2 3 3 3 2 2 3 3 4 5 4 4 5 4 67 4 4 5 5 5 5 5 5 5 4 4 3 4 4 4 3 5 5 4 5 4 4 5 5 68 4 4 5 4 5 4 3 4 4 3 2 2 4 4 3 2 5 4 4 3 5 4 5 5 69 4 4 4 4 4 4 3 4 4 4 3 4 4 3 3 2 3 3 4 5 4 4 5 4 70 4 4 4 4 4 5 4 3 3 3 2 2 3 3 2 2 3 2 2 2 3 4 2 2 71 3 3 4 5 4 4 5 4 3 2 2 2 3 3 3 2 3 3 4 4 4 5 3 3 72 5 5 5 3 5 3 4 4 3 4 4 4 4 4 3 3 5 5 4 3 5 4 5 5 73 4 4 4 3 5 3 4 4 2 3 2 1 2 1 2 2 4 4 4 4 5 4 4 4 74 5 5 4 3 5 4 5 5 3 3 3 3 3 3 4 5 3 3 4 5 4 5 5 5 75 3 4 5 4 5 5 5 5 3 3 3 3 3 3 4 5 5 4 4 3 5 4 5 5 76 5 3 4 3 4 4 5 4 4 3 4 4 4 4 3 4 5 4 5 5 5 4 5 5 77 3 3 4 4 4 5 3 3 4 3 4 4 4 4 3 4 4 3 4 4 4 5 4 3 78 3 2 2 2 3 3 3 4 2 2 2 2 2 2 2 2 4 4 4 4 3 4 3 3 79 4 4 4 3 4 4 4 4 3 3 4 4 4 4 4 3 4 4 4 4 5 4 4 4 80 3 3 4 5 4 5 5 5 5 4 4 3 5 4 5 5 3 3 4 5 4 4 5 4 81 3 3 4 4 4 4 4 4 5 5 5 5 5 5 4 4 5 5 5 5 5 5 4 4 82 5 5 5 4 4 5 5 5 3 4 4 4 4 4 4 4 5 4 4 4 5 5 5 5 83 5 4 4 3 5 4 5 5 5 4 4 5 5 4 5 5 5 5 5 5 5 5 5 5 84 4 4 4 4 5 4 4 4 5 5 5 3 5 5 4 4 3 3 4 5 4 5 5 5 85 5 5 5 5 5 5 4 4 3 3 4 5 4 4 5 4 3 3 4 5 4 5 5 5 86 3 3 4 4 4 4 3 3 5 5 4 3 5 4 5 5 4 4 4 4 5 4 4 4

74
87 5 5 5 5 5 5 5 5 5 5 5 4 5 4 5 5 5 5 4 3 5 4 5 5 88 3 3 3 4 4 4 4 4 4 4 4 4 5 4 4 4 3 3 4 5 4 5 5 5 89 3 3 4 4 3 4 4 4 4 3 3 4 3 4 3 3 3 3 4 5 4 4 5 4 90 3 3 3 3 3 4 3 4 3 3 3 4 4 4 5 5 3 3 4 5 4 4 5 4 91 5 4 4 5 5 4 5 5 4 3 3 3 4 3 3 3 5 5 4 3 5 4 5 5 92 5 5 5 3 5 3 4 4 4 3 3 3 3 5 4 3 4 3 4 4 4 5 4 3 93 5 5 5 3 4 3 3 3 3 4 4 4 4 4 4 4 3 4 4 4 4 4 3 3 94 5 5 4 3 5 4 5 5 3 4 4 4 4 4 4 4 3 3 4 5 4 5 5 5 95 3 4 5 4 5 5 5 5 4 4 4 4 4 3 3 3 3 3 4 5 4 5 5 5 96 5 3 4 3 4 4 5 4 3 3 4 4 4 4 3 3 3 3 4 5 4 4 5 4 97 4 3 4 3 4 5 3 3 4 4 4 4 4 4 3 3 4 4 4 4 4 4 3 3 98 3 2 2 3 3 3 3 3 3 3 3 4 4 4 4 4 4 3 4 4 4 5 4 3 99 3 4 4 4 4 4 4 4 5 3 4 3 4 4 5 4 4 4 4 4 5 4 4 4 100 3 3 4 5 4 5 5 5 3 3 4 4 4 4 3 3 5 5 5 4 5 4 5 5
Lampiran 3 : Uji Validitas dan Realibilitas Service Excellence
Case Processing Summary
N %
Cases Valid 100 100.0
Excludeda 0 .0
Total 100 100.0
a. Listwise deletion based on all variables in the procedure.
Reliability Statistics
Cronbach's Alpha N of Items
.830 8
Item Statistics
Mean Std.
Deviation N
Pernyataan1 3.8400 .80050 100
Pernyataan2 3.6800 .82731 100
Pernyataan3 4.0600 .67898 100
75
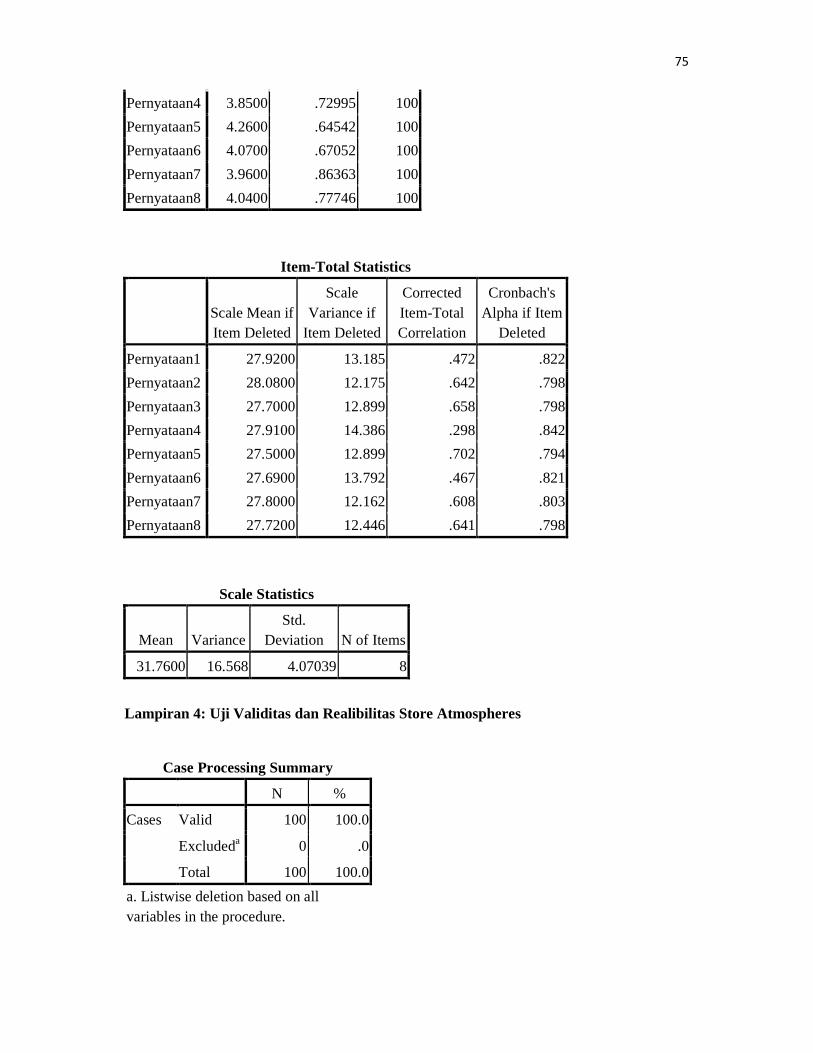
Pernyataan4 3.8500 .72995 100
Pernyataan5 4.2600 .64542 100
Pernyataan6 4.0700 .67052 100
Pernyataan7 3.9600 .86363 100
Pernyataan8 4.0400 .77746 100
Item-Total Statistics
Scale Mean if Item Deleted
Scale Variance if
Item Deleted
Corrected Item-Total Correlation
Cronbach's Alpha if Item
Deleted
Pernyataan1 27.9200 13.185 .472 .822
Pernyataan2 28.0800 12.175 .642 .798
Pernyataan3 27.7000 12.899 .658 .798
Pernyataan4 27.9100 14.386 .298 .842
Pernyataan5 27.5000 12.899 .702 .794
Pernyataan6 27.6900 13.792 .467 .821
Pernyataan7 27.8000 12.162 .608 .803
Pernyataan8 27.7200 12.446 .641 .798
Scale Statistics
Mean Variance Std.
Deviation N of Items
31.7600 16.568 4.07039 8
Lampiran 4: Uji Validitas dan Realibilitas Store Atmospheres
Case Processing Summary
N %
Cases Valid 100 100.0
Excludeda 0 .0
Total 100 100.0
a. Listwise deletion based on all variables in the procedure.
76
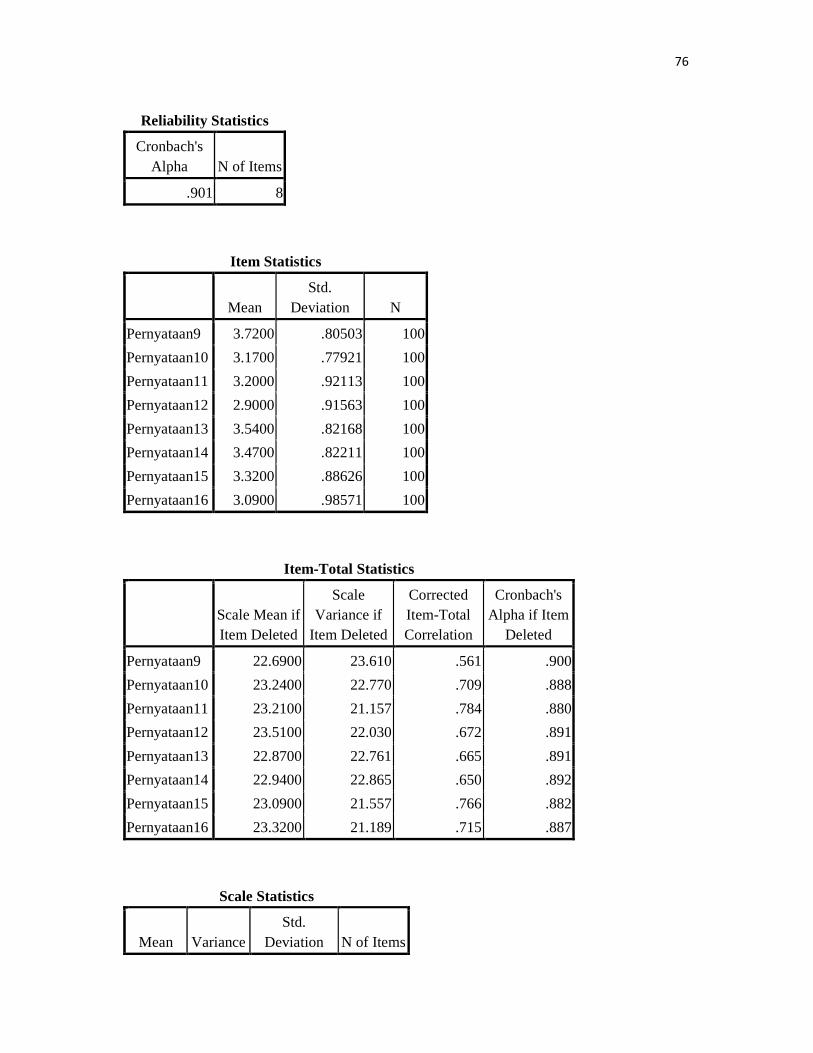
Reliability Statistics
Cronbach's Alpha N of Items
.901 8
Item Statistics
Mean Std.
Deviation N
Pernyataan9 3.7200 .80503 100
Pernyataan10 3.1700 .77921 100
Pernyataan11 3.2000 .92113 100
Pernyataan12 2.9000 .91563 100
Pernyataan13 3.5400 .82168 100
Pernyataan14 3.4700 .82211 100
Pernyataan15 3.3200 .88626 100
Pernyataan16 3.0900 .98571 100
Item-Total Statistics
Scale Mean if Item Deleted
Scale Variance if
Item Deleted
Corrected Item-Total Correlation
Cronbach's Alpha if Item
Deleted
Pernyataan9 22.6900 23.610 .561 .900
Pernyataan10 23.2400 22.770 .709 .888
Pernyataan11 23.2100 21.157 .784 .880
Pernyataan12 23.5100 22.030 .672 .891
Pernyataan13 22.8700 22.761 .665 .891
Pernyataan14 22.9400 22.865 .650 .892
Pernyataan15 23.0900 21.557 .766 .882
Pernyataan16 23.3200 21.189 .715 .887
Scale Statistics
Mean Variance Std.
Deviation N of Items

77
Scale Statistics
Mean Variance Std.
Deviation N of Items
26.4100 28.648 5.35242 8
Lampiran 5: Uji Validitas dan Realibilitas Brand Image
Case Processing Summary
N %
Cases Valid 100 100.0
Excludeda 0 .0
Total 100 100.0
a. Listwise deletion based on all variables in the procedure.
Reliability Statistics
Cronbach's Alpha N of Items
.789 8
Item Statistics
Mean Std.
Deviation N
Pernyataan17 3.8800 .79493 100
Pernyataan18 3.6900 .77453 100
Pernyataan19 4.0400 .51089 100
Pernyataan20 4.1000 .74536 100
Pernyataan21 4.2700 .69420 100
Pernyataan22 4.3000 .62765 100
Pernyataan23 4.2600 .79924 100
Pernyataan24 4.0100 .85865 100
78
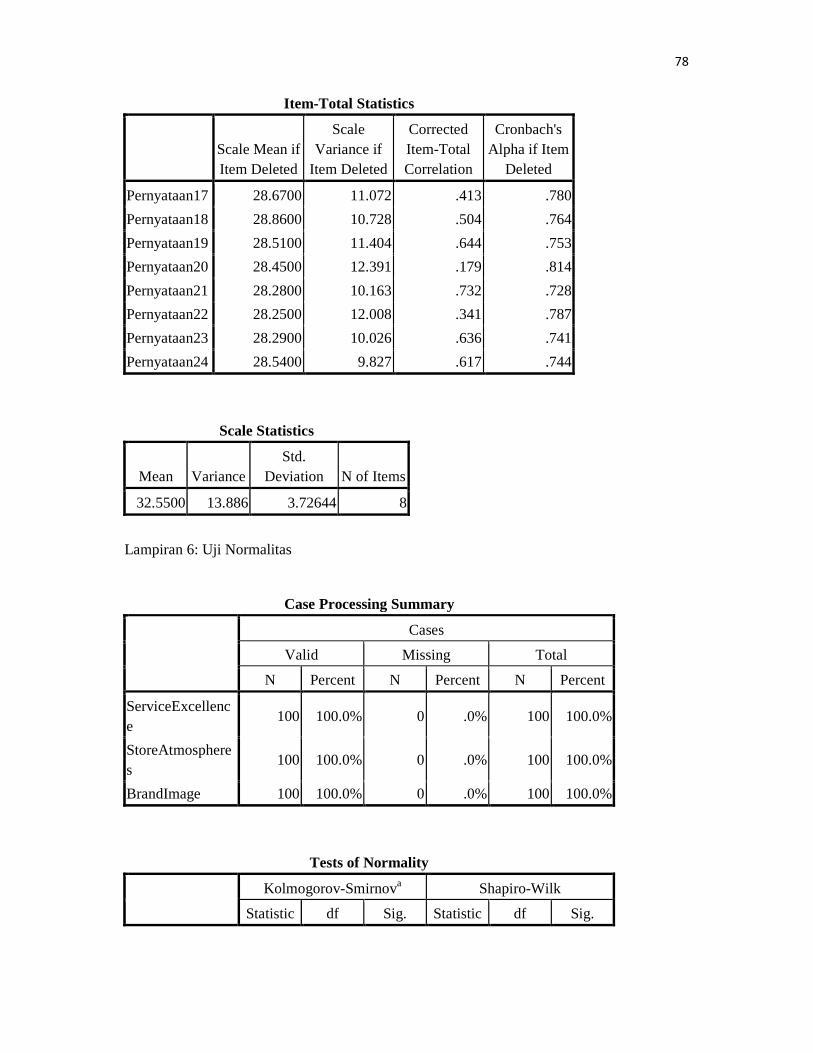
Item-Total Statistics
Scale Mean if Item Deleted
Scale Variance if
Item Deleted
Corrected Item-Total Correlation
Cronbach's Alpha if Item
Deleted
Pernyataan17 28.6700 11.072 .413 .780
Pernyataan18 28.8600 10.728 .504 .764
Pernyataan19 28.5100 11.404 .644 .753
Pernyataan20 28.4500 12.391 .179 .814
Pernyataan21 28.2800 10.163 .732 .728
Pernyataan22 28.2500 12.008 .341 .787
Pernyataan23 28.2900 10.026 .636 .741
Pernyataan24 28.5400 9.827 .617 .744
Scale Statistics
Mean Variance Std.
Deviation N of Items
32.5500 13.886 3.72644 8
Lampiran 6: Uji Normalitas
Case Processing Summary
Cases
Valid Missing Total
N Percent N Percent N Percent
ServiceExcellence
100 100.0% 0 .0% 100 100.0%
StoreAtmospheres
100 100.0% 0 .0% 100 100.0%
BrandImage 100 100.0% 0 .0% 100 100.0%
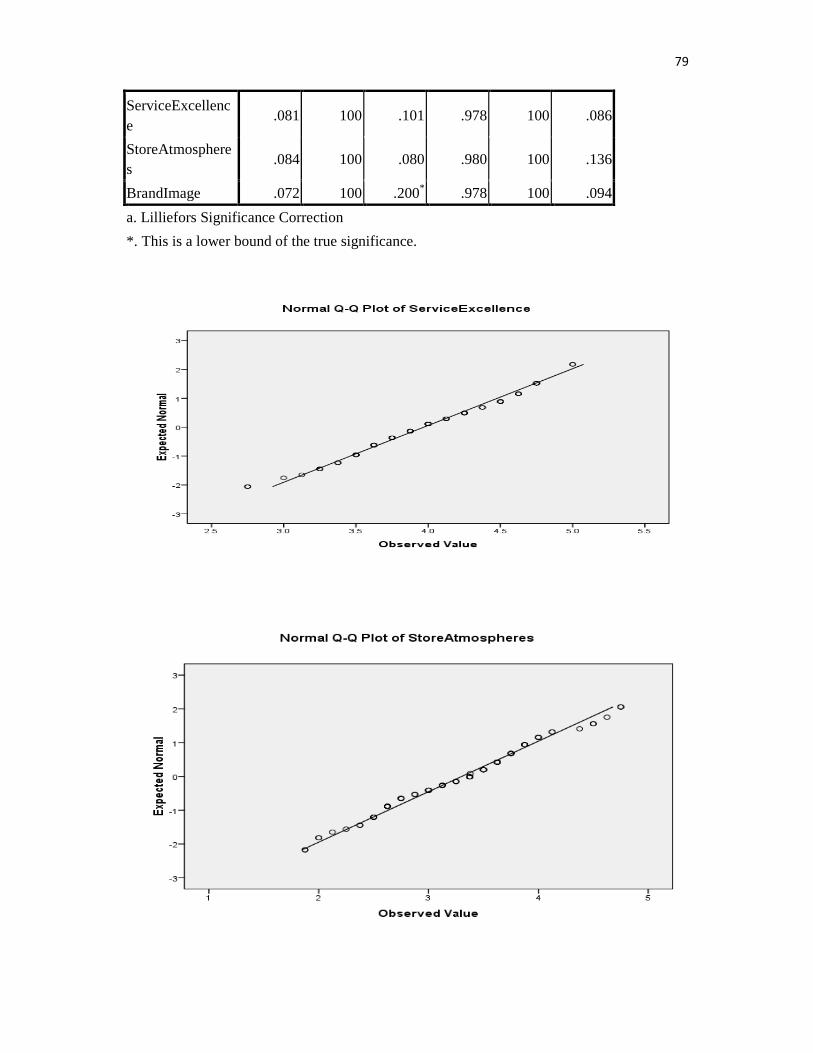
Tests of Normality
Kolmogorov-Smirnova Shapiro-Wilk
Statistic df Sig. Statistic df Sig.
79
ServiceExcellence
.081 100 .101 .978 100 .086
StoreAtmospheres
.084 100 .080 .980 100 .136
BrandImage .072 100 .200* .978 100 .094
a. Lilliefors Significance Correction
*. This is a lower bound of the true significance.

80
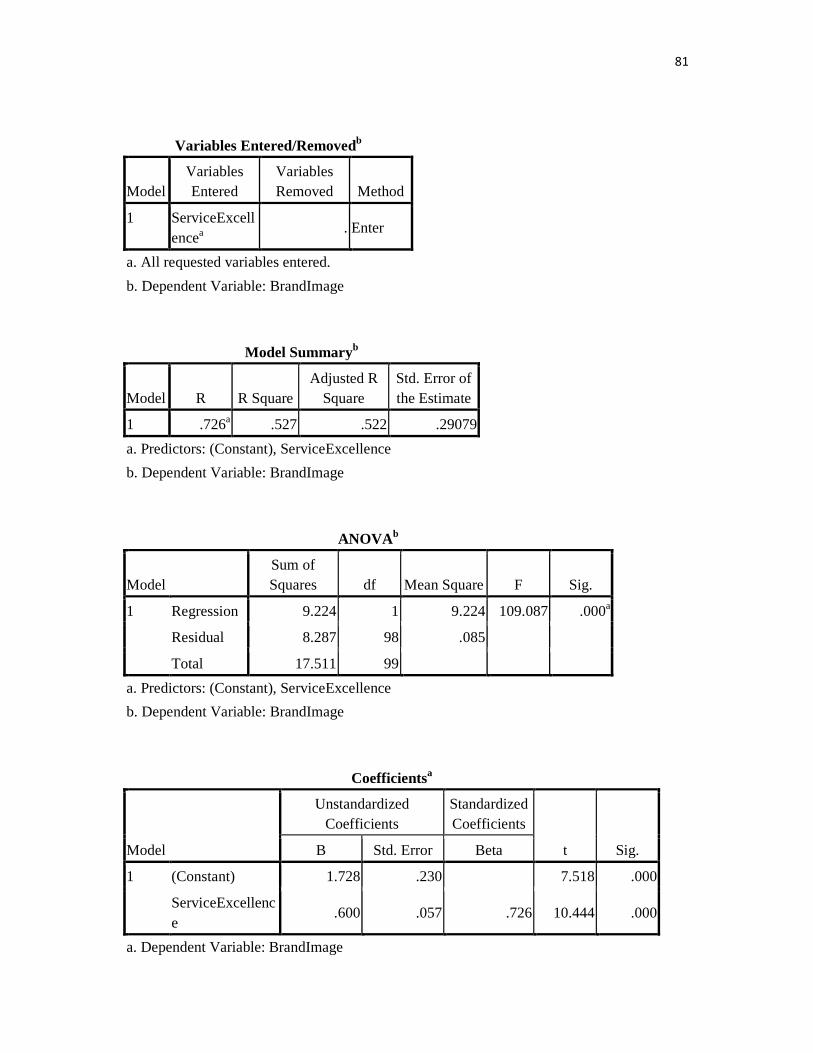
Lampiran 7: Uji Regresi Service Excellence dan Brand Image
Descriptive Statistics
Mean Std.
Deviation N
BrandImage 4.1099 .42056 100
ServiceExcellence
3.9700 .50880 100
Correlations
BrandImage ServiceExcell
ence
Pearson Correlation
BrandImage 1.000 .726
ServiceExcellence
.726 1.000
Sig. (1-tailed) BrandImage . .000
ServiceExcellence
.000 .
N BrandImage 100 100
ServiceExcellence
100 100
81
Variables Entered/Removedb
Model Variables Entered
Variables Removed Method
1 ServiceExcellencea
. Enter
a. All requested variables entered.
b. Dependent Variable: BrandImage
Model Summaryb
Model R R Square Adjusted R
Square Std. Error of the Estimate
1 .726a .527 .522 .29079
a. Predictors: (Constant), ServiceExcellence
b. Dependent Variable: BrandImage
ANOVAb
Model Sum of Squares df Mean Square F Sig.
1 Regression 9.224 1 9.224 109.087 .000a
Residual 8.287 98 .085
Total 17.511 99
a. Predictors: (Constant), ServiceExcellence
b. Dependent Variable: BrandImage
Coefficientsa
Model
Unstandardized Coefficients
Standardized Coefficients
t Sig. B Std. Error Beta
1 (Constant) 1.728 .230 7.518 .000
ServiceExcellence
.600 .057 .726 10.444 .000
a. Dependent Variable: BrandImage
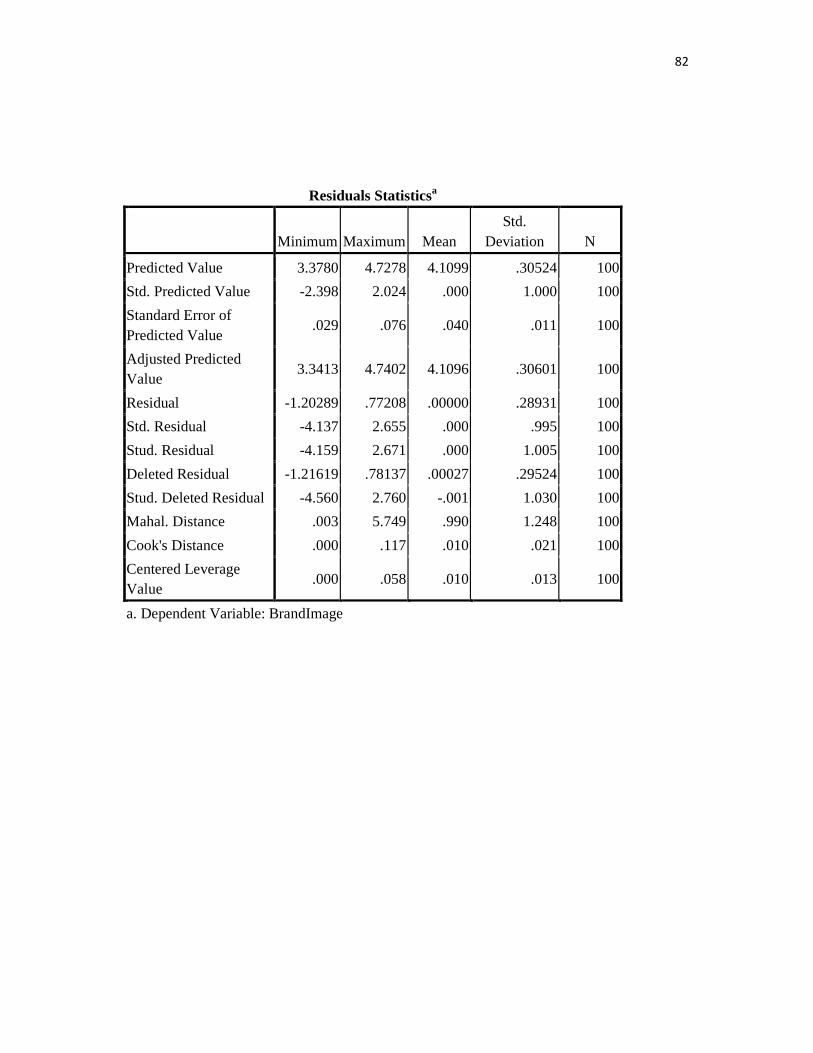
82
Residuals Statisticsa
Minimum Maximum Mean Std.
Deviation N
Predicted Value 3.3780 4.7278 4.1099 .30524 100
Std. Predicted Value -2.398 2.024 .000 1.000 100
Standard Error of Predicted Value
.029 .076 .040 .011 100
Adjusted Predicted Value
3.3413 4.7402 4.1096 .30601 100
Residual -1.20289 .77208 .00000 .28931 100
Std. Residual -4.137 2.655 .000 .995 100
Stud. Residual -4.159 2.671 .000 1.005 100
Deleted Residual -1.21619 .78137 .00027 .29524 100
Stud. Deleted Residual -4.560 2.760 -.001 1.030 100
Mahal. Distance .003 5.749 .990 1.248 100
Cook's Distance .000 .117 .010 .021 100
Centered Leverage Value
.000 .058 .010 .013 100
a. Dependent Variable: BrandImage

83

84
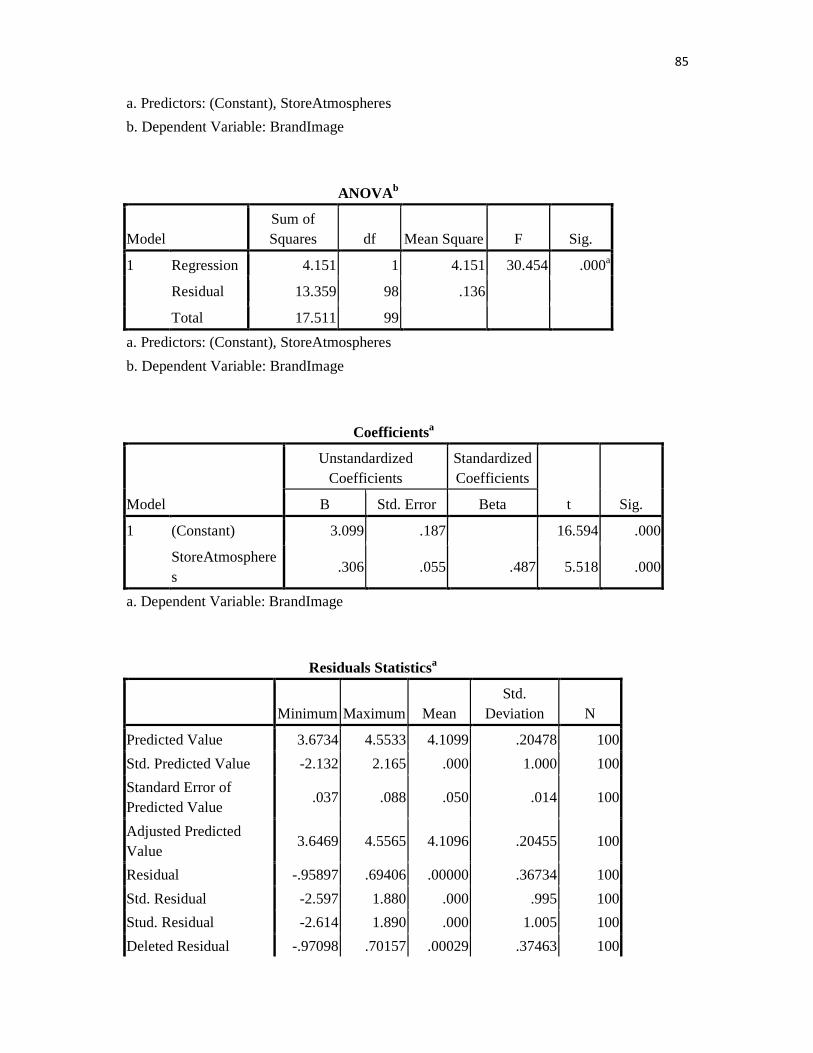
Lampiran 8: Uji Regresi Store Atmospheres dan Brand Image
Descriptive Statistics
Mean Std.
Deviation N
BrandImage 4.1099 .42056 100
StoreAtmospheres
3.3013 .66906 100
Correlations
BrandImage StoreAtmosp
heres
Pearson Correlation
BrandImage 1.000 .487
StoreAtmospheres
.487 1.000
Sig. (1-tailed) BrandImage . .000
StoreAtmospheres
.000 .
N BrandImage 100 100
StoreAtmospheres
100 100
Variables Entered/Removedb
Model Variables Entered
Variables Removed Method
1 StoreAtmospheresa
. Enter
a. All requested variables entered.
b. Dependent Variable: BrandImage
Model Summaryb
Model R R Square Adjusted R
Square Std. Error of the Estimate
1 .487a .237 .229 .36921
85
a. Predictors: (Constant), StoreAtmospheres
b. Dependent Variable: BrandImage
ANOVAb
Model Sum of Squares df Mean Square F Sig.
1 Regression 4.151 1 4.151 30.454 .000a
Residual 13.359 98 .136
Total 17.511 99
a. Predictors: (Constant), StoreAtmospheres
b. Dependent Variable: BrandImage
Coefficientsa
Model
Unstandardized Coefficients
Standardized Coefficients
t Sig. B Std. Error Beta
1 (Constant) 3.099 .187 16.594 .000
StoreAtmospheres
.306 .055 .487 5.518 .000
a. Dependent Variable: BrandImage
Residuals Statisticsa
Minimum Maximum Mean Std.
Deviation N
Predicted Value 3.6734 4.5533 4.1099 .20478 100
Std. Predicted Value -2.132 2.165 .000 1.000 100
Standard Error of Predicted Value
.037 .088 .050 .014 100
Adjusted Predicted Value
3.6469 4.5565 4.1096 .20455 100
Residual -.95897 .69406 .00000 .36734 100
Std. Residual -2.597 1.880 .000 .995 100
Stud. Residual -2.614 1.890 .000 1.005 100
Deleted Residual -.97098 .70157 .00029 .37463 100
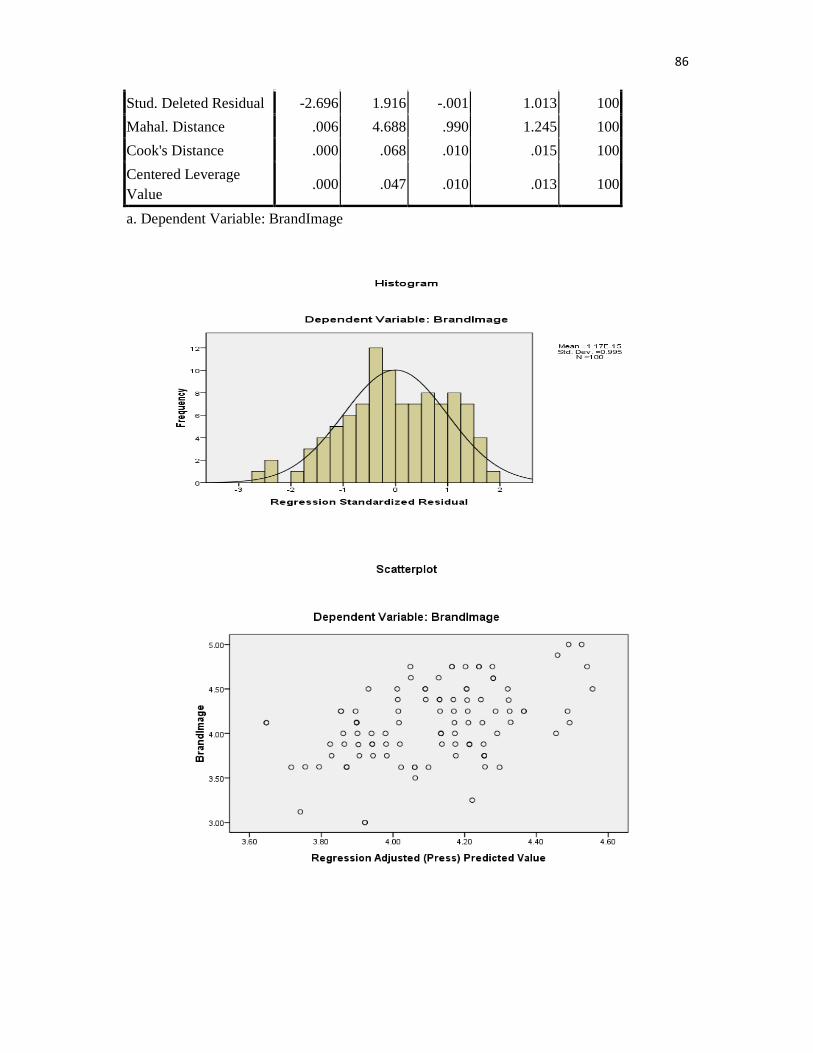
86
Stud. Deleted Residual -2.696 1.916 -.001 1.013 100
Mahal. Distance .006 4.688 .990 1.245 100
Cook's Distance .000 .068 .010 .015 100
Centered Leverage Value
.000 .047 .010 .013 100
a. Dependent Variable: BrandImage
87
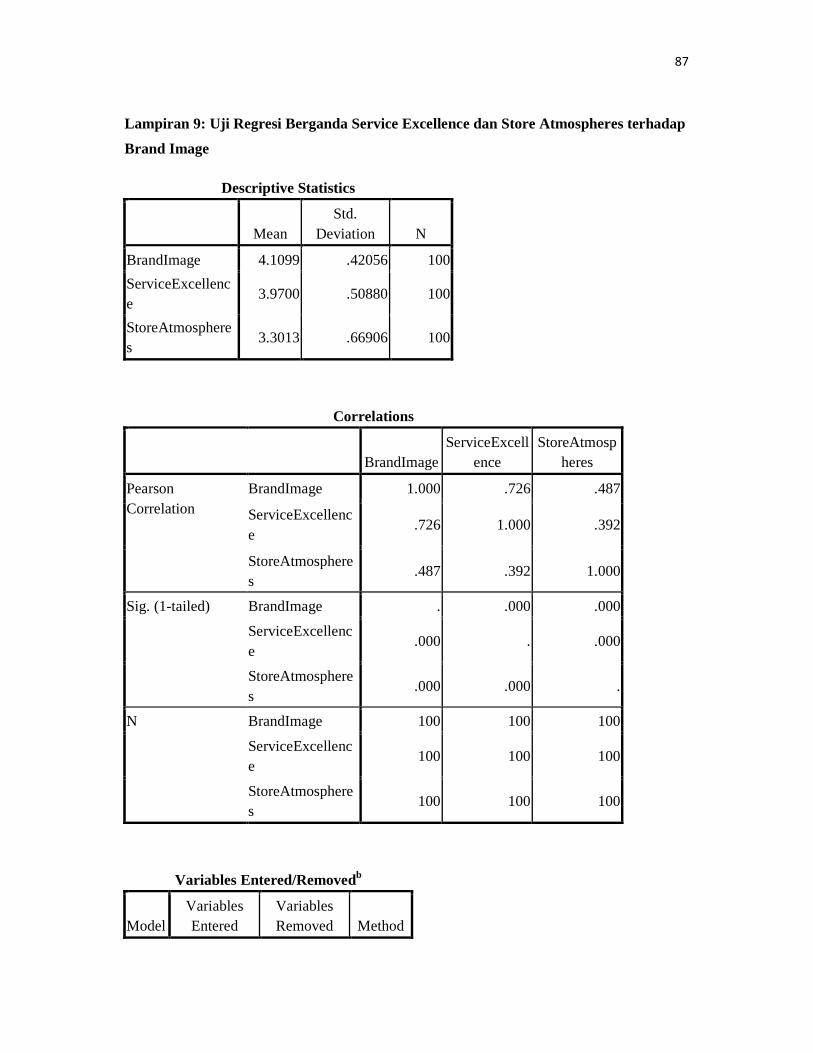
Lampiran 9: Uji Regresi Berganda Service Excellence dan Store Atmospheres terhadap
Brand Image
Descriptive Statistics
Mean Std.
Deviation N
BrandImage 4.1099 .42056 100
ServiceExcellence
3.9700 .50880 100
StoreAtmospheres
3.3013 .66906 100
Correlations
BrandImage ServiceExcell
ence StoreAtmosp
heres
Pearson Correlation
BrandImage 1.000 .726 .487
ServiceExcellence
.726 1.000 .392
StoreAtmospheres
.487 .392 1.000
Sig. (1-tailed) BrandImage . .000 .000
ServiceExcellence
.000 . .000
StoreAtmospheres
.000 .000 .
N BrandImage 100 100 100
ServiceExcellence
100 100 100
StoreAtmospheres
100 100 100
Variables Entered/Removedb
Model Variables Entered
Variables Removed Method
88
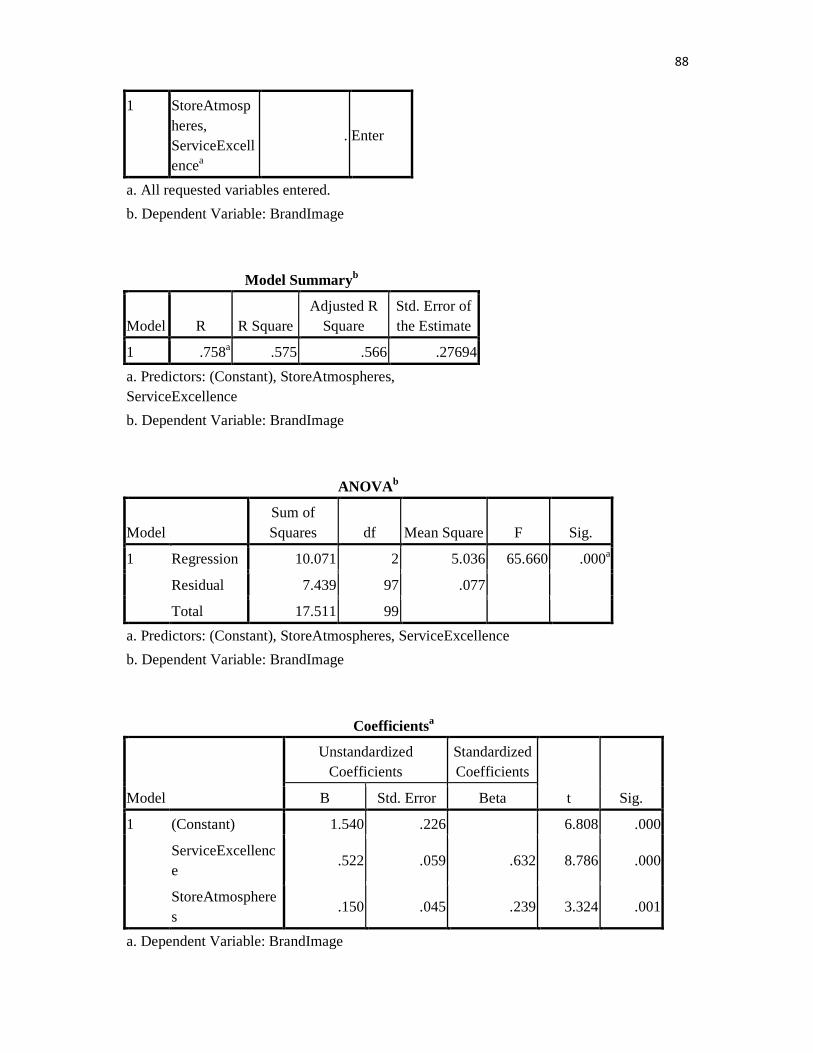
1 StoreAtmospheres, ServiceExcellencea
. Enter
a. All requested variables entered.
b. Dependent Variable: BrandImage
Model Summaryb
Model R R Square Adjusted R
Square Std. Error of the Estimate
1 .758a .575 .566 .27694
a. Predictors: (Constant), StoreAtmospheres, ServiceExcellence
b. Dependent Variable: BrandImage
ANOVAb
Model Sum of Squares df Mean Square F Sig.
1 Regression 10.071 2 5.036 65.660 .000a
Residual 7.439 97 .077
Total 17.511 99
a. Predictors: (Constant), StoreAtmospheres, ServiceExcellence
b. Dependent Variable: BrandImage
Coefficientsa
Model
Unstandardized Coefficients
Standardized Coefficients
t Sig. B Std. Error Beta
1 (Constant) 1.540 .226 6.808 .000
ServiceExcellence
.522 .059 .632 8.786 .000
StoreAtmospheres
.150 .045 .239 3.324 .001
a. Dependent Variable: BrandImage
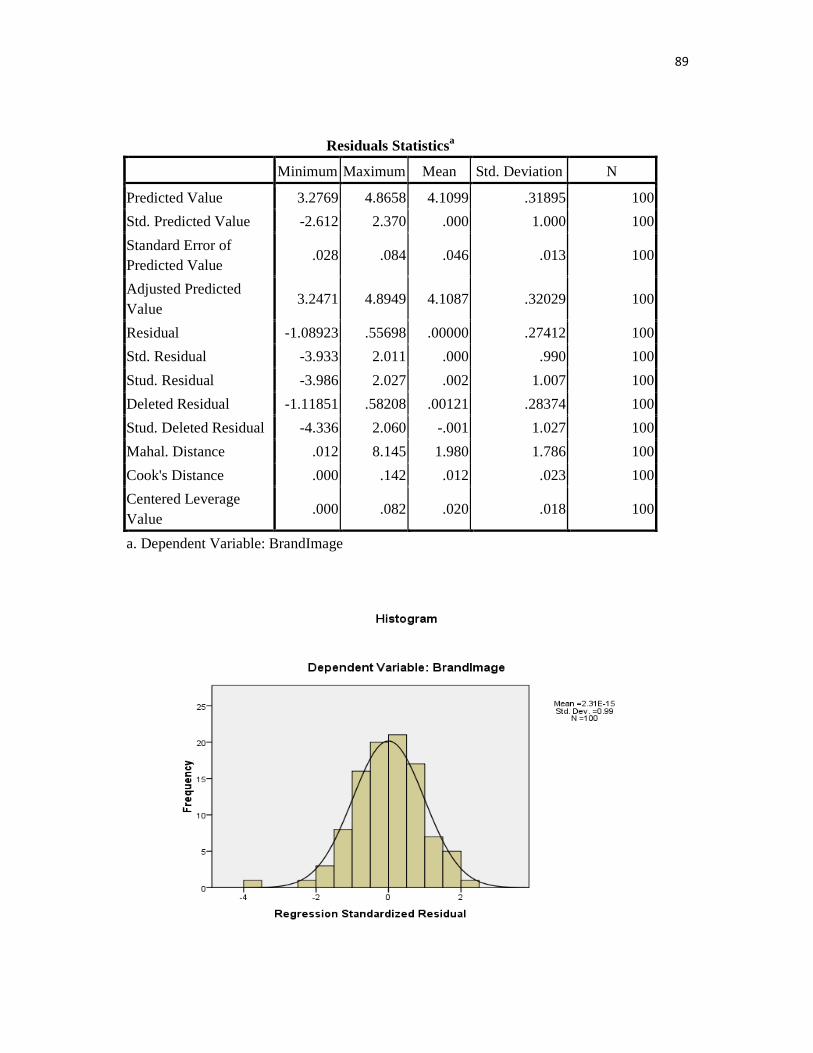
89
Residuals Statisticsa
Minimum Maximum Mean Std. Deviation N
Predicted Value 3.2769 4.8658 4.1099 .31895 100
Std. Predicted Value -2.612 2.370 .000 1.000 100
Standard Error of Predicted Value
.028 .084 .046 .013 100
Adjusted Predicted Value
3.2471 4.8949 4.1087 .32029 100
Residual -1.08923 .55698 .00000 .27412 100
Std. Residual -3.933 2.011 .000 .990 100
Stud. Residual -3.986 2.027 .002 1.007 100
Deleted Residual -1.11851 .58208 .00121 .28374 100
Stud. Deleted Residual -4.336 2.060 -.001 1.027 100
Mahal. Distance .012 8.145 1.980 1.786 100
Cook's Distance .000 .142 .012 .023 100
Centered Leverage Value
.000 .082 .020 .018 100
a. Dependent Variable: BrandImage

90
91
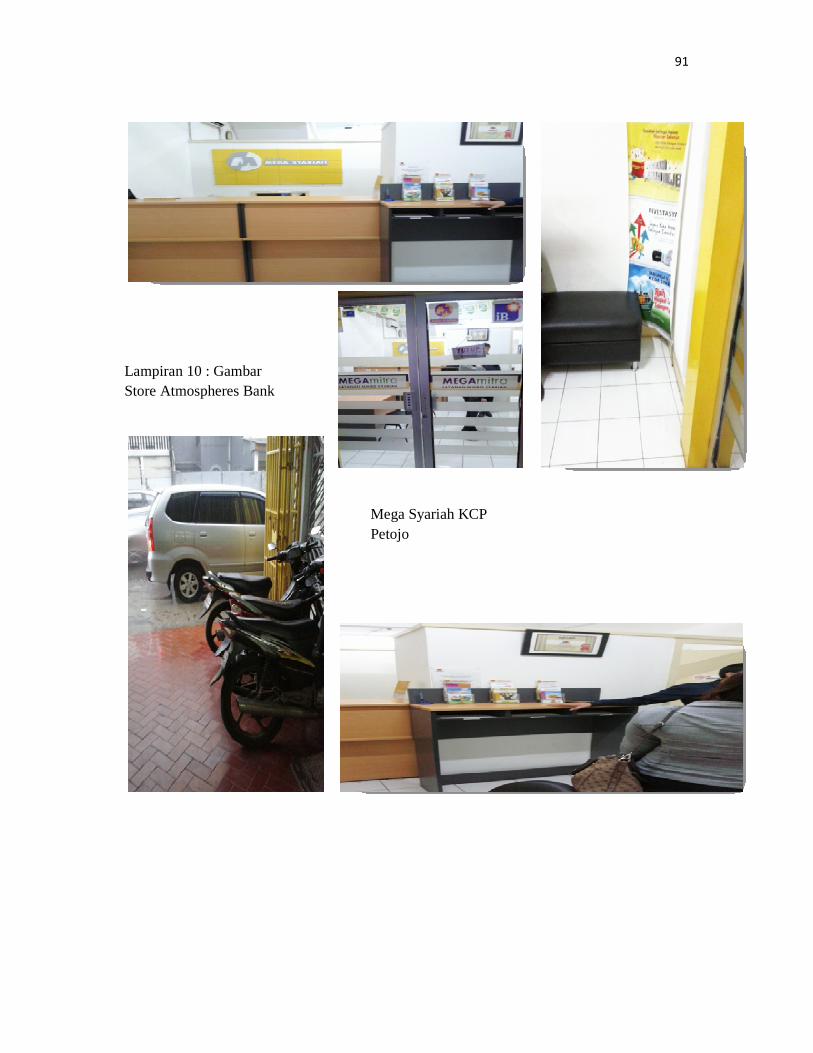
Lampiran 10 : Gambar Store Atmospheres Bank
Mega Syariah KCP Petojo