kehilangan hasil dan cara pengukurannya ambang ekonomi · pdf filecontoh skor 0 1 2 3 4 5 0% 5...
TRANSCRIPT
Kehilangan hasil dan cara
pengukurannya
Ambang ekonomi

Pemantauan Perkembangan OPT
• Pengamatan terhadap kemunculan suatu OPT
di suatu wilayah perlu di monitor dari waktu
ke waktu dengan interval tertentu tergantung
: tingkat tumbuh, jenis tanaman, daur hidup : tingkat tumbuh, jenis tanaman, daur hidup
OPT yang diamati, tujuan pengambilan
sampel, faktor cuaca, dll.
• Pengamatan dilakukan pada sampel tanaman
yang dipilih mengikuti ketentuan secara acak
atau secara sistematik

Pengngambilan sampel
pengamatan
AcakBukan sampel
Sampel pengamatan
Sistematis
Pengambilan sampel secara
Sistematis rbagai bisa mengikuti
Berbagai pola, misalnya sigsaz,
Pola huruf X, pola melingkar dsb
Pengukuran Kerusakan karena OPT
• Tingkat kerusakan tanaman akibat hama
dikenal dengan intensitas serangan atau
intensitas kerusakan,
• Besarnya intensitas serangan dinyatakan • Besarnya intensitas serangan dinyatakan
dengan persen.
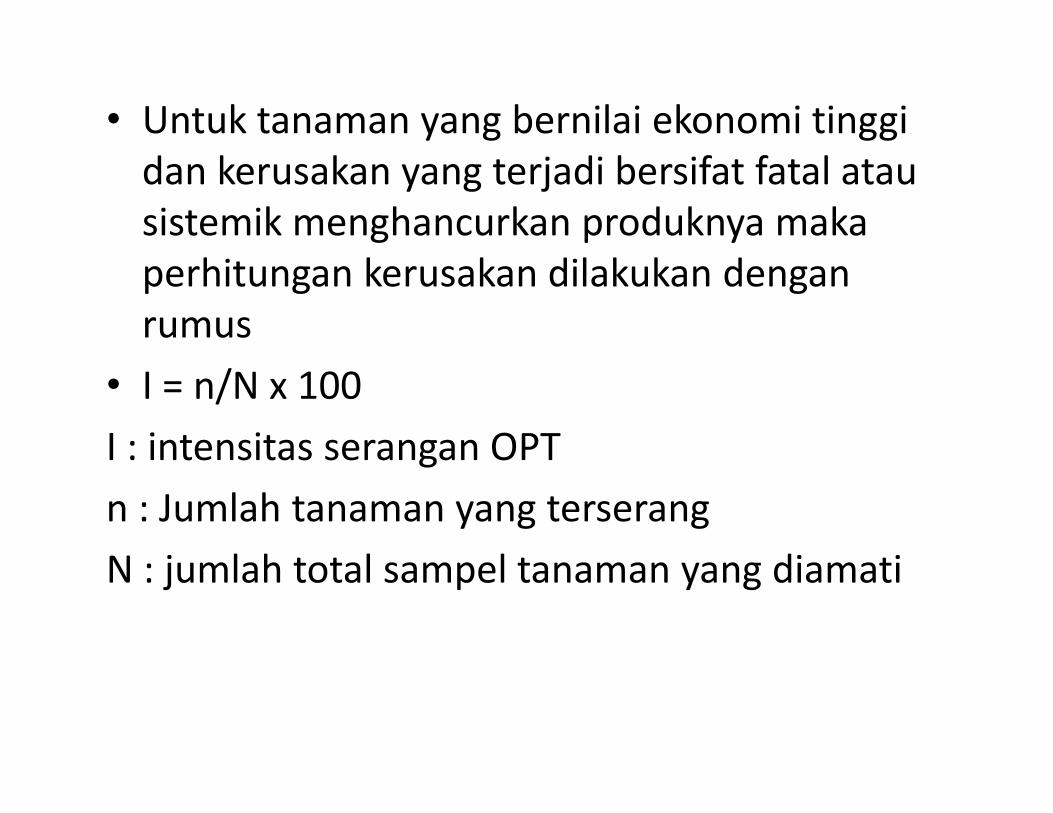
• Untuk tanaman yang bernilai ekonomi tinggi
dan kerusakan yang terjadi bersifat fatal atau
sistemik menghancurkan produknya maka
perhitungan kerusakan dilakukan dengan
rumus
• I = n/N x 100• I = n/N x 100
I : intensitas serangan OPT
n : Jumlah tanaman yang terserang
N : jumlah total sampel tanaman yang diamati
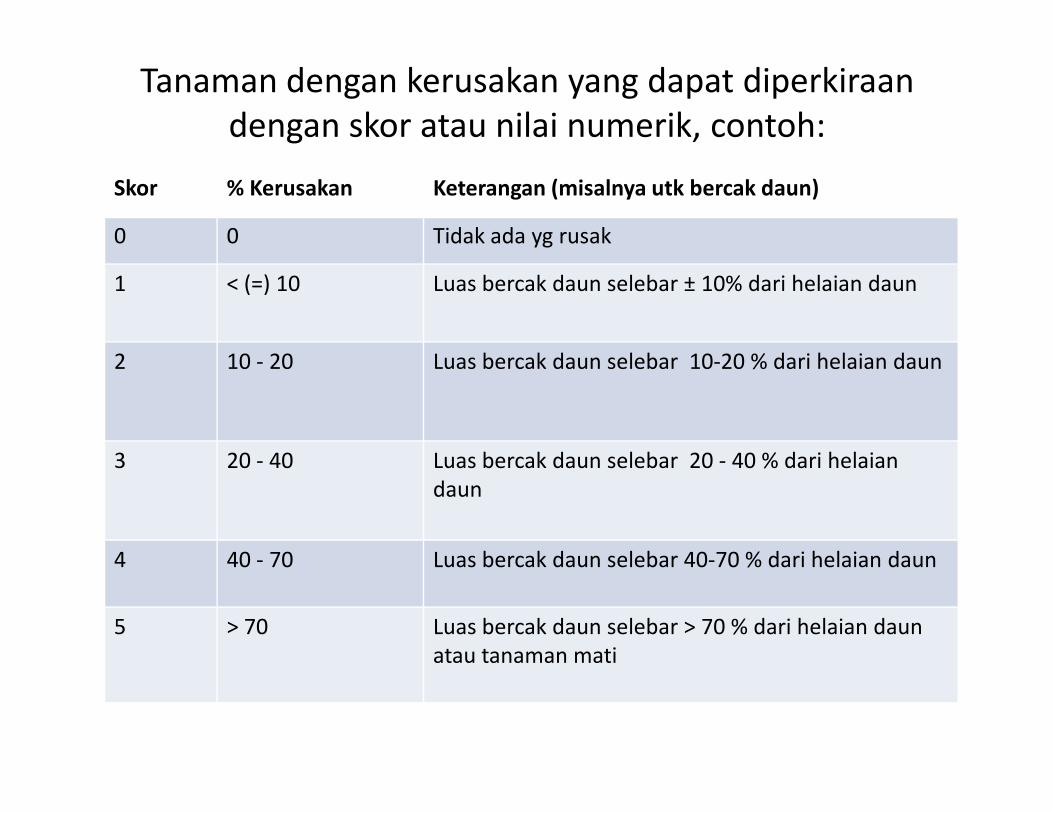
Tanaman dengan kerusakan yang dapat diperkiraan
dengan skor atau nilai numerik, contoh:
Skor % Kerusakan Keterangan (misalnya utk bercak daun)
0 0 Tidak ada yg rusak
1 < (=) 10 Luas bercak daun selebar ± 10% dari helaian daun
2 10 - 20 Luas bercak daun selebar 10-20 % dari helaian daun
3 20 - 40 Luas bercak daun selebar 20 - 40 % dari helaian
daun
4 40 - 70 Luas bercak daun selebar 40-70 % dari helaian daun
5 > 70 Luas bercak daun selebar > 70 % dari helaian daun
atau tanaman mati
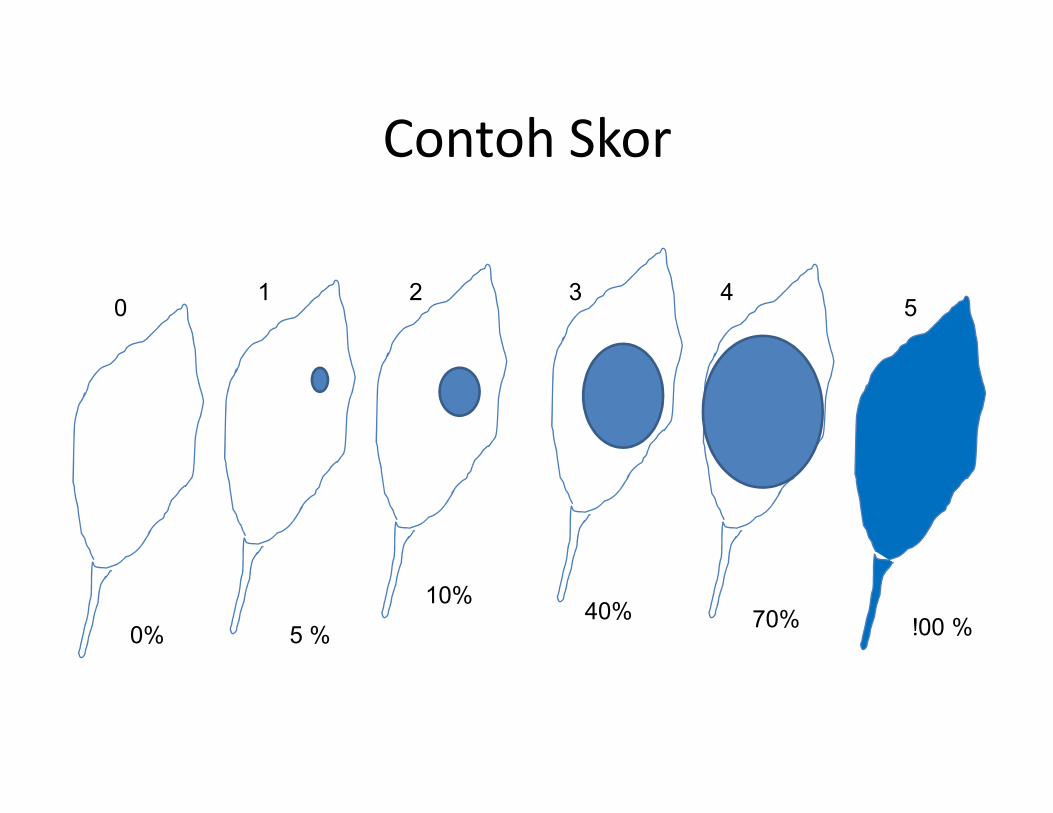
Contoh Skor
01 2 3 4
5
0% 5 %
10%40% 70% !00 %
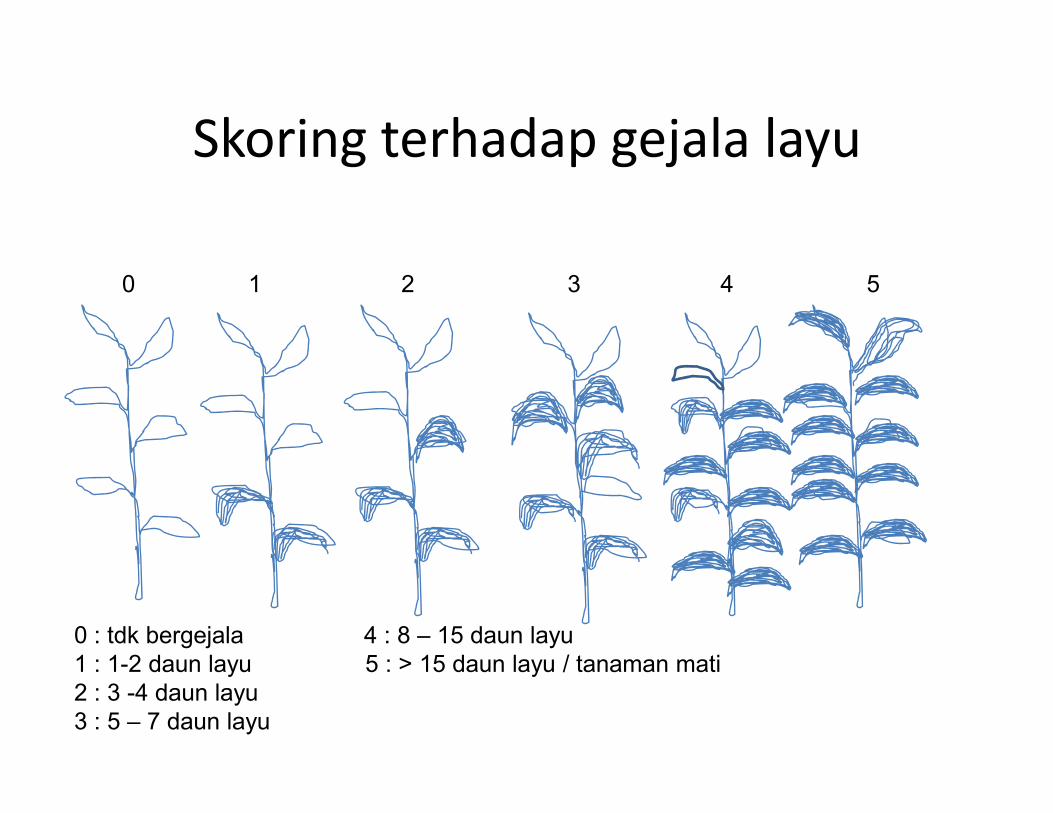
Skoring terhadap gejala layu
0 1 2 3 4 5
0 : tdk bergejala 4 : 8 – 15 daun layu
1 : 1-2 daun layu 5 : > 15 daun layu / tanaman mati
2 : 3 -4 daun layu
3 : 5 – 7 daun layu
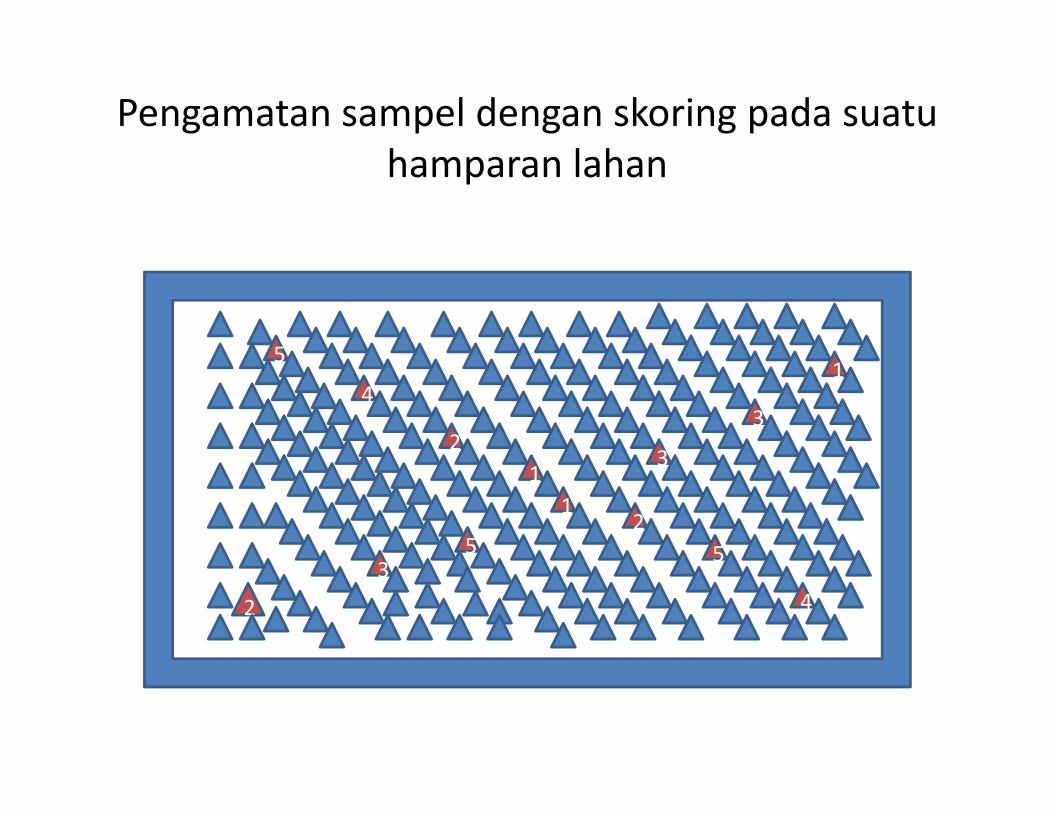
Pengamatan sampel dengan skoring pada suatu
hamparan lahan
5
43
1
2
35
4
2
1
12
5
3
4
3
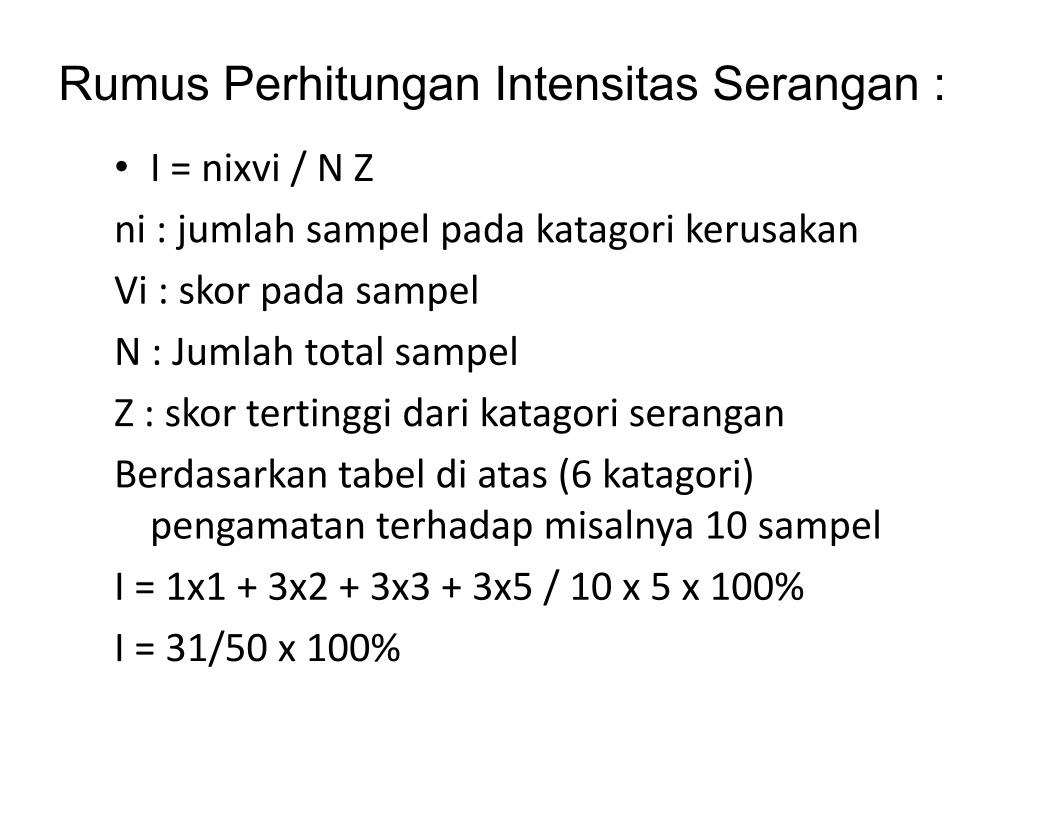
• I = nixvi / N Z
ni : jumlah sampel pada katagori kerusakan
Vi : skor pada sampel
N : Jumlah total sampel
Z : skor tertinggi dari katagori serangan
Rumus Perhitungan Intensitas Serangan :
Z : skor tertinggi dari katagori serangan
Berdasarkan tabel di atas (6 katagori)
pengamatan terhadap misalnya 10 sampel
I = 1x1 + 3x2 + 3x3 + 3x5 / 10 x 5 x 100%
I = 31/50 x 100%
Economic damage, economic injury level,
and economic threshold
• Pest management is considered on the
ecological and economical thresholds
• Ecological consideration is decided on the
analysis that the pest control does not harmful analysis that the pest control does not harmful
to the environment
• Economical consideration is decided on the
analysis that the pest control gives economical
benefit
Economic damage, economic injury level, and
economic threshold
• Economic damage : the amount of injury which will
justify the cost of artificial control measures
• Economic Injury Level (EIL) : the lowest population
density that will cause economic damage.
• Economic threshold : The maximum pest population • Economic threshold : The maximum pest population
that can be tolerated at a particular time and place
without a resultant economic crop lost, the
population density at which control action should be
determined (initiated) to prevent an increasing pest
population (injury) from reaching the economic
injury level.
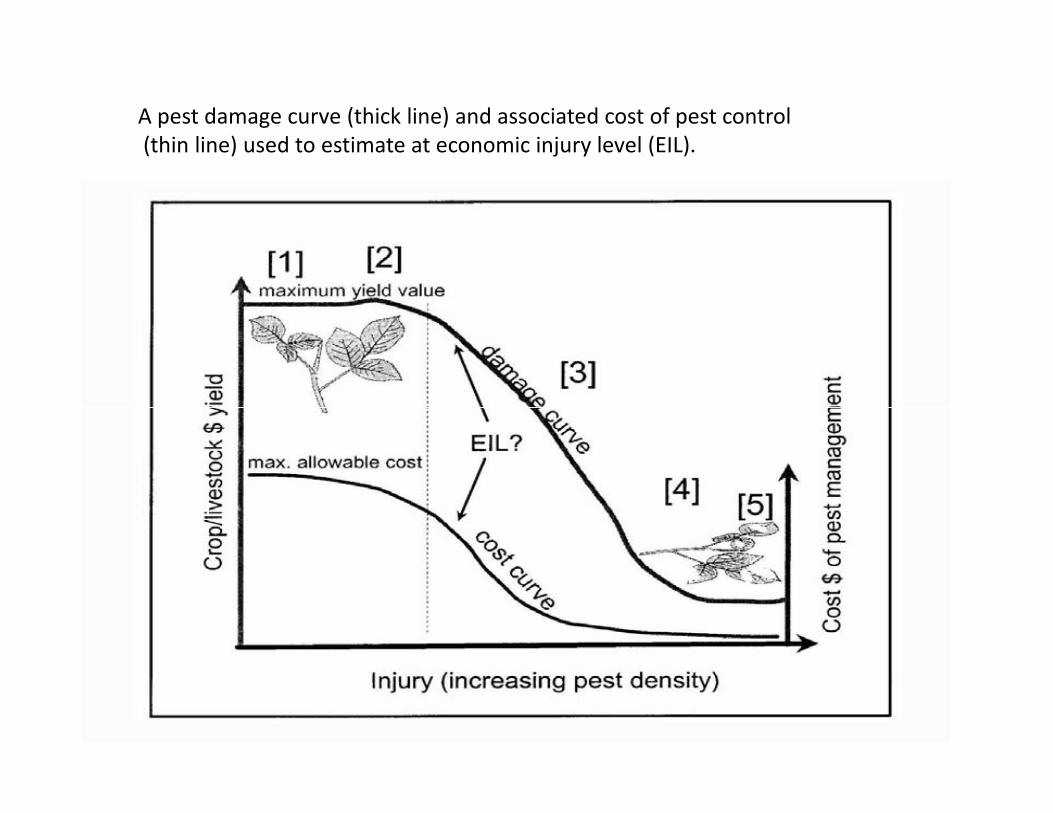
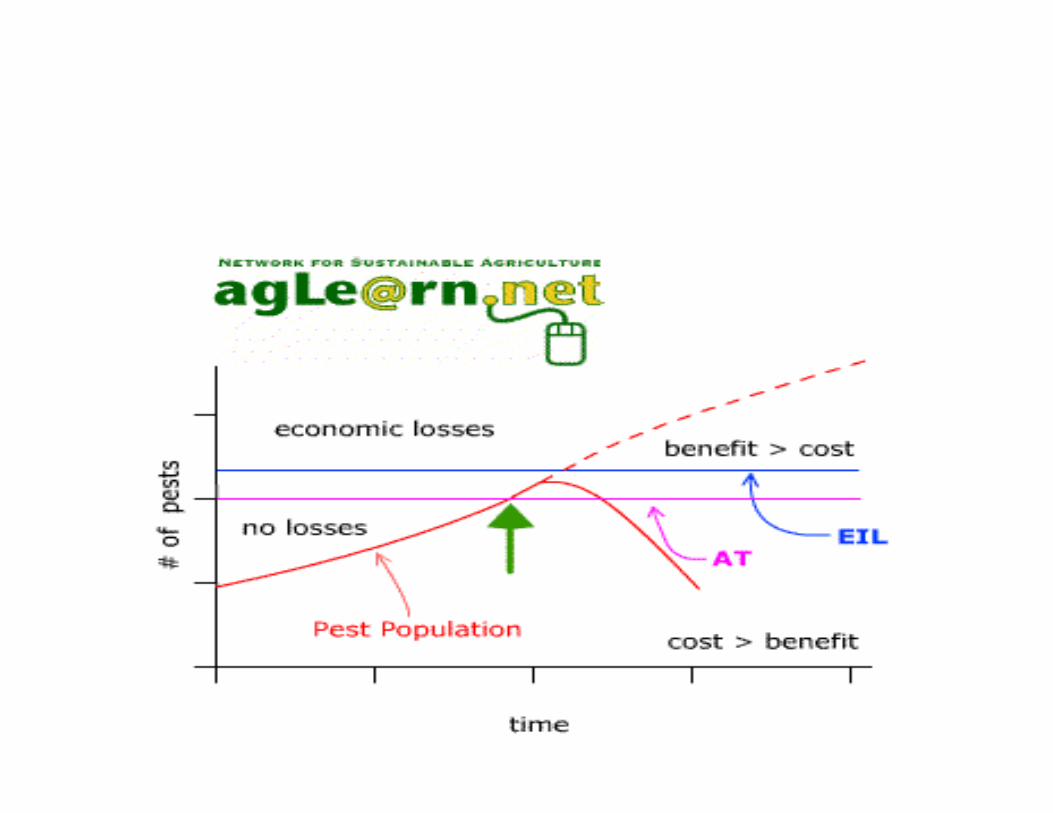
A pest damage curve (thick line) and associated cost of pest control
(thin line) used to estimate at economic injury level (EIL).

This damage curve can take several
forms
1. Tolerance or overcompensation phase no
yield response
2. Positive yield response to injury
3. Linearity phase e.g., yield loss = -a (unit 3. Linearity phase e.g., yield loss = -a (unit
injury) + b),
4. Desensitization and an inherent impunity
phase decreasing
5 No additional yield loss per unit injury.

• The curve can be used with various methods to
determine whether or not any action or pest
management tactic (e.g., pesticide, biological
control, cultural control, etc.) is needed to reduce
the damage associated with this pest.
• This relationship is uniquely characterized by a • This relationship is uniquely characterized by a
critical point, the economic injury level (EIL), or
the point in the agricultural production system
where the costs associated with pest
management equal the benefits from the pest
management actions
• Below the pest population represented by the
EIL there is no need to take pest control
actions because they are not economically actions because they are not economically
justified, but economic damage can occur
when the pest population densities are above
the EIL.


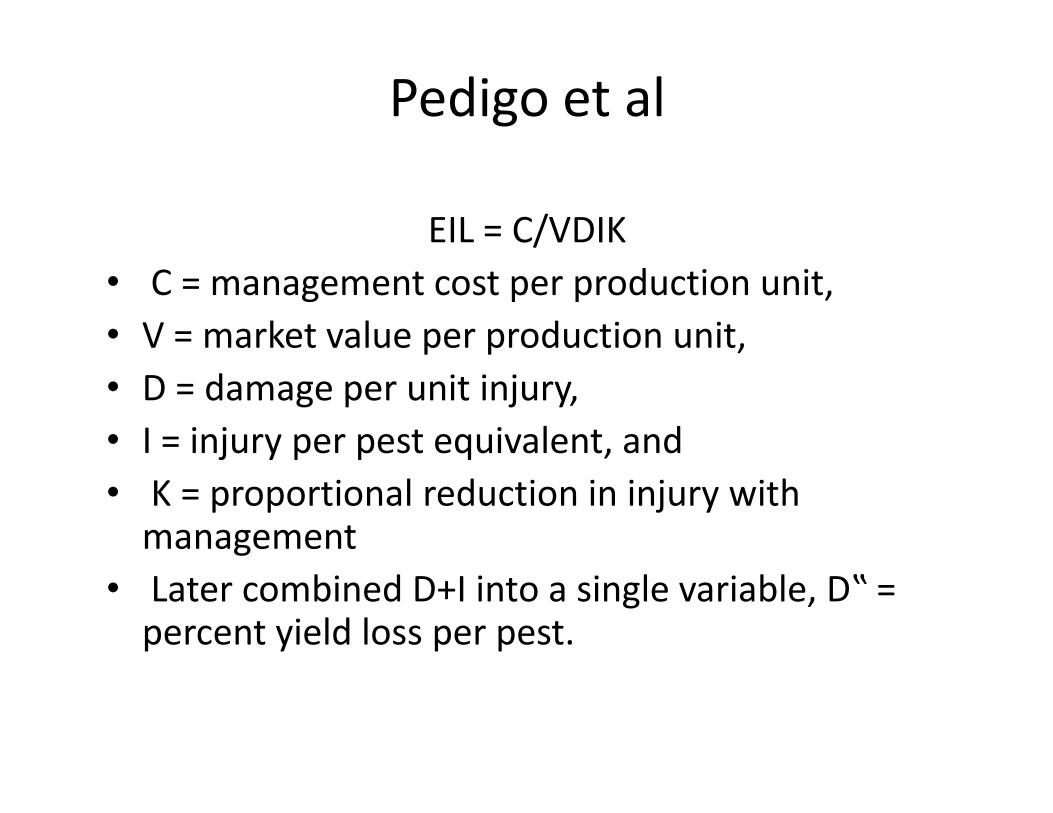
Pedigo et al
EIL = C/VDIK
• C = management cost per production unit,
• V = market value per production unit,
• D = damage per unit injury, • D = damage per unit injury,
• I = injury per pest equivalent, and
• K = proportional reduction in injury with management
• Later combined D+I into a single variable, D‟ = percent yield loss per pest.
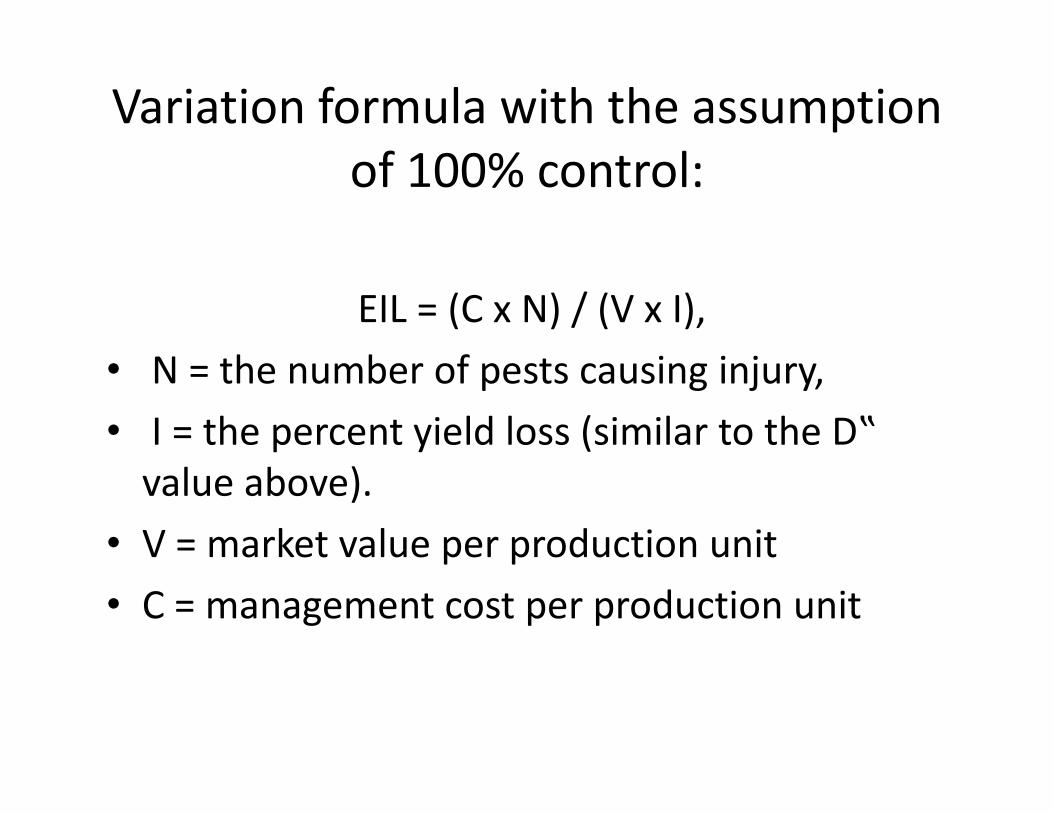
Variation formula with the assumption
of 100% control:
EIL = (C x N) / (V x I),
• N = the number of pests causing injury,
• I = the percent yield loss (similar to the D‟ • I = the percent yield loss (similar to the D‟
value above).
• V = market value per production unit
• C = management cost per production unit
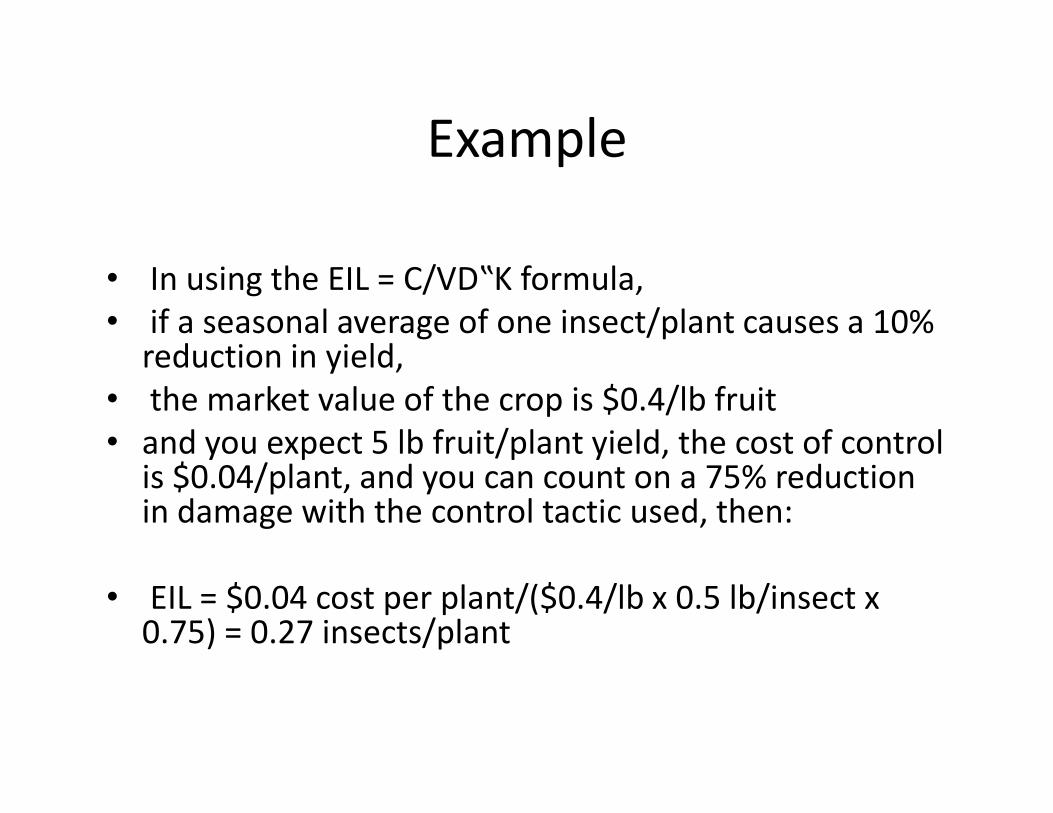
Example
• In using the EIL = C/VD‟K formula,
• if a seasonal average of one insect/plant causes a 10% reduction in yield,
• the market value of the crop is $0.4/lb fruit • the market value of the crop is $0.4/lb fruit
• and you expect 5 lb fruit/plant yield, the cost of control is $0.04/plant, and you can count on a 75% reduction in damage with the control tactic used, then:
• EIL = $0.04 cost per plant/($0.4/lb x 0.5 lb/insect x 0.75) = 0.27 insects/plant

• Notice that if you halve the number of insects
required to inflict 10% yield loss, you halve the
EIL value.
• In contrast, if you double the cost of control
you double the EIL value, again balancing the
tradeoff between control costs and benefits.tradeoff between control costs and benefits.
• In reality, the EIL value can be difficult to
calculate exactly because of the temporal and
dynamic nature of pest damage and crop
value

A two-level, fixed economic threshold with treated (narrow line), i.e.,
effectively controlled to stay below the EIL, and untreated (thick line) pest populations

• Example, an early season average of one
insect might result in 15% yield while late
season results in only 5% yield, so the estimate
based on a seasonal mean would not be very
precise for a given period during the season.precise for a given period during the season.
•One way to avoid large seasonal differences is
to calculate an early-season and a late-season
EIL, for example
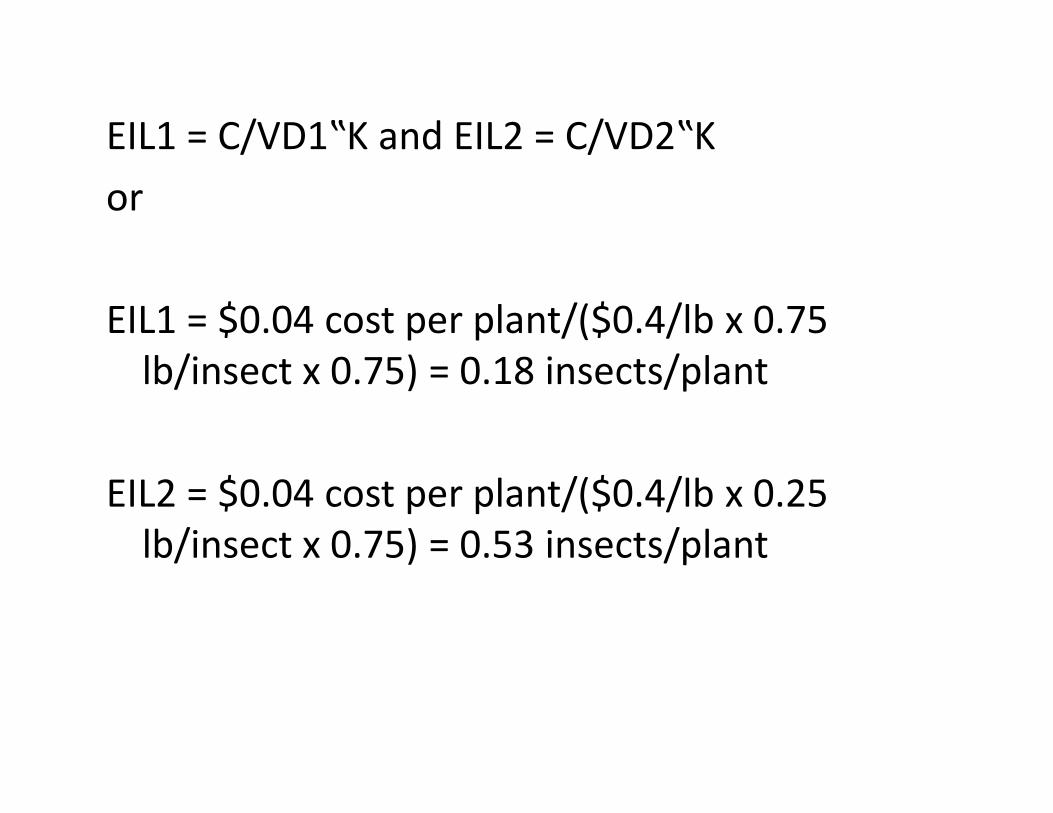
EIL1 = C/VD1‟K and EIL2 = C/VD2‟K
or
EIL1 = $0.04 cost per plant/($0.4/lb x 0.75
lb/insect x 0.75) = 0.18 insects/plant
EIL2 = $0.04 cost per plant/($0.4/lb x 0.25
lb/insect x 0.75) = 0.53 insects/plant
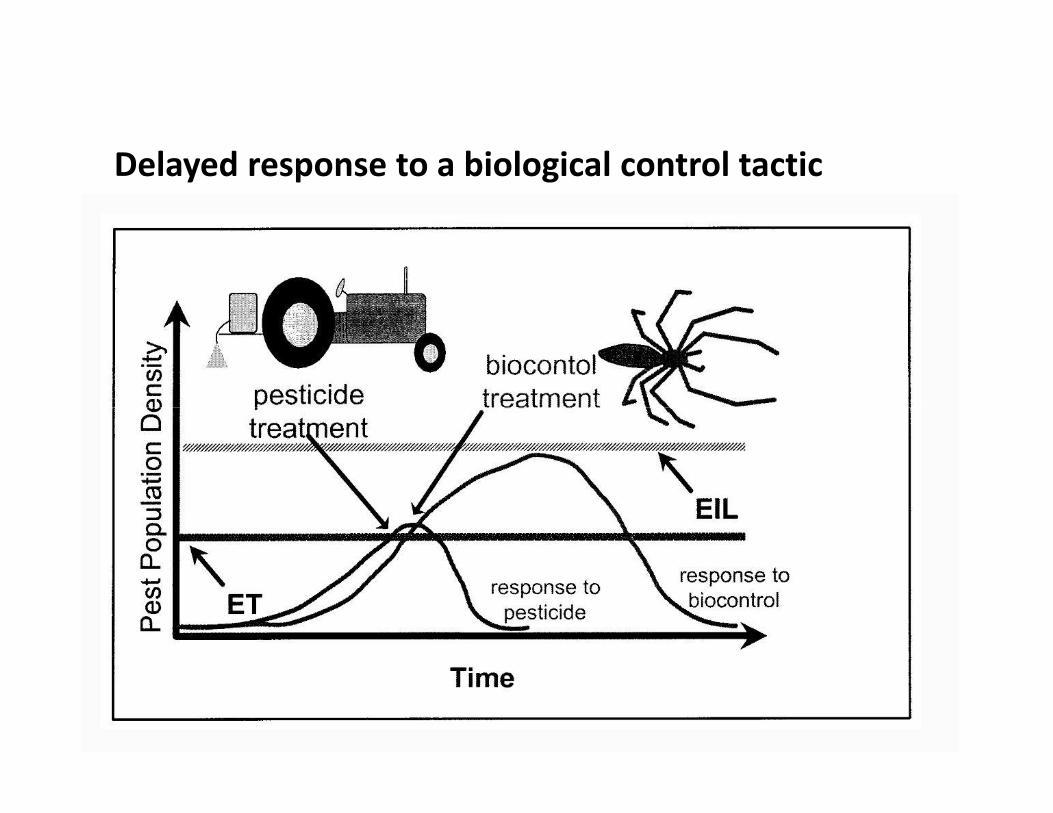
Delayed response to a biological control tactic