jakarta, november 2014 - indocement.co.id · laporan keuangan 2010 rencana strategi investasi...
TRANSCRIPT

Jakarta, November 2014
1

AGENDA
Sekilas Indocement
Kondisi Pasar Semen Domestik Saat ini
Laporan Keuangan 2010
Rencana Strategi Investasi
Tinjauan 2011
General Information about Indocement
Current Domestic Market Condition
Financial Update Q3 2014
Investment Plan Strategy
Outlook 2014
Q & A
2

AGENDA
Sekilas Indocement
Current Domestic Market Condition
Financial Update Q3 2014
Investment Plan Strategy
Outlook 2014
Q & A
General Information about Indocement
3

INDOCEMENT HISTORY 1985
PT Indocement Tunggal Prakarsa (“Indocement”) incorporated
following merger of 6 companies owning 8 cement plants
1989 Public listed of Indocement in the Indonesia Stock Exchange
1991
Acquired the 9th plant in Palimanan
Completed Surabaya cement terminal
Started ready-mix concrete business
1996-1999 Completed the 10th in Palimanan and 11th plants in Citeureup
2001 HeidelbergCement Group became a major shareholder through
its subsidiary Kimmeridge Enterprise Pte. Ltd.
2003 Kimmeridge Enterprise Pte. Ltd. transferred shares in Indocement
to HC Indocement GmbH
2005 Introduced Portland Composite Cement (“PCC”) product to
Indonesian market
2006 HC SE Asia GmbH, was merged into HeidelbergCement AG
which then controlled 65.14% shares of Indocement
2007
Acquisition of 51% stake in PT Gunung Tua Mandiri
Completed modification of the 8th plant which provided an
additional annual capacity of 600,000 tons of cements
2009 Placement of 14.1% Heidelbergcement’s Shares in June 2009
Acquired 12th Plant via merger with PT Indo Kodeco Cement 2000
2010
Additional capacity of 1.5 mt cement mills capacity by August
2010 in Cirebon Factory
2013
On March 25, 2013, the Company has signed the agreement
concerning the equipment supply and engineering with Tianjin Cement Industry Design & Research Institute Co,.Ltd. as part of the construction of a new brownfield project with the capacity of 4.4 mt in Citeureup
Acquisition of PT Tarabatuh Manunggal
4

INDOCEMENT TODAY Leading Indonesian producer of quality & specialty cement products
• 2nd largest cement manufacturer in Indonesia, listed on the Indonesia
Stock Exchange
• Integrated cement operations with a total current production capacity of
20.5mn tons
• Diversified product range including
• PCC, Portland Cement I, II and V, Oil Well Cement, and
• The one and only White Cement producer in Indonesia to date
• One of the world largest cement producer HeidelbergCement Group is
the majority & controlling shareholder – 51%, Salim – 13% and Public –
36%
• As of August 29, 2014 Indocement’s Market capitalization
approximately at IDR 89.2 T (IDR 24,250/share) - one of the largest in
IDX
• As end of 2013, over 7,000 employees (Cement: 4,946 employees;
Ready-Mix & Aggregates: 2,614 Employees)
• Well established “Tiga Roda” brand
5

BOARD OF COMMISSIONERS & BOARD OF DIRECTORS
Board of
Commissioners
Dr. Albert Scheuer
President
Commissioner
Dr. Lorenz Naeger
Commissioner
Daniel Gauthier
Commissioner
Tedy Djuhar
VP Commissioner,
Independent
Commissioner
I Nyoman Tjager
VP Commissioner,
Independent
Commissioner
Dr. Bernd Scheifele
Commissioner
Board of Directors
Kuky Permana
Independent
Director
Franciscus
Welirang
VP Director
Hasan Imer
Director
Ramakanta
Bhattacharjee
Director
Daniel K. Adam
Director
Daniel Fritz
Director
Christian
Kartawijaya
President Director
Benny S.Santoso
Director
M. Jusuf Hamka
Independent
Commissioner
Tju Lie Sukanto
Director
6

INDOCEMENT’S BUSINESS DIVISIONS Cement is the core division comprising over 90% of sales
INDOCEMENT
Cement RMC Others
Citeureup Factory
- 9 plants
Palimanan Factory
- 2 plants
Tarjun Factory - 1
plant
PT Pionirbeton Industri
and PT Indomix
Perkasa* – 40 batching
plants in Jabodetabek,
West Java, and Central
Java – capacity more
than 4.0 mio m3.
PT Dian Abadi Perkasa –
99.9% (Cement Trading)
PT Multi Bangun Galaxy –
99.9% (Terminal-Land
Operation)
PT Pama Indo Mining - 40%
(Mining Services in Tarjun)
PT Bahana Indonor - 100%
(Owns & operates one ship
& one floating terminals)
PT Cibinong Center
Industrial Estate - 50%
(Industrial Estate in
Citeureup)
PT Mineral Industry
Sukabumi
100% (Trass Quarry)
AGGREGATES
PT Mandiri Sentra
Sejahtera – 100%
(Aggregates Business)
PT Tarabatuh
Manunggal – 100%
(Aggregates Business)
7

INDOCEMENT FACTORY AND TERMINAL LOCATIONS
Citeureup Factory
9 plants with
production capacity
of 13.8mt
Tj. Priok Terminal
Palimanan Factory
2 plants with production
capacity of 4.1mt
Surabaya Terminal
Lombok Terminal
Tarjun Factory
1 plant with production
capacity of 2.6mt
One of the largest integrated factory complex in the world at Citeureup
State of the art technology with some of the most efficient kilns in operation today
Total current capacity is 20.5 mt of cement
Cement distribution using train for some locations
Banyuwangi Terminal
Samarinda Terminal
Denpasar
Terminal
8
AGENDA
General Information about Indocement
Current Domestic Market Condition
Financial Update Q3 2014
Investment Plan Strategy
Outlook 2014
Q & A
Current Domestic Market Condition
9
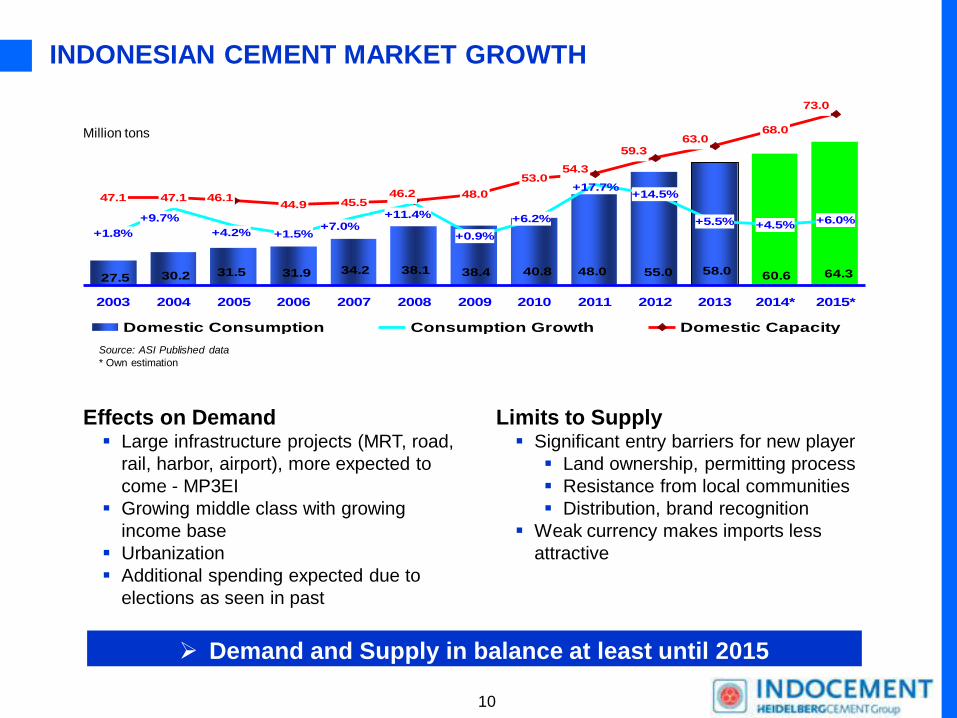
INDONESIAN CEMENT MARKET GROWTH
Source: ASI Published data
* Own estimation
Effects on Demand Large infrastructure projects (MRT, road,
rail, harbor, airport), more expected to
come - MP3EI
Growing middle class with growing
income base
Urbanization
Additional spending expected due to
elections as seen in past
Limits to Supply Significant entry barriers for new player
Land ownership, permitting process
Resistance from local communities
Distribution, brand recognition
Weak currency makes imports less
attractive
Demand and Supply in balance at least until 2015
40.827.5
31.5 31.9 34.2 38.1 38.430.2 64.360.658.055.048.0
+1.8% +1.5% +0.9%
+5.5% +4.5% +6.0%
+4.2%
+11.4%
+17.7%
+6.2%+9.7%+7.0%
+14.5%47.144.9 45.5
68.0
47.1
53.0
48.046.246.1
73.0
63.059.3
54.3
2003 2004 2005 2006 2007 2008 2009 2010 2011 2012 2013 2014* 2015*
Domestic Consumption Consumption Growth Domestic Capacity
Million tons
10

CURRENT TRADING – September 2014 Indocement sales volumes comparison
9.6 mt10.0 mt10.7 mt
12.3 mt 11.8 mt12.8 mt
17.9 mt 18.0 mt
12.9 mt 13.2 mt
0.1 mt
15.4 mt
2.5 mt3.2 mt 3.8 mt
2.3 mt 1.6 mt 1.0 mt 0.6 mt 0.22 mt0.1 mt 0.18 mt
2005 2006 2007 2008 2009 2010 2011 2012 2013 Sep-13 Sep-14
Domestic Export
29.7%30.6% 30.9%
31.7%
30.2%30.9%
31.5%32.0%
30.4% 30.5% 30.2%
Market Share
YTD September 2014, Indocement’s domestic sales volume increase by 2.14% YoY
Export sales volume was decreased by 34% to 120.8 k tons (previous year: 183.1 k tons).
11
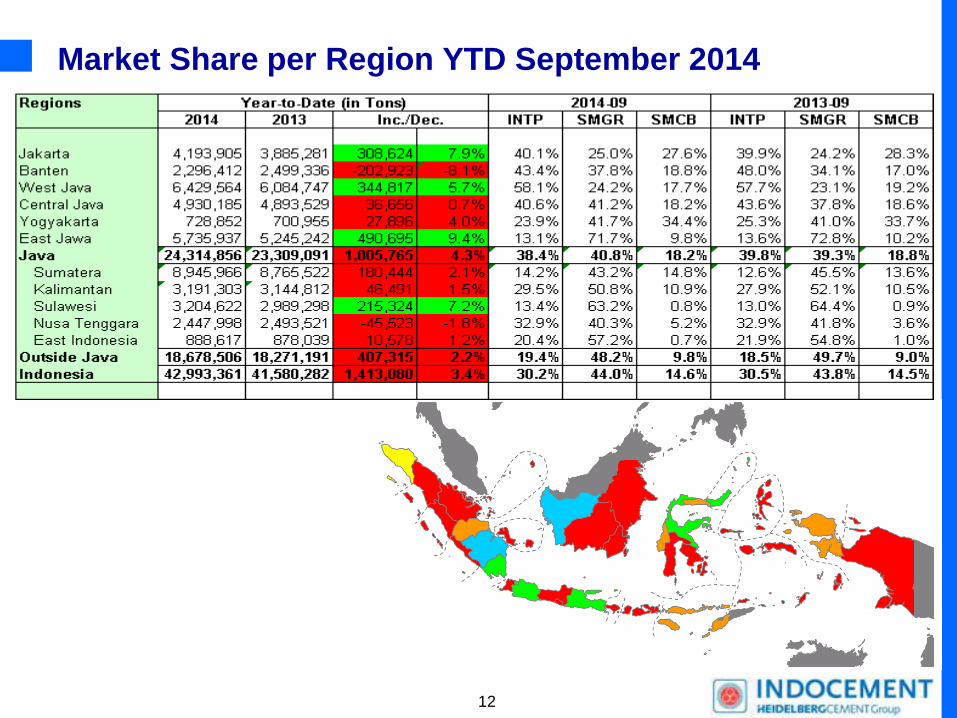
Market Share per Region YTD September 2014
12

AND THERE IS STILL MORE POTENTIAL
Source: Deutsche Bank
Indonesia cement consumption per capita increased by 60% from 143 kg/capita in 2005 to
229 kg/capita in 2013
Reached an all-time high but still one of the lowest cement consumption per capita
compared to its peers
Cement consumption per capita in 2013
Indonesia likely to catch up with its peers in the near future
1,774
1,116
554 493
229 207 210 143
0
200
400
600
800
1,000
1,200
1,400
1,600
1,800
2,000
CH* SG VN TH ID PH IN
kg/capita
ID
2005
13
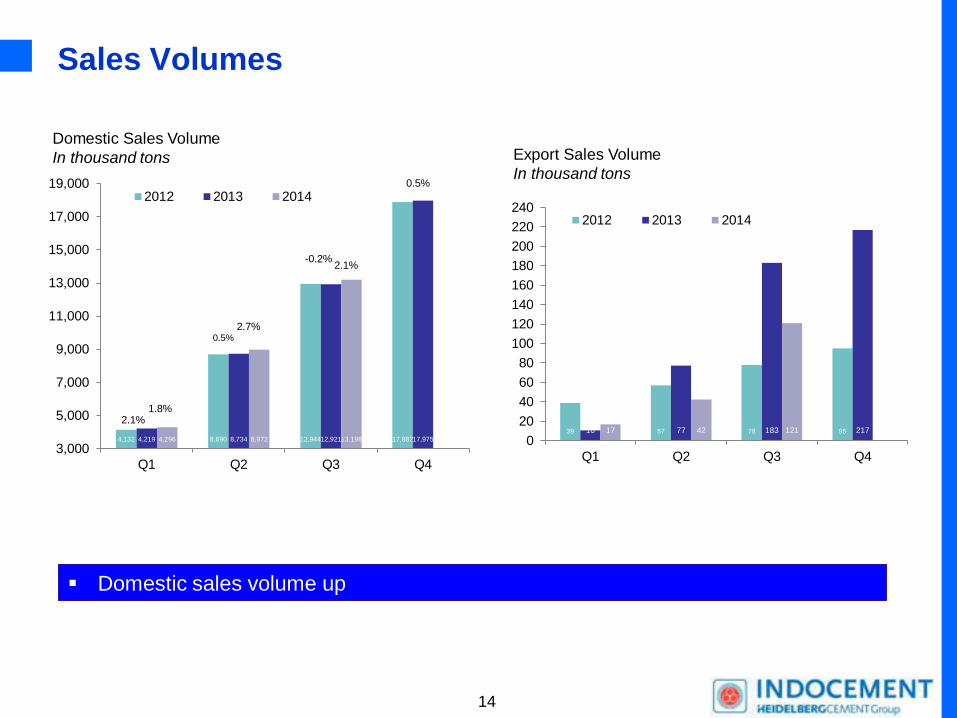
Sales Volumes
4,132 8,690 12,944 17,882 4,219 8,734 12,921 17,975 4,296 8,972 13,198
3,000
5,000
7,000
9,000
11,000
13,000
15,000
17,000
19,000
Q1 Q2 Q3 Q4
2012 2013 20140.5%
39 57 78 95 10 77 183 217 17 42 121
0
20
40
60
80
100
120
140
160
180
200
220
240
Q1 Q2 Q3 Q4
2012 2013 2014
Domestic Sales Volume
In thousand tons Export Sales Volume
In thousand tons
2.1%
0.5%
-0.2%
1.8%
2.7%
Domestic sales volume up
2.1%
14

AGENDA
General Information about Indocement
Current Domestic Market Condition
Financial Update 2010
Investment Plan Strategy
Outlook 2014
Q & A
Financial Update Q3 2014
15

Consolidated Income Statement
Q3 2014 Q3 2013 Change
IDR Bio IDR Bio %
Total Sales Volume (thousand tons) 13,318 13,104 1.6%
In Billion IDR
Net Revenues 14,166.9 13,348.0 6.1%
Cost of Revenues (7,819.2) (7,098.6) 10.2%
GROSS PROFIT 6,347.6 6,249.5 1.6%
% of Net Revenues 44.8% 46.8%
Operating Expenses (2,288.9) (1,902.7) 20.3%
Other Operating Income (Expenses) 75.7 82.6 -8.4%
OPERATING INCOME 4,134.5 4,429.4 -6.7%
% of Net Revenues 29.2% 33.2%
EBITDA 4,781.8 5,031.0 -5.0%
% of Net Revenues 33.8% 37.7%
Finance Income 613.2 341.4 79.6%
Equity in Net Earnings of Associated Companies - Net 17.2 12.3 39.6%
INCOME FOR THE PERIOD 3,719.4 3,609.1 3.1%
Other Comprehensive Income (Expenses) (88.0) 201.6 -143.7%
TOTAL COMPREHENSIVE INCOME FOR THE PERIOD 3,631.4 3,810.6 -4.7%
Description
16
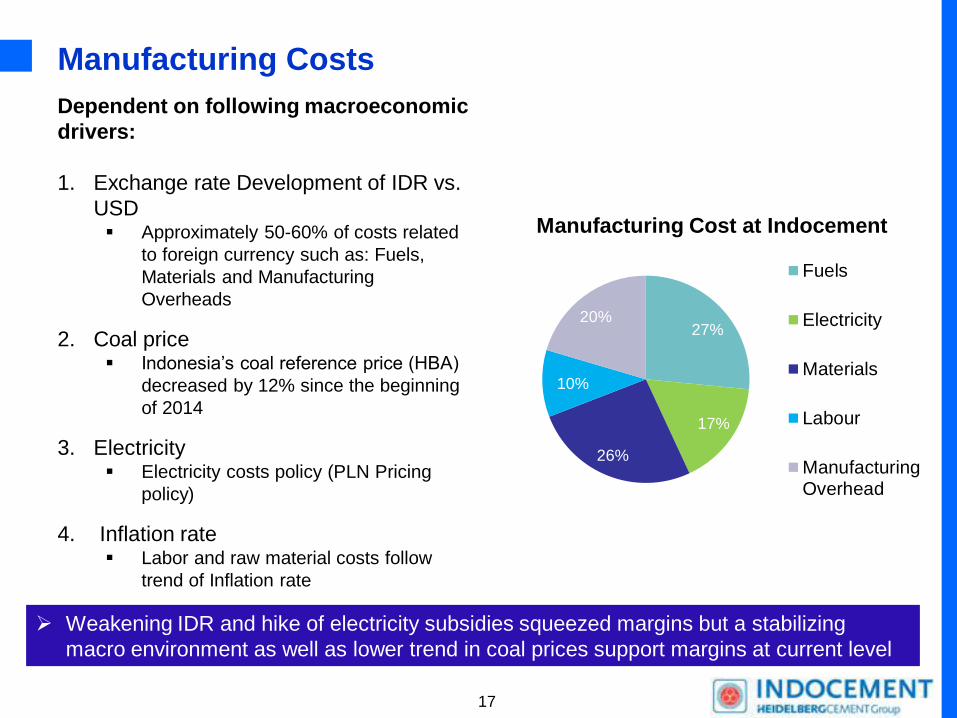
Manufacturing Costs
27%
17%
26%
10%
20%
Fuels
Electricity
Materials
Labour
ManufacturingOverhead
Dependent on following macroeconomic
drivers:
1. Exchange rate Development of IDR vs.
USD Approximately 50-60% of costs related
to foreign currency such as: Fuels,
Materials and Manufacturing
Overheads
2. Coal price Indonesia’s coal reference price (HBA)
decreased by 12% since the beginning
of 2014
3. Electricity Electricity costs policy (PLN Pricing
policy)
4. Inflation rate Labor and raw material costs follow
trend of Inflation rate
Manufacturing Cost at Indocement
Weakening IDR and hike of electricity subsidies squeezed margins but a stabilizing
macro environment as well as lower trend in coal prices support margins at current level
17

Operational efficiency improvements
New vertical raw mill
Capacity: 1.9m tons
In operation since May
Lower energy consumption compared to other
mills
Lower clinker ratio possible due to distinct
technical specifications of the VRM
Capable to grind the slag in significant amount
Slag contract with Posco + Indoferro
Replacement for clinker in cement production, hence lower clinker
ratio
1
2
This will help to further enhance margins
18

AGENDA
General Information about Indocement
Current Domestic Market Condition
Financial Update Q3 2014
Investment Plan Strategy
Outlook 2014
Q & A
Investment Plan Strategy
19

Projects
New cement mill with capacity of 1.9 MT in Citeureup which is in
operation in Q2 2014
1 brownfield project with capacity of 4.4 million tons with an overall
investment value of IDR 5.5 to 6.5 trillion
2 greenfield projects with capacity of 2.5 million tons, one in Central
Java and one outside Java
CAPACITY EXPANSION TO PARTICIPATE IN INDUSTRY GROWTH
16.6 3017.1 18.6 20.6 25
2005 2007 2010 2014 2015/2016 2017/2020
Million Tons
+ 0.6 mt + 1.5 mt
+ 1.9 mt + 4.4 mt
+ 5 mt
Strategically well positioned to capitalize on further demand
20

Potential Capacity Increase
Citeureup
2014: 13.8m tons
2015: Brownfield 4.4m tons
Investment: USD 150/ton
Cirebon
2014: 4.1m tons Central Java
2018: Greenfield 2.5-3m tons
Investment: 200-250 USD/ton
Tarjun
2014: 2.6m tons
North Sumatra
2018: Greenfield 2.5-3m tons
Investment: 200-250 USD/ton
21

READY-MIX CONCRETE EXPANSION
• Indocement keeps strengthening its ready-mix concrete in
order to meet the increase of demand in ready mix concrete
for the construction of residential and high rise building in
Jakarta and West Java area by heavily investing in new
batching plants and mixer trucks. This has brought some
contribution to gain more market share.
• Following the rising trend of cement demand and increased
capacity, the sales volume of ready-mix business growth
significantly in the last 2 years.
• The 2013 sales volume has increased around 26%
• Ytd September 2014 sales volume decreased by 11% YoY
due to slowing down of construction activities across nation.
• One of the market leader in RMC business
800630 683
930 9561,221
2,429
4,430
3,209
2,860
3,517
100
400700
1,0001,300
1,6001,900
2,2002,500
2,800
3,1003,400
3,7004,000
4,3004,600
4,900
20052006
20072008
20092010
20112012
2013
Sep-13
Sep-14
000m3
22

AGENDA
General Information about Indocement
Current Domestic Market Condition
Financial Update Q3 2014
Investment Plan Strategy
Outlook 2011
Q & A
Outlook 2014
23

Outlook for Year-end 2014
Market Environment
• National market 2014 still estimated to grow about 4~5%
• Infrastructure projects expected to pick-up with the election of the new
government
• Changing market environment as new competitors are entering the market
• Hike in electricity costs will hamper the margin of each cement factory in
Indonesia so there is a common need to pass through such costs in near future
Indocement Outlook
Further focus on margin improvement
Will run with the most efficient kilns in operation (P10 & P11 back to their
normal operation from May 2014, after had their major overhaul and stoppage)
Recapture market share while keeping the efforts to pass through the cost
increase to the market if possible
Proceeding with planned capacity expansion projects
24

AGENDA
General Information about Indocement
Current Domestic Market Condition
Financial Update Q3 2014
Investment Plan Strategy
Outlook 2011
Q & A
Outlook 2014
25

Thank you
26