issn 1410 4695 - jdpendidikan.files.wordpress.com file133 analisis pengaruh budaya organisasi dan...
TRANSCRIPT

ISSN 1410 4695
Diterbitkan oleh:
Fakultas Keguruan dan Ilmu Pendidikan
Universitas Kristen Indonesia
Volume 7 Nomor 3 Hal.133-178Jakarta
November 2014ISSN
1410 4695

[email protected] website: http://jdpendidikan.com
i
ISSN 1410 4695
Volume 7 Nomor 3, November 2014
DAFTAR ISI Halaman
ANALISIS PENGARUH BUDAYA ORGANISASI DAN KOMITMEN TERHADAP KINERJA DOSEN PERGURUAN TINGGI SWASTA ....... 133 - 141
Ahmad Dirwan
STUDENTS’ PERCEPTION OF BLENDED LEARNING ENVIRONMENT IN CALL COURSE: ADVANTAGES, LIMITATIONS, AND SUGGESTIONS FOR IMPROVEMENT.............. 143 - 148
Kristasia Rombe
PENGARUH PENJAMINAN MUTU, KEPEMIMPINAN TRANSFORMASIONAL, BUDAYA AKADEMIK DAN KOMITMEN KERJA TERHADAP KINERJA DOSEN DI KOTA JAMBI ................... 149 - 156
Erni Murniarti
IMPROVING UNIVERSITY STUDENTS’ READING COMPREHENSION USING GRAPHIC ORGANIZERS ....................... 157 - 164
Juella Rumiris
THE EFFECT OF USING TABOO GAME TO NINTH GRADERS’ SPEAKING SKILL ........................................................................... 165 - 170
Yusup Kuncoro Bowo Susilo
NATIVE ENGLISH SPEAKER TEACHERS (NESTS) AND NON-NATIVE ENGLISH SPEAKER TEACHERS (NNESTS) IN INDONESIA: PREFERENCE AND DILEMMA .................................... 171 - 178
Kartika Septarini

133
ANALISIS PENGARUH BUDAYA ORGANISASI DAN KOMITMEN TERHADAP KINERJA DOSEN PERGURUAN TINGGI SWASTA
Ahmad Dirwan
Email: [email protected] Program Magister Manajemen Universitas Suryadarma Jakarta
ABSTRACT
This reserach was conducted to determine the influence of organizational behavior and commitment towards lecturers’ performance at private universities in Jakarta. The method used in this research is the survey method. The samples in this research were 90 lecturers of private universities who were selected randomly. The technique used to analyze the obtained data was a path analysis by employing SPSS program. The results indicated that: (1) there was influence of organizational behavior towards the lecturers’ performance, (2) there was influence of commitment towards the lecturers’ performance, (3) there was influence of organizational behavior and commitment simultaneously towards the lecturers’ performance.
Keywords: organizational behavior, commitment, lecturer performance
ABSTRAK
Tujuan dari penelitian ini adalah untuk mengetahui pengaruh budaya organisasi dan komitmen terhadap kinerja dosen di Perguruan Tinggi Swasta (PTS) Jakarta. Metoda penelitian yang digunakan adalah survei. Sampel penelitian ini adalah sebanyak 90 dosen PTS, dan diambil dengan teknik ramdom. Analisis data yang dipakai dalam penelitian adalah analisis jalur. Hasil pengujian data diperoleh dengan menggunakan Program SPSS. Dari hasil penelitian dapat disimpulkan bahwa: (1) terdapat pengaruh dari budaya organisasi terhadap kinerja dosen, (2) terdapat pengaruh dari komitmen terhadap kinerja dosen, (3) terdapat pengaruh budaya organisasi dan komitmen secara bersama-sama terhadap kinerja dosen PTS Jakarta.
Kata kunci: budaya organisasi, komitmen, kinerja dosen
PENDAHULUAN
Menghadapi pemberlakuan Masyarakat Ekonomi ASEAN (2115), perguruan tinggi Indonesia harus dapat bersaing dengan per-guruan tinggi negara-negara anggota ASEAN melalui peningkatan kualitas. Salah satu syarat menjadi Perguruan Tinggi (PT) berkualitas, de-ngan raihan predikat World Class University (WCU) sebagai parameter, adalah 40 persen dosennya bergelar doktor dan tiap dosen mempublikasikan dua artikel dalam jurnal inter-nasional per tahun. PT di Indonesia, terutama Perguruan Tinggi Swasta (PTS), masih sulit mencapai hal tersebut karena terbatasnya kemam-puan untuk meningkatkan kualitas dosen dan kurangnya pendanaan untuk mengembang-kan penelitian. Hal ini diperparah oleh ren-dahnya kesadaran dosen untuk me-lakukan riset serta minimnya hasil riset yang bisa dikem-bangkan dan berdayaguna bagi masyarakat seki-tar.
Di samping itu untuk menyongsong era Indonesia masuk kelompok tujuh kekuatan ekonomi dunia pada 2030, ditargetkan men-cetak 113 juta tenaga terdidik, yang saat ini hanya 55 juta (Santosa, 2014, h. 6). Hal ini juga sejalan dengan platform JKW-JK yang mem-prioritaskan pembangunan pendidikan, yang antara lain diupayakan melalui peningkatan kualitas guru/dosen dengan merekrut tenaga berkualitas dan mengutamakan pembiayaan penelitian pengembangan Iptek unggulan yang terintegrasi dengan pengembangan pendidikan tinggi.
Untuk merealisasikan hal ini, diperlukan Perguruan Tinggi Swasta (PTS) yang selalu meningkatkan kualitas—yang dimaknai sebagai (1) suatu sifat atau atribut yang khas dan mem-buat berbeda; serta (2) memiliki standar dan sifat kebaikan tertinggi. Kemampuan PTS untuk memenuhi kebutuhan dan keinginan masyarakat pada umumnya masih terbatas. Hal ini ditunjuk-kan oleh kenyataan sebagian besar PTS belum

Volume 7, Nomor 3, November 2014 : 133-141
134
terakreditasi. Penekanan pada peningkatan kua-litas dan relevansi pendidikan dimaksudkan agar sistem pendidikan tetap serasi dan selaras dengan kebutuhan pembangunan, khususnya menghadapi era industrialisasi masyarakat Indo-nesia. Penekanan ini merupakan salah satu tema pembangunan pendidikan, yang diartikan dengan kesesuaian antara pendidikan dengan kebutuhan pembangunan.
Beberapa hal yang mempengaruhi kua-litas pendidikan adalah kebiasaan kerja, budaya kerja, dan budaya organisasi yang saling ber-hubungan. Budaya kerja dan budaya organisasi yang berkualitas akan dapat meningkatkan kua-litas pendidikan secara optimal. Menghadapi tantangan tersebut, dalam persaingan antar-bangsa yang semakin ketat serta kemampuan untuk dapat melaksanakan agenda pembangu-nan bangsa, dituntut tersedianya sumber daya dosen berkualitas dengan prestasi tinggi, yang didukung oleh komitmen yang kuat untuk me-ningkatkan kinerja.
Kotler (2000) menyatakan bahwa kinerja adalah “successful role achievement” yang di-peroleh seseorang dari perbuatan-perbuatan-nya. Batasan menekankan bahwa kinerja adalah hasil yang dicapai oleh seseorang menurut ukur-an yang berlaku untuk pekerjaan yang ber-sangkutan. Sedangkan As’ad (1982, h. 47) menekankan bahwa kinerja merupakan tingkat keberhasilan (level of performance) seseorang di dalam melaksanakan tugas pekerjaannya. Biasa-nya seseorang dengan level of performance yang tinggi disebut sebagai orang yang pro-duktif, dan sebaliknya seseorang yang level of performance-nya rendah (tidak mencapai sta-ndar) dikatakan sebagai tidak produktif. Secara lebih terperinci, Gomes (2006) membatasi kiner-ja sebagai: (1) quantity of work yang merupakan jumlah kerja dan kualitas kerja yang dicapai dalam periode tertentu; (2) creativeness yaitu keaslian gagasan dan tindakan menyelesaikan persoalan; (3) dependability, kesadaran dalam penyelesaian kerja; (4) initiative, semangat dan tanggung jawab melaksanakan ide dan tugas baru; dan (5) personal qualities, yang menyangkut kualitas kepribadian.
Sementara itu penilaian kinerja adalah suatu diskripsi sistematis yang berkaitan dengan kekuatan dan kelemahan individu atau kelompok terhadap suatu pekerjaan. Casio (1987, h. 59) dalam konteks pengelolaan sumber daya manu-sia, penilaian kinerja secara formal mempunyai tujuan sebagai berikut: (1) penilaian kinerja dapat digunakan sebagai dasar pembuatan kebijakan
yang berkaitan dengan ketenagakerjaan, (2) hasil penilaian dapat digunakan sebagai krite-ria/standar dalam penelitian sumber daya manu-sia, (3) hasil penilaian dapat digunakan sebagai prediktor, (4) hasil penilaian dapat digunakan untuk menyusun program-program pelatihan, (5) hasil penilaian dapat memberikan umpan balik bagi yang dinilai, (6) hasil penilaian dapat digunakan untuk memperkirakan kondisi organ-isasi dan kemungkinan pengembangannya.
Selanjutnya, PTS sebagai institusi dan sis-tem sosial memiliki karakteristik budaya sendiri yang merupakan akumulasi dari budaya organ-isasi perguruan tinggi dan budaya individu. Bu-daya individu seorang dosen berbeda dengan budaya individu dosen lainnya, sehingga PTS sebagai suatu sistem sosial memiliki budaya yang beragam dan dipengaruhi oleh sistem nilai, per-sepsi, kebiasaan-kebiasaan, kebijakan pendidikan dan perilaku orang-orang yang berada di da-lamnya. Menurut Suyata (1996) budaya kerja yang dapat meningkatkan kualitas adalah: (1) disiplin diri; (2) mengontrol kemajuan pengajaran; (3) harapan yang tinggi kepada dosen; dan (4) fokus perhatian warga institusi pendidikan kepada proses pembelajaran. Budaya kerja merupakan satu budaya dalam organisasi yang mengarah kepada satu sistem makna ber-sama yang dianut oleh anggota-anggota yang membedakan organisasi yang satu dengan or-ganisasi lain. Budaya juga dapat dilihat sebagai suatu perilaku, nilai-nilai, sikap dan cara hidup untuk melakukan penyesuaian dan sekaligus cara untuk melihat persoalan dan menyelesaikannya (Zamroni, 2003). Budaya organisasi merupakan asumsi, keyakinan, nilai-nilai dan persepsi ber-sama anggota-anggota organisasi yang memben-tuk dan memberi kesan ke atas sikap, perilaku, serta petunjuk dalam menyelesaikan masalah.
Woolfolk (1993, h. 24) mengatakan, “The meaning we attach to the information re-ceived through our senses is called perception. This meaning is constructed partly from objec-tive reality and partly form the way we organize the information based on our exixting knowledge.” Sensasi berpikir dan memori me-nentukan persepsi. Persepsi adalah penyimpulan dan penafsiran obyek atau peristiwa. Penyim-pulan dan penafsiran atas suatu objek atau peri-stiwa harus didahului oleh sensasi. Sensasi ada-lah kemampuan indera untuk menangkap obyek atau peristiwa kemudian melahirkan pe-ngalaman dan pengetahuan. Dengan demikian pengetahuan merupakan hasil berpikir dan per-sepsi, yang melibatkan sensasi, memori, atensi, ekspektasi, dan motivasi.
Dirwan, Analisis Pengaruh Budaya Organisasi dan Komitmen Terhadap Kinerja Dosen Perguruan Tinggi Swasta
135
Selanjutnya, budaya organisasi melahirkan norma-norma. Norma merupakan standar yang diterima oleh anggota organisasi yang mempu-nyai karakteristik tertentu atau suatu peraturan yang tidak tertulis, antara lain: Pertama, norma hanya dibentuk sehubungan dengan hal-hal yang penting bagi anggota organisasi. Jika dapat membantu anggota lain dalam organisasi untuk menyelesaikan suatu tugas merupakan hal yang paling penting, maka akan berkembanglah suatu norma. Kedua, norma diterima dalam berbagai macam tingkat oleh para anggota organisasi, ada beberapa norma diterima oleh para anggota secara lengkap, sedangkan norma lain hanya diterima sebagian. Maka dapat dikatakan bahwa norma merupakan kesepakatan yang menjadi aturan yang tidak tertulis, tetapi tersirat dan dipahami sesama anggota organisasi.
Secara sederhana budaya organisasi dapat diungkapkan sebagai cara berpikir, cara bekerja, cara laku para karyawan atau dosen da-lam melakukan tugas pekerjaan mereka masing-masing. Dengan demikian budaya organisasi dapat digambarkan sebagai kumpulan dari nilai, norma, ungkapan dan perilaku yang ikut menen-tukan bagaimana orang-orang dalam organisasi saling berhubungan dan sebesar apa mereka gunakan tenaga mereka dalam pekerjaan pada organisasinya.
Sedangkan komitmen organisasi merupakan sifat hubungan antara individu dengan organisasi atau PTS yang di dalamnya individu mempunyai keyakinan diri terhadap nilai-nilai dan tujuan organisasi, rela untuk menggunakan usahanya secara sungguh-sung-guh demi kepentingan organisasi, serta mem-punyai keinginan yang kuat untuk tetap menjadi bagian dari organisasi. Dalam hal ini dosen mengidentifikasikan dirinya pada suatu PTS tertentu tempat mereka bekerja dan turut merealisasikan tujuan-tujuan organisasi tersebut.
Komitmen organisasi, menurut Kotler (2000), adalah sifat hubungan seorang individu dengan organisasi yang memungkinkan dia, dengan komitmen yang tinggi, memperlihatkan keinginan kuat untuk menjadi anggota organisasi tersebut, bersedia untuk berusaha sebaik mung-kin, dan menerima nilai-nilai dan tujuan orga-nisasi. Pengertian tersebut mengungkapkan dua jenis komitmen. Pertama, komitmen terhadap sasaran organisasi atau ke mana organisasi itu diarahkan. Jika komitmen ini tinggi, organisasi akan mempertahankan keanggotaannya. Kedua, komitmen pada nilai-nilai, norma dan budaya organisasi yang memberikan batasan tentang
yang boleh atau tidak boleh dilakukan. Komitmen ini akan memperlihatkan keyakinan organisasi yang teguh kepada para anggotanya, dan sebaliknya para anggota akan memperlihatkan komitmen teguh pada organisasi tempat bekerja.
Komitmen yang kuat dan terpusat ter-hadap tugas-tugas yang dihadapi, merupakan ciri individu yang mempunyai kinerja. Salah satu ciri tersebut adalah “a high level of task com-mitment or motivation to achieve in certain are-as” (Woolfolk, 1995, h. 123). Komitmen seseorang terhadap tugas diartikan sesuai dengan konsep di atas adalah suatu dorongan khusus untuk mencapai tujuan. Hal ini mengindikasikan bahwa keberhasilan kerja tidak hanya tergantung pada faktor intelektual saja, tetapi juga komitmen, yaitu dorongan untuk me-nyelesaikan tugas secara teratur dan berdisiplin. Dengan demikian faktor ini berhubungan dengan tanggung jawab dan disiplin pribadi un-tuk mengerjakan sesuatu yang telah menjadi komitmennya. Karena adanya komitmen ter-hadap tugas, maka dosen mau bekerja lebih tekun dan berdisiplin untuk meraih hasil yang bermutu. Perbedaan antara orang yang sukses dengan yang tidak sukses ditentukan oleh komitmen memecahkan masalah. Treffinger (1980: h. 34) menegaskan, “Curiosity, imagina-tion, productivity, independence in thought and judgment, extensive fund of information and ideas, persistence, commitment to solving prob-lems, concern with the future and the unknown, not merely with the past, the present, or the known”.
Paparan di atas memperlihatkan bahwa budaya organisasi, komitmen, dan kinerja dosen saling berhubungan dan saling mempengaruhi. Kesesuaian budaya kerja yang dimiliki dengan yang diharapkan akan memberikan kepuasan hasil kerja. Kepuasan terhadap pekerjaan tentu akan menimbulkan semangat untuk berbuat yang lebih baik. Sikap dan komitmen terhadap pekerjaan merupakan tendensi yang tetap tentang perasaan dan perilaku terhadap suatu objek atau pekerjaan tersebut (Spector, 2006, h. 381). Dengan demikian dapat disimpulkan bahwa para dosen yang menunjukkan sikap positif terhadap tugasnya akan melaksanakan pekerjaan dengan lebih baik. McClelland (1987) berpendapat “ada hubungan yang positif antara komitmen berprestasi dengan pencapaian prestasi kerja”. Sementara itu menurut Long (2000, h. 219), komitmen merupakan ikrar atau ikatan terhadap sesuatu tindakan. Dengan kata lain komitmen sebagai dorongan internal akan
Volume 7, Nomor 3, November 2014 : 133-141
136
mengarahkan suatu kemampuan untuk keberhasilan dalam meningkatkan kinerja.
Untuk memperoleh bukti-bukti empiris dari fenomena di atas, perlu diadakan penelitian sejauh mana budaya organissai dan komitmen berpengaruh terhadap kinerja dosen. Tujuan penelitian ini adalah untuk mengkaji pengaruh antara dua jenis variabel, yaitu: variabel penyebab (eksogen), dan variabel akibat (endogen variable). Variabel penyebab men-cakup faktor budaya organisasi dan komitmen dosen, sedangkan variabel akibat adalah kinerja dosen.
METODE
Metode yang digunakan dalam penelitian ini adalah survei dengan bentuk penelitian analisis jalur (Path Analysis). Penelitian dilakukan melalui survei, karena tujuan penelitian adalah untuk mengungkap keadaan nyata tentang hal-hal yang dialami sampel penelitian, yakni seberapa besar pengaruh budaya organisasi dan komitmen terhadap kinerja. Bentuk penelitian analisis jalur digunakan dengan bertujuan untuk mengetahui sejauh mana variasi-variasi pada satu faktor berkaitan dengan variasi pada satu atau lebih faktor lain, serta pengaruh langsung di antara variabel berdasarkan koefisien jalur.
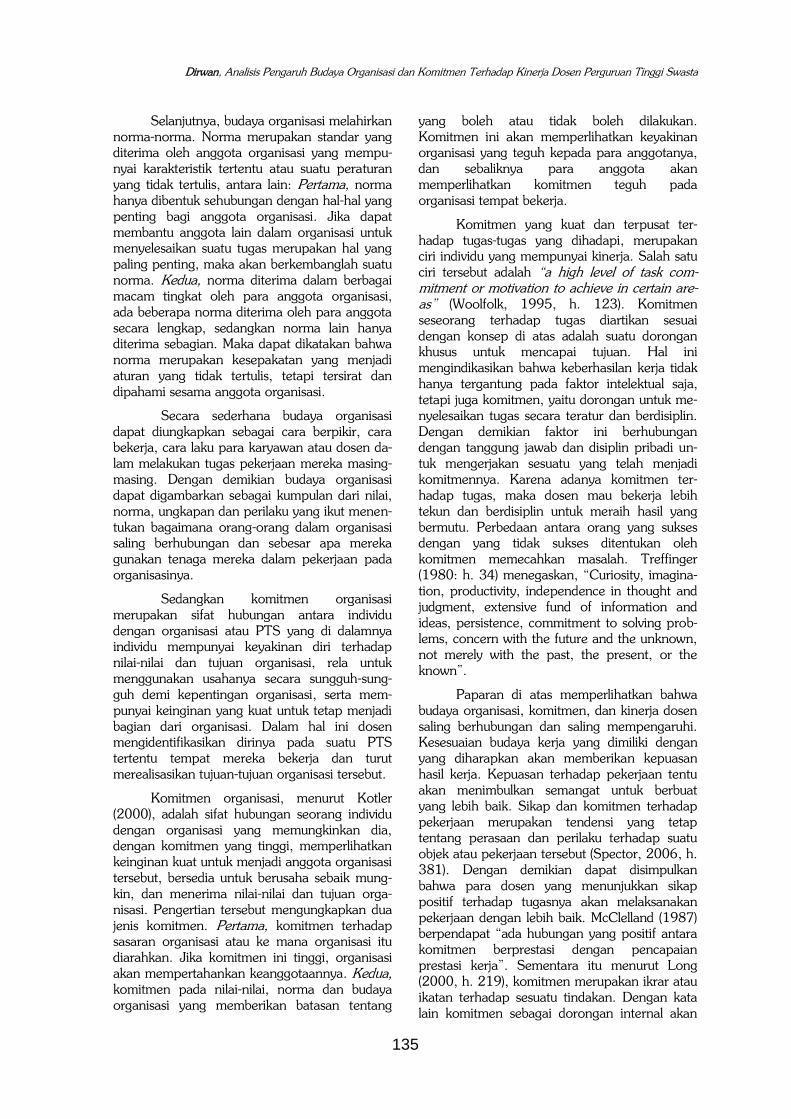
Untuk kepentingan penelitian dalam menghitung pengaruh antar variabel, variabel budaya organisasi disimbulkan dengan X1, komitmen dengan X2 dan kinerja dengan Y. Model konstelasi antar variabel penelitian ini digambarkan sebagai berikut.
Gambar 1. Hubungan antar variabel
Penelitian ini dilakukan di PTS Jakarta dengan sasaran penelitian dosen sebagai populasi. Karena jumlah dosen cukup besar dan terbatasnya sumber daya yang tersedia, penelitian hanya dilakukan untuk 90 orang. Dipilih sampel secara acak sederhana (simple random sampling) dari beberapa PTS, sehingga diperoleh 20 orang untuk uji coba instrumen penelitian dan 70 orang sebagai sampel penelitian.
Instrumen pengumpulan data menggunakan angket yang disusun dalam
bentuk skala sikap metode likert (Likert, 1967). Skala sikap metode likert terdiri dari per-nyataan-pernyataan (statements) yang disusun menyerupai tes objektif pilihan ganda. Jawaban yang dipilih diharapkan dapat menggambarkan seberapa tinggi perasaan (affect) dan penilaian dari responden terhadap pernyataan yang disajikan dalam skala. Angket terdiri atas 3 bagian sesuai dengan jumlah variabel penelitian. Tiap-tiap variabel terdiri atas beberapa dimensi dan indikator, sebagai acuan dalam menge-mbangkan instrumen. Dari hasil pengujian ke-handalan dan kesahihan butir-butir instrumen, di peroleh beberapa butir yang koefisien validitasnya signifikan (alpha = 0,05, r>0,444). Untuk variabel kinerja diperoleh 30 butir, dengan reliabilitas sebesar 0,844, variabel budaya organisasi diperoleh 30 butir dengan re-liabilitas sebesar 0,901, variabel komitmen di-peroleh 27 butir dengan reliabilitas sebesar 0,784.
Dalam penelitian kuantitatif ini, teknik analisis data yang digunakan untuk menjawab rumusan masalah atau hipotesis adalah analisis jalur. Analisis jalur untuk mengetahui seberapa kuat pengaruh antar variabel X1, X2 dan variabel Y, melalui perhitungan koefisien jalur. Analisis jalur digunakan juga untuk menganalisis pola hubungan kausal beberapa variabel penyebab terhadap variabel akibat. Sebelum diadakan analisis terhadap data yang diperoleh, terlebih dahulu dilakukan uji normalitas dan homogenitas data.
HASIL PENELITIAN
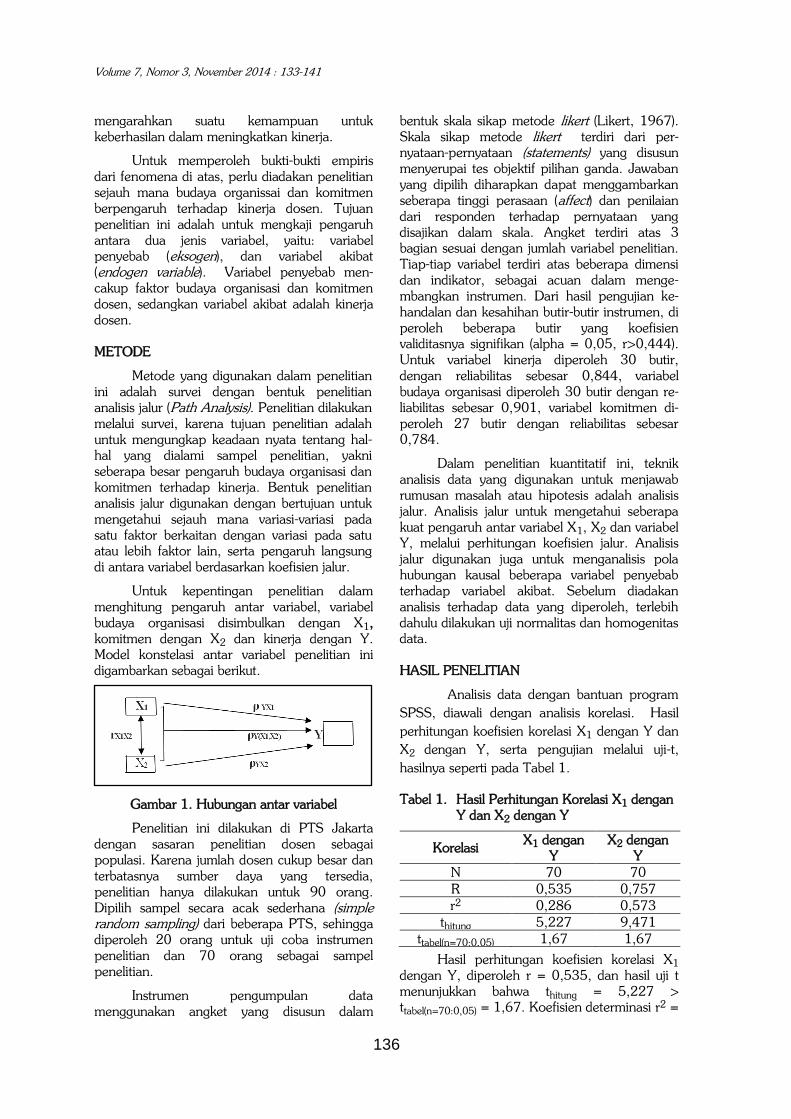
Analisis data dengan bantuan program
SPSS, diawali dengan analisis korelasi. Hasil
perhitungan koefisien korelasi X1 dengan Y dan
X2 dengan Y, serta pengujian melalui uji-t,
hasilnya seperti pada Tabel 1.
Tabel 1. Hasil Perhitungan Korelasi X1 dengan Y dan X2 dengan Y
Korelasi X1 dengan
Y X2 dengan
Y
N 70 70
R 0,535 0,757
r2 0,286 0,573
thitung 5,227 9,471
ttabel(n=70:0,05) 1,67 1,67
Hasil perhitungan koefisien korelasi X1 dengan Y, diperoleh r = 0,535, dan hasil uji t menunjukkan bahwa thitung = 5,227 > ttabel(n=70:0,05) = 1,67. Koefisien determinasi r2 =
Dirwan, Analisis Pengaruh Budaya Organisasi dan Komitmen Terhadap Kinerja Dosen Perguruan Tinggi Swasta
137
0,286, menunjukkan bahwa 28,6 % variasi yang terjadi dalam tinggi rendahnya kinerja di sum-bangkan oleh budaya organisasi, selebihnya oleh variabel lain.
Hasil perhitungan koefisien korelasi X2 dengan Y diperoleh r = 0,757, dan hasil perhitungan melalui uji t, diperoleh thitung = 9,472 > ttabel(n=70:0,05) = 1,67. Dengan koefisien korelasi di atas, diperoleh koefisien determinasi r2 = 0,573, menunjukkan bahwa 57,3 % variasi yang terjadi dalam meningkatnya kinerja disumbangkan oleh variabel komitmen, selebihnya oleh variabel lain.
Tabel 2. Hasil Perhitungan Korelasi Ganda
Korelasi X1 dan X2 dengan Y
N 70
R 0,692
r2 0,479
Fhitung 19,476
Ftabel(2/67:0,05 3,14
Hasil pengujian signifikansi hubungan an-
tara kualitas budaya organisasi dan komitmen terhadap kinerja, digambarkan dalam Tabel 2. Perhitungan koefisien korelasi ganda, diperoleh R = 0,692. Hasil perhitungan Fhitung = 19,476 lebih besar dari Ftabel(2/67:0,05) = 3,14, menunjukkan terdapat hubungan positif yang signifikan. Dari koefisien determinasi r2 = 0,479, menunjukkan bahwa 47,9 % variasi yang terjadi dalam tinggi rendahnya kinerja di sum-bangkan oleh budaya organisasi dan komitmen, selebihnya oleh variabel lain.
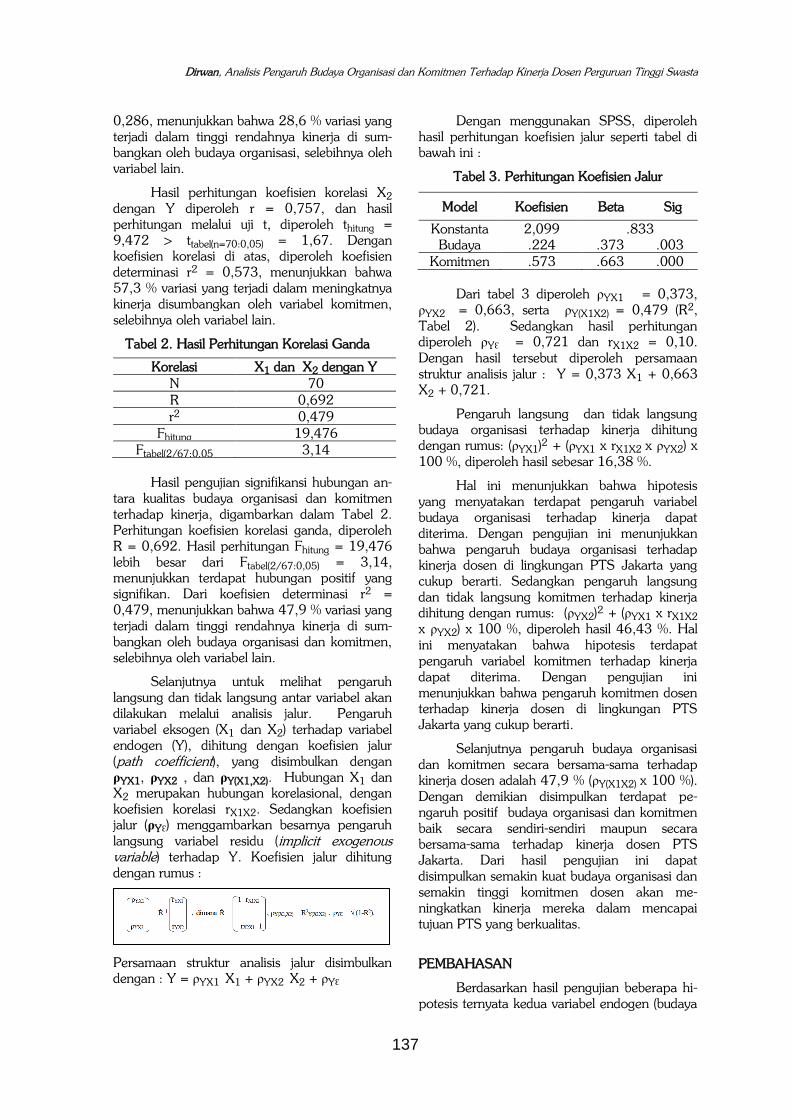
Selanjutnya untuk melihat pengaruh langsung dan tidak langsung antar variabel akan dilakukan melalui analisis jalur. Pengaruh variabel eksogen (X1 dan X2) terhadap variabel endogen (Y), dihitung dengan koefisien jalur (path coefficient), yang disimbulkan dengan ρYX1, ρYX2 , dan ρY(X1,X2). Hubungan X1 dan X2 merupakan hubungan korelasional, dengan koefisien korelasi rX1X2. Sedangkan koefisien jalur (ρYԐ) menggambarkan besarnya pengaruh langsung variabel residu (implicit exogenous variable) terhadap Y. Koefisien jalur dihitung dengan rumus :
Persamaan struktur analisis jalur disimbulkan dengan : Y = ρYX1 X1 + ρYX2 X2 + ρYԐ
Dengan menggunakan SPSS, diperoleh hasil perhitungan koefisien jalur seperti tabel di bawah ini :
Tabel 3. Perhitungan Koefisien Jalur
Model Koefisien Beta Sig
Konstanta Budaya
2,099 .224
.833 .373 .003
Komitmen .573 .663 .000
Dari tabel 3 diperoleh ρYX1 = 0,373,
ρYX2 = 0,663, serta ρY(X1X2) = 0,479 (R2, Tabel 2). Sedangkan hasil perhitungan diperoleh ρYԐ = 0,721 dan rX1X2 = 0,10. Dengan hasil tersebut diperoleh persamaan struktur analisis jalur : Y = 0,373 X1 + 0,663 X2 + 0,721.
Pengaruh langsung dan tidak langsung budaya organisasi terhadap kinerja dihitung dengan rumus: (ρYX1)2 + (ρYX1 x rX1X2 x ρYX2) x 100 %, diperoleh hasil sebesar 16,38 %.
Hal ini menunjukkan bahwa hipotesis yang menyatakan terdapat pengaruh variabel budaya organisasi terhadap kinerja dapat diterima. Dengan pengujian ini menunjukkan bahwa pengaruh budaya organisasi terhadap kinerja dosen di lingkungan PTS Jakarta yang cukup berarti. Sedangkan pengaruh langsung dan tidak langsung komitmen terhadap kinerja dihitung dengan rumus: (ρYX2)2 + (ρYX1 x rX1X2
x ρYX2) x 100 %, diperoleh hasil 46,43 %. Hal ini menyatakan bahwa hipotesis terdapat pengaruh variabel komitmen terhadap kinerja dapat diterima. Dengan pengujian ini menunjukkan bahwa pengaruh komitmen dosen terhadap kinerja dosen di lingkungan PTS Jakarta yang cukup berarti.
Selanjutnya pengaruh budaya organisasi dan komitmen secara bersama-sama terhadap kinerja dosen adalah 47,9 % (ρY(X1X2) x 100 %). Dengan demikian disimpulkan terdapat pe-ngaruh positif budaya organisasi dan komitmen baik secara sendiri-sendiri maupun secara bersama-sama terhadap kinerja dosen PTS Jakarta. Dari hasil pengujian ini dapat disimpulkan semakin kuat budaya organisasi dan semakin tinggi komitmen dosen akan me-ningkatkan kinerja mereka dalam mencapai tujuan PTS yang berkualitas.
PEMBAHASAN
Berdasarkan hasil pengujian beberapa hi-potesis ternyata kedua variabel endogen (budaya
Volume 7, Nomor 3, November 2014 : 133-141
138
organisasi dan komitmen dosen) memiliki hu-bungan dan pengaruh yang signifikan terhadap variabel eksogen (kinerja). Dari hasil pengujian pertama, menggambarkan bahwa terdapat pe-ngaruh langsung yang signifikan antara budaya organisasi dengan kinerja. Temuan ini sejalan dengan pendapat Triguno (1977), bahwa warna budaya kerja adalah produktivitas berupa peri-laku kerja yang dapat diukur, seperti kerja keras, disiplin, produktif, tanggung jawab, bermotivasi, kreatif, inovatif, responsif dan mandiri. Hal ini berarti budaya kerja merupakan dasar yang akan menghasilkan kualitas proses kerja. Oleh karena itu apabila dosen ingin menghasilkan kerja ber-kualitas, harus dengan budaya kerja yang kuat disertai proses kerja yang benar. Hasil penelitian sesuai juga dengan pendapat Kreitner dan Kinicki (2007), yang menyatakan budaya kerja sebagai perekat organisasi yang mengikat anggota organisasi melalui nilai-nilai yang ditaati, peralatan, simbul dan cita-cita sosial yang ingin dicapai. Hal ini sesuai juga dengan pendapat Mondy (1993), bahwa budaya kerja sebagai sistem nilai, keyakinan dan kebiasaan meng-hasilkan norma. Norma berbentuk kebiasaan kerja berbasis nilai, aturan organisasi termasuk standar kerja organisasi. Kondisi ini akan me-mbentuk kinerja berkualitas sesuai harapan organisasi. Penelitian lain yang selaras dengan temuan penelitian ini, yang dinyatakan oleh Robbins (1996), bahwa budaya organisasi dapat meningkat komitmen dan memiliki hubungan positif dengan kinerja seseorang.
Kualitas dosen yang baik akan menjadi pendorong bagi kegairahan dan efisiensi bekerja dan pada gilirannya mendorong produktivitas kerja. Hubungan yang kurang serasi antara dosen, staf, dan mahasiswa, prosedur dan tata kerja yang tidak jelas menyebabkan kinerja yang buruk (Hadiana, 1996, h. 50). Kualitas PTS antara lain dilihat dari sejumlah keistimewaan output, yang memenuhi keinginan masyarakat, serta memberikan kepuasan mereka dalam penggunaan output tersebut. Hal ini sesuai dengan pendapat Lovelock (1988, h. 229), kualitas adalah “Quality is degree of excellent in-tended, and the control of variability in achieving that excellent, in meeting the customer’s re-quirements”. Kualitas merupakan tingkat mutu yang diharapkan, dan dapat dikendalikan keragamannya dalam mencapai mutu untuk memenuhi kebutuhan pengguna. Untuk dapat memberikan kualitas yang baik, perlu dibina hubungan yang erat antara pengelola PTS dan dosen.
Meskipun makna konsep kualitas per-guruan tinggi sudah dibicarakan di atas, isu ter-sebut tetap masih diperdebatkan oleh ber-bagai kalangan tanpa kesimpulan yang lugas. Kese-pakatan tentang arti kualitas pelayanan PTS se-bagian besar adalah hasil dari posisi normatif yang dimiliki oleh PTS itu sendiri. Hal ini sesuai dengan pendapat Robbins (1996), bahwa teori organisasi tidak hanya memperhatikan prestasi dan sikap para anggota, tetapi juga kemampuan organisasi secara keseluruhan untuk menye-suaikan diri dan mencapai tujuan-tujuan.
Hasil pengujian kedua menunjukkan ter-dapat pengaruh positif antara komitmen dengan kinerja dosen, atau dengan kata lain komitmen memiliki pengaruh terhadap meningkatnya kinerja dosen di PTS Jakarta yang cukup berarti. Hasil pengujian ini mengandung makna bahwa dosen yang sangat terikat dengan komitmennya dalam mencapai suatu tujuan yang telah ditetapkan, mereka mempunyai kekuatan dalam dirinya yang sekaligus meningkatkan kinerjanya. Komitmen sebagai bentuk motivasi internal telah mendorong dosen untuk tekun dan ulet mengerjakan tugasnya, meskipun mengalami bermacam-macam hambatan dan rintangan. Hal ini sesuai dengan pendapat Semiawan (1997, h. 91), yang menyatakan bahwa suatu komitmen yang dimiliki seseorang akan menyebabkan mereka bekerja sungguh-sungguh dan tekun agar memperoleh hasil yang baik. Komitmen sebagai persetujuan diri untuk mencapai sesuatu, telah menjadi kekuatan pendorong yang timbul dari dalam maupun dari luar diri pribadi dosen. Hal ini sesuai dengan pendapat Humphrey (2000, h. 3), bahwa komitmen adalah persetuju-an untuk menyelesaikan suatu tugas. Adanya kegiatan atau aktivitas yang terarah pada usaha pencapaian tujuan yang pada akhirnya akan merupakan komitmen pada diri dosen. Komit-men telah menggerakkan (mengaktifkan) potensi yang ada pada diri mereka, sebagai suatu per-syaratan yang harus dipenuhi untuk dapat digo-longkan sebagai seseorang yang mempunyai kinerja yang baik. Komitmen dosen telah dapat melibatkan diri mereka kedalam apa yang dik-erjakan dengan keyakinan bahwa kegiatan yang dikerjakan penting dan berarti. Komitmen ter-hadap tugas terjadi karena ada keyakinan yang kuat dari dosen untuk menyelesaikannya dan tu-gas tersebut dianggap penting untuk meningkatkan kinerja. Di samping itu komitmen telah dianggap sebagai penyusunan energi khu-sus yang terpusat pada usaha bekerja dan me-nyelesaikan tugas dengan baik serta dorong-an untuk berkarya. Dengan demikian semua per-
Dirwan, Analisis Pengaruh Budaya Organisasi dan Komitmen Terhadap Kinerja Dosen Perguruan Tinggi Swasta
139
ilaku termotivasi untuk mereduksi rangsangan yang menimbulkan eksitasi (excitation) pada sis-tem. Kecenderungan melibatkan diri sebagai rangsangan apabila ditinjau dari asal atau sum-ber untuk bertindak, dapat datang dari dalam diri seseorang berupa, sikap, pengalaman, pendidi-kan, harapan, cita-cita yang ingin diraih. Rang-sangan tersebut dapat juga berasal dari faktor lu-ar diri orang lain, misalnya karena pengaruh pimpinan, teman dan faktor lainnya.
Secara umum orang mempunyai tujuan untuk berhasil, akan mengejar prestasi dan im-balan keberhasilan. Mereka mempunyai has-rat untuk melakukan sesuatu secara lebih baik atau lebih efisien daripada yang dilakukan sebe-lumnya. Dari penelitian ini tentang kebu-tuhan hasil yang baik, ditemukan bahwa yang berkinerja tinggi membedakan diri mereka dengan orang-orang lain, berkat kehendak mereka untuk melakukan segala sesuatu dengan cara lebih baik. Meskipun dilakukan dengan penelitian yang sederhana ini terhadap kebu-tuhan, ternyata terdapat temuan-temuan yang konsisten. Pertama, dosen dengan kebutuhan kenerja yang tinggi lebih menyukai situasi kerja dengan tanggung jawab pribadi, umpan balik, dan tingkat resiko yang sedang. Apabila ciri-ciri ini menonjol, dosen yang tinggi kebutuhan kinerjanya akan mempunyai komitmen yang kuat. Kedua, suatu kebutuhan yang tinggi untuk berkarya tidaklah dengan sendirinya menuntun ke arah menjadi mempunyai kinerja yang tinggi. Karena untuk mempunyai kinerja yang tinggi memerlukan suatu persetujuan diri yang menjadi kekuatan untuk membentuk rangsangan-rangsangan, kemudian baru membentuk suatu reaksi dalam bentuk komitmen untuk berbuat. Komitmen menurut penelitian ini, menunjuk pa-da permasalahan keterlibatan dan loyalitas, sesuai dengan pendapat Mondy (1993), bahwa “commitment is viewed as an attitude of attach-ment to the organization, which leads to particu-lar job - related behaviors”. Komitmen dipan-dang sebagai suatu sikap keterikatan kepada or-ganisasi, yang berperan penting pada pekerjaan tertentu dan perilaku yang terkait. Sebagai con-toh, dosen yang memiliki komitmen tinggi, akan selalu meningkatkan prestasi, dan lebih kecil kemungkinannya untuk meninggalkan organ-isasi, dibandingkan dengan dosen yang memiliki komitmen rendah. Dengan demikian konsep tersebut telah sesuai dengan temuan penelitian bahwa komitmen merupakan keingin-an yang kuat untuk tetap sebagai anggota organisasi dan berusaha keras sesuai kebutuhan organisasi, serta menerima nilai dan tujuan organisasi.
Keyakinan diri dosen merupakan faktor pendorong bagi dirinya dalam berkarya. Keyakinan diri yang dimaksud disini adalah keyakinan dosen bahwa apa yang menjadi tujuan PTS merupakan tujuan dari pribadinya, serta dosen merasa mampu dan yakin atas kemampuan yang dimiliki untuk menyelesaikan tugas dengan prestasi yang gemilang. Keyakinan diri, konstribusinya cukup besar dalam me-ndorong dosen untuk berkarya, karena mereka yang tidak mempunyai keyakinan, kemauan kinerja yang tinggi akan hilang kemauannya. Di samping itu rasa tanggung jawab sebagai seorang dosen terhadap tugas dan kewajiban, akan meningkatkan usaha untuk berkarya. Rasa tanggung jawab dalam melaksanakan tugas akan merupakan hal yang sangat penting, karena dengan rasa tanggung jawab yang tinggi dosen akan selalu berusaha menjaga citra diri dan PTS-nya, yang diungkapkan melalui prestasi terbaik sebatas kemampuan maksimalnya. Hasil peker-jaan yang baik akan secara otomatis memberik-an rasa puas pada diri dosen itu sendiri.
Pengujian terakhir terdapat pengaruh positif antara budaya organisasi dan komitmen secara bersama-sama dengan kinerja. Penemuan ini sejalan dengan pandangan bahwa kinerja seseorang akan terbentuk oleh faktor dalam dirinya antara lain komitmennya dan budaya organisasi yang dianutnya. Kinerja dosen PTS Jakarta menurut hasil penelitian ini, 47,9 % dipengaruhi oleh budaya organisasi dan komit-men mereka melaksanakan tugas. Kinerja yang optimal untuk menyelesaikan suatu tugas yang sulit dan dorongan dalam mengatasi rintangan dan memelihara kualitas kerja yang tinggi, serta bersaing melalui usaha yang gigih telah mendapatkan hasil yang lebih baik dari sebelumnya. Hasil ini telah sejalan dengan pendapat Apruebo (2005, h. 53) yang menyatakan “Achievement motivation as a desire for significant accomplishment for mastery of things, people, or ideas for attaining a higher standard”. Dengan demikian komitmen untuk berkarya yang tinggi, merupakan keinginan, hasrat, kemauan, dan dorongan untuk dapat unggul dalam menyelesaikan tugas. Kinerja yang didukung fasilitas PTS yang cukup dan komitmen dosen yang tinggi akan mendorong mereka untuk berpacu dengan keunggulan, baik keunggulan diri sendiri, maupun keunggulan dari orang lain. Penelitian ini menunjukkan para dosen yang berhasil memperoleh hasil yang baik, ternyata selain cerdas terbukti memiliki kinerja yang lebih. Kinerja yang dimiliki merupakan modal bagi
Volume 7, Nomor 3, November 2014 : 133-141
140
dosen untuk sukses, karena kinerja seseorang secara khusus dipengaruhi oleh motivasi yang muncul untuk menyelesaikan tugasnya.
Hasil penelitian ini telah sesuai dengan temuan Wang (2007), bahwa budaya organisasi yang kuat dan komitmen anggota organisasi yang tinggi, akan meningkatkan loyalitas, tetap berada di organisasi dan mempunyai rasa memiliki organisasi tersebut. Dosen yang me-nunjukkan kemampuan unggul dibidang intelek-tual telah memiliki dorongan kuat untuk men-capai hasil yang sempurna. Disamping kemauan menetapkan sasaran secara realistik dan di atas rata-rata, dosen berprestasi telah menunjukkan kemampuan belajar secara beren-cana dan berdisiplin serta mempunyai ketang-guhan mengatasi rintangan. Hal ini sejalan dengan pendapat Robbins (1996, h. 535), bahwa orang-orang yang mempunyai dorongan untuk berhasil, mereka mengejar prestasi pribadi, bukan penghargaan-penghargaan dan imbalan.
Sumber daya manusia merupakan salah satu unsur dinamis suatu bangsa yang mempunyai makna ganda, yaitu sumber kekuatan sekaligus juga sumber kerawanan. Sumber daya manusia Indonesia, akan dapat menjadi sumber kekuatan bangsa, apabila kita mampu menyiapkan sedini mungkin sebagai manusia berprestasi. Oleh sebab itu tantangan yang paling mendasar bagi bangsa Indonesia ke depan adalah bagaimana membina sumber daya manusia Indonesia yang bermutu tinggi, agar mampu menjadi pelaku utama pembangunan nasional. Sasaran umum yang ingin dicapai melalui pembangunan nasional adalah tercipta-nya kualitas manusia dan kualitas masyarakat Indonesia yang maju mandiri. Dengan kualitas PTS yang baik dan komitmen dosen yang tinggi dalam menuntut ilmu, didukung budaya yang kuat, akan memberi konstribusi dalam membentuk karakter dosen yang bermutu tinggi. Dengan terbiasa mempelajari ilmu secara bertahap, serta selalu bekerja menurut aturan dan metode, diharapkan dosen akan membiasa-kan diri untuk bekerja secara sistematis, benar, dan memperkecil spekulasi. Sehingga ada jalan dan rumus yang harus dipakai untuk sampai kepada sebuah solusi, baik masalah pribadi setiap dosen maupun masalah bangsa pada umumnya.
KESIMPULAN DAN SARAN
Berdasarkan analisis data yang telah di-kemukakan pada bagian terdahulu, maka di-dapat beberapa kesimpulan penelitian. Pertama,
terdapat pengaruh dan hubungan yang signifi-kan antara budaya organisasi terhadap kinerja dosen. Kedua, terdapat pengaruh dan hubung-an yang signifikan antara komitmen yang di-miliki terhadap kinerja dosen. Ketiga, terdapat pengaruh dan hubungan yang signifikan antara budaya organisasi dan komitmen secara ber-sama-sama terhadap kinerja dosen PTS di Jakarta. Dengan demikian dapat dinyatakan bahwa, kinerja dosen yang tinggi untuk menda-patkan output PTS yang berkualitas, dipengaruhi langsung secara positif oleh budaya organisasi yang kuat dan komitmen dosen yang tinggi.
Beberapa implikasi dari hasil penelitian ini, sesuai dengan konsep pengaruh budaya organisasi dan komitmen, dalam upaya mening-katkan kinerja dosen, adalah sebagai berikut: Pertama, dengan peningkatan komitmen akan menimbulkan dorongan seseorang untuk ber-prestasi secara optimal, sehingga kualitas output PTS yang berkualitas dapat dicapai. Kedua, meningkatkan rasa tanggung jawab terhadap ke-berhasilan, karena dengan rasa tanggung jawab yang tinggi, seseorang akan selalu berusaha me-ningkatkan kinerjanya. Untuk meningkatkan ra-sa tanggung jawab terhadap keberhasilan, perlu ditanamkan komitmen dan keterikatan terhadap keberhasilan.
Sebagai bagian akhir dari tulisan ini akan disampaikan beberapa saran: Pertama; diharap-kan dosen berupaya untuk mempunyai kom-petensi yang tinggi dengan menghasilkan karya-karya ilmiah dalam rangka memperkuat ka-pasitas dan daya saing menghadapi Masyarakat Ekonomi ASEAN 2015. Kedua; pemerintah meningkatkan stimulus, agar dosen lebih berminat menambah pengetahuan dan berkarya di bidang penelitian dan pengabdian kepada masyarakat, terutama dosen PTS.
ACUAN PUSTAKA
Apruebo, A.R. (2005). Sport psychology. Manila: Publishing House.
As’ad, M. (1980). Psikologi industri. Bandung: Bina Aksara.
Casio, W. (2003). Managing human resources prodictivity, quality of work life, profits. New Jersey: McGraw-Hill, Inc.
Hadiana. (1996). Bisnis dan manajemen. Jakarta: Arcan.
Gomes, F.C. (2006). Manajemen sumber daya manusia. Yogyakarta: Ando Offset.

Dirwan, Analisis Pengaruh Budaya Organisasi dan Komitmen Terhadap Kinerja Dosen Perguruan Tinggi Swasta
141
Humphrey, S.E. (2007). “Integrating Motivational, Social, and Contextual Work Design Features: A Meta-Analytic Summary and Theoretical Extension of the Work Design Literature”. Journal of Applied Psychology 92, no. 5, hlm.1332-1356.
Kotler P. (2000). Marketing management: analysis, planning, implementation and control. Prentice-Hall. Inc.
Kreitner, R. & Kenicki, A. (2007). Organizational behavior. McGraw-Hill International.
Likert, R. (1967). The human Organization: Its management and value. New
York: McGraw-Hill Book Company.
Long, M.L.(2000). Consumption Values and Relationship: Sigmenting The Market for Frequensy Programs. Journal of Consumer Marketing,Vol. 17, (3).
Lovelock, C. & Wright Lauren.(1999). Principles service marketing and management. New Jersey: Pearson Education.
McClelland, D.C. (1987). Human motivation. New York: Press Syndicate of the University of Cambridge
Mondy, R.W. & Noe, R.M. (1993). Human resource management. Massachusetts:
Allyn & Bacon.
Robbins, S.P. & Mary Coulter. (1996). Management. New Jersey: Prentice Hall, Inc.
Santosa, B., Dari “Brain Drain” ke “Brain Gain”, Kompas 2-5-2014,(6).
Semiawan, C. (1997). Perspektif pendidikan anak berbakat. Jakarta: PT. Gramedia Widiasarana.
Spector, P.E. (2006). Industrial and organizational psychology. New York: John
Wiley.
Suyata. (1996). Budaya Kualitas Kerja dan Penerapannya di Lembaga Pendidikan.
Jurnal Dinamika Pendidikan, 2 (VIII).
Treffinger D.J. (1980). Encouraging Creative Learning for the Gifted and Talented. Ventura California: Ventura County Superintendent of Schools Office.
Trigono, (1997). Budaya Kerja. Jakarta: PT. Golden Terayon Press.
Wang, H.K.C. (2007). Study on Organizational Commitment and Attitude toward
Organizational Reform Comprehensive High Schools as Example. The Journal of Human Resource and Adul Learning, 3(2), hlm. 189-198.
Woolfolk, A. E. (1995). Educational Psychology. Boston: Allyn & Bacon.
Zamroni. (2003). Paradigma Pendidikan Masa Depan. Yogyakarta: Bigraf Publishing.

143
STUDENTS’ PERCEPTION OF BLENDED LEARNING ENVIRONMENT IN CALL COURSE: ADVANTAGES, LIMITATIONS, AND SUGGESTIONS FOR
IMPROVEMENT
Kristasia Rombe [email protected]
Christian University of Indonesia
ABSTRACT
This study aims to investigate the perception of the students English Teaching Study Program (ETSP), Christian University of Indonesia. The participants were 64 students who participated in CALL course conducted in the odd semester of 2013/2014 aca-demic year. The quantitative data were collected using questionnaire and analyzed by using Microsoft Excel 2010. The qualitative data were collected using interview and an-alyzed descriptively. The findings revealed that the students responded positively to the use of BL to improve their vocabulary and grammar mostly through writing activities. The students also perceived by using BL, their computer skill and interest were devel-oped. Regarding the advantages, connectivity was indicated as a major problem fol-lowed by social isolation. As a result of the problems addressed, increasing the number of computer labs and training were suggested by the majority of students. Based on the findings, it is recommended to ETSP to continue with BL by increasing the number of computer labs and training for students.
Keywords: BL, CALL, course, perception.
ABSTRAK
Penelitian ini bertujuan untuk mengetahui persepsi mahasiswa program studi Pendidi-kan Bahasa Inggris (PBI), FKIP UKI, terhadap penerapan pembelajaran Blended Learn-ing (BL) pada matakuliah Computer Assisted Langauage Learning (CALL). Responden berjumlah 64 mahasiswa yang mengambil matakuliah CALL pada semester gasal tahun akademik 3013/2014. Data kuantatif diperoleh dengan menggunakan angket dan di-analisis dengan menggunakan Ms. Excel 2010, sedangkan data kualitatif yang dianalisis secara deskriptif diperoleh melalui wawancara. Hasil penelitian menunjukkan bahwa mahasiswa merespon positif terhadap penggunaan BL untuk meningkatkan pen-guasaan kosakata dan tatabahasa khususnya melalui aktivitas menulis. Mahasiswa juga mengungkapkan bahwa dengan penerapan BL meningkatkan keterampilan menggunakan komputer mereka. Masalah utama yang dihadapi mahasiswa berhu-bungan dengan koneksi internet. Oleh karena itu mahasiswa menyarankan penamba-han jumlah laboratorium komputer yang terkoneksi baik dengan internet dan pelatihan keterampilan menggunakan internet. Berdasarkan temuan yang diperoleh direko-mendasikan agar PBI melanjutkan penerapan BL, menambah jumlah laboratorium komputer dan pelatihan untuk mahasiswa.
Kata kunci: BL, CALL, kuliah, persepsi
INTRODUCTION
Along with the progress of information technology (IT), the tremendous educational changes has been brought all over the world. The use of technology in teaching and learning extends beyond the classroom and consists of material and communication over the internet access directly from the learners’ PCs (personal computers). This phenomenon has experienced an obvious growth in recent years based on the
responses not only from teachers but also from learners and academia.
The explanation above indivate it is ob-vious that to answer the demand of IT and glob-alization era should be made the first priority. Literature on technology use as a tool in lan-guage learnings assert significant role in lan-guage learning. Pardede (2012) emphasized that innovations in ICT are expanding the range of possible solutions that can improve teaching and learning inputs, processes, and outcomes. He
Volume 7, Nomor 3, November 2014 : 143-148
144
added that through the internet access, ICT now offers abundant devices for developing and de-livering audio-visual products, multimedia presentations, visual materials and end-user software which could be easily applied to create new learning and teaching practices. Those tools have made it possible to prepare a varied learn-ing environment which will address to students’ individual differences. Multimedia and network technology has made it possible for students to learn information anytime and anywhere. Since the on-line data are rich, flexible, and easy to be accepted by the learners, network provides stu-dents with an open, realistic language environ-ment (Shen, 2004). Riley (2000) stressed that teaching and learning that use technology effec-tively can lead to greater academic achievement and make a real difference.
Research evidences, particularly those conducted in the use of synchronous (live train-ing online-realtime) learning activities support the effectiveness of technology use in improving learning experience (Burrus, 2009). One of the studies has been to investigate the learning strat-egies that implement online along with the ad-vantages of face-to-face instruction, from which the concept of Blended Learning (BL) has emerged. Blended learning in EFL setting can be defined as pedagogical approach that combines the effectiveness and socialization opportunities in the classroom with the technologically en-hanced active learning possibilities of online en-vironment (Dziuban et al., 2004). It was found that the combination of face-to-face classroom instruction, online monitoring, and the use of ICT have shown a substantial improvement in students’ language skills, as well as high satisfac-tion levels with the program (Bañados, 2006). Bijeikienė, Rašinskienė, Zutkiene’s (2011) re-
search revealed that English language teachers display a generally positive attitude towards blended learning. The teachers to a large extent agree about the efficiency of the blended learn-ing courses in terms of the resources contained there, such as video lectures, theory presenta-tions, interactive exercises for self-check and others.
Computer-assisted language learning (CALL) was designed to introduce new types of input that lead to a richer language environ-ment. Lee (2000) found that CALL can (1) pro-vide students with experiential learning practice; (2) motivates students to learn; (3) potentially in-crease students’ academic achievement; (4) in-crease available authentic materials; (5) encour-age interaction between instructor and students
and students and peers; (6) place emphasis on individual goal; (7) allows students to use multiple sources for information ; and (8) create a sense of global understanding (as cited in Burrus, 2009, pp. 10-11).
One of the most effective the Internet tools EFL teachers can utilize to develop their students’ writing skills is blogs. Several studies (e.g. Sun, 2009 and Lee, 2010) reported that integrating digital technologies, namely blogs, in the classroom to develop writing skills foster a sense of collaboration and community, develop a sense of voice and foster critical and analytical skills. The results of Arani’s (2005) study on the use of blogs to develop writing, reading and communication skills in English for Specific Pur-poses among non-native speakers of English at Kashan University of Medical Sciences in Iran revealed that students preferred to write on the weblog than the traditional ways, and weblogs can improve English in the context of ESP. These findings are in line with Pardede’s (2011) study on student teachers’ interest and percep-tion on the use of BALL (Blog Assisted Lan-guage Learning) as an additional component in writing skills development in Christian University of Indonesia. The study revealed that a majority of the respondents basically viewed the use of BALL to develop writing interesting and effec-tive. More than a half of them admitted they wrote more productively after joining BALL. The internet facilities (authentic articles and writ-ing manuals) they could easily access while writ-ing in the blog were very helpful to produce good writing. They also used fellow students’ works as a ‘mirror’ to prevent errors. The great-est motivating factor for the respondents in writ-ing in the blog is their realization that their works were visible to many people in the world. This awareness motivated them to check word choice and spelling more carefully.
The use of many educational tools makes CALL obviously has advantages and limi-tations found by researchers. Studies and re-search findings have shown the use of CALL has brought positive effect on the achievement level of ESL students. At the same time, CALL, how-ever, has limitations and disadvantages, such as financial aspect, participant isolation, and tech-nology knowledge requirements (Burrus, 2009).
Realizing the advantages of BL envi-ronment in language learning, the researcher in this current study would like to investigate the perception of the students. Specifically, the study addressed the following research ques-

Rombe, Students’ Perception of Blended Learning Environment in CALL Course: Advantages, Limitations, and Suggestions for Improvement
145
tions: (1) What is students’ perception toward BL use in improving English language skills and components? (2) What is students’ perception regarding the advantages using BL? (3) What is students’ perception regarding the limitations us-ing BL? (4) Do students suggest to improve blended courses?. Realization of these percep-tions may help teachers modify their teaching methods and techniques to help their students improve their English learning process and re-duce the limitations.
METHODOLOGY
This study is a survey research which was conducted on May 2014 in Christian Uni-versity of Indonesia, Cawang, Jakarta. The par-ticipants were 64 students who participated in CALL course conducted in the odd semester of 2013/2014 academic year consist of sixth and eighth semesters. The quantitative data was col-lected using questionnaire and analyzed using Microsoft Excel 2010. The qualitative data was collected using interview and analyzed descrip-tively.
RESULTS AND DISCUSSION
Table 1. Students’ Range of GPA
Semester GPA
2.50—2.99 3.0-3.49 3.50—4.00
VI 2 (7%) 18 (62%) 9 (31%)
VIII 1 (3%) 28 (80%) 6 (17%)
Due to administrative and budget con-
straints, only 64 students could be included to collect the data. As shown in Table 1, the 64 students consisted of 29 (45%) sixth semesters, and 35 (55%) eighth semesters.
Language Skills and Components Im-provement
The obtained data related students’ per-ception in improving English language skills and areas using BL revealed the majority of students perceived some improvement of their English language skills and components. More than a half of students (66% up to 92%) showed agreement on the improvement of listening skill, writing skill, grammar, and vocabulary.
In details, it seemed that 92% of the students accepted the idea that using BL has improved their vocabulary and less than a half of them (44%) “agreed” and “strongly agreed” about the idea of pronunciation improvement. This is supported by the preference of 69% and 67% of them in the idea of grammar and writing
skill improvement, whereas only 48% of them accepted the idea of speaking skill improvement.
Table 2. Students’ Perception Regarding Lan-guage Skills and Components Im-provement using Blended learning (N=64)
No Skills SD D N A SA
Mean f (%) f (%) f (%) f (%) f (%)
1 Listening 2 (3) 4 (6) 16 (25) 39 (61)
3 (5) 3.58
2 Speaking 1 (2) 9 (14) 23 (36) 31 (46)
0 (0) 3.31
3 Reading 2 (3) 3 (5) 21
(330 29 (45)
9 (14) 3.63
4 Writing 1 (2) 2 (3) 18 (28) 39 (61)
4 (6) 3.67
5 Pronunciation 1 (2) 12 (19)
23 (36) 25 (39)
3 (5) 3.27
6 Spelling 1 (2) 9 (14) 23 (36) 29 (45)
2 (3) 3.34
7 Grammar 1 (2) 4 (6) 15 (23) 33 (52)
11 (17)
3.77
8 Vocabulary 1 (2) 0 (0) 4 (6) 43 (67)
16 (25)
4.14
In details, it seemed that 92% of the
students accepted the idea that using BL has improved their vocabulary and less than a half of them (44%) “agreed” and “strongly agreed” about the idea of pronunciation improvement. This is supported by the preference of 69% and 67% of them in the idea of grammar and writing skill improvement, whereas only 48% of them accepted the idea of speaking skill improvement.
The majority of the students perceived the idea that using BL, vocabulary and grammar were improved through writing and reading ac-tivities. Findings revealed that vocabulary and grammar improvement were rated highly. It was followed by writing skill improvement; whereas, the data showed some skepticism on pronuncia-tion and speaking skill improvement by using BL.
The findings were supported by the in-terview result of 8 students consists of 3 sixth semester students and 5 eighth semester stu-dents. Interviewee 1 said that most of the activi-ties offered in this course is reading that is why she thought that she gained vocabulary a lot from the lessons and instructions. Interviewee 6 also had the same idea. However, interviewee 2 and 5 had a slightly different thought. The first one said she appreciated the webinars and gained new words indirectly by listening to the speaker who are native English speakers, while another one said she had chance to improve her

Volume 7, Nomor 3, November 2014 : 143-148
146
writing skill by indirectly improving her grammar and vocabulary.
The Advantages Using Blended Learning
The data obtained concerning students’ view about the advantages using BL were allot-ted using sixteen statements. In general, findings revealed that the majority of students agreed with the idea of BL developed their computer and internet skill, creativity and interest. Howev-er, almost a half of the students were skeptical to the effective use of time using BL.
Table 3. Students’ Perception Regarding The Advantages Using BL (N=64)
No Statements
SD D N A SA
Mean f (%)
f (%)
f (%)
f (%) f
(%)
1 More convenient 5 (8)
8 (13)
24 (38)
22 (34)
5 (17)
3.22
2 Improves interaction between students
1 (2)
10 (16)
24 (37)
22 (34)
7 (11)
3.38
3 Improves students –teacher interaction
1 (2)
9 (14)
22 (34)
27 (42)
5 (8)
3.41
4 More effective modes
0 (0)
4 (6)
15 (23)
38 (60)
7 (11)
3.75
5 interesting 0 (0)
4 (6)
10 (16)
40 (62)
10 916
)
3.88
6 useful 1 (2)
3 (5)
16 (25)
37 (57)
9 (14)
3.81
7 Self-paced learning 0 (0)
2 (3)
21 (33)
33 (52)
8 (12)
3.73
8 Develops creativity 0 (0)
1 (2)
13 (20)
37 (58)
11 (17)
3.88
9 Develops critical thinking
1 (2)
2 (3)
21 (33)
33 (52)
8 (12)
3.73
10 Develops computer skills
0 (0)
1 (2)
5 (8)
43 (67)
15 (23)
4.13
11 Develops internet skills
0 (0)
0 (0)
10 (16)
38 (59)
16 (25)
4.09
12 Broadens horizon 0 (0)
2 (3)
19 (30)
39 (61)
4 (6)
3.7
13 Increases confidence 1 (2)
12 (19)
15 (25)
28 (44)
8 (13)
3.47
14 Effective use of time 0 (0)
9 (14)
31 (45)
22 (35)
2 (3)
3.27
15 Useful feedback 1 (2)
4 (6)
27 (42)
29 (45)
3 (5)
3.45
16 Access to authentic materials
0 (0)
4 (6)
20 (31)
38 (56)
4 (6)
3.63
The finding concerning the advantages and benefits using BL indicated by the majority of them (90% and 84%) viewed BL was helpful in developing their computer and internet skill. However, less than three-fourth of them re-sponded positive toward the other included ideas of confident improvement, access to authentic materials, effective mode, and critical thinking development.
The data obtained concerning students’ view about the advantages using BL were allot-ted using sixteen statements. The idea of BL de-veloped interest and computer skill were re-sponded positively by both sixth and eighth se-mesters. Along with the learning experience,
eighth semesters showed familiarity with online learning. However, some of them still preferred face-to-face to online learning, it was represent-ed by interviewee 1.
From this course I found out that not only chatting on social network, but also studying and making teaching materials can be easily done using internet. (Inter-viewee 1).
The Limitations Using Blended Learning
The data obtained concerning students’ view about the limitations using BL were allotted using nine statements. In general, the majority of students agreed with the idea of slow internet connectivity as the major problem. The students also were able to recognize that limited comput-er access should not be the reason having diffi-culties using CALL.
Table 4. Students’ Perception Regarding The Limitations Using BL (N=64)
No Statements
SD D N A SA
Mean f (%)
f (%)
f (%)
f (%)
f (%)
1 Social isola-tion
0 (0)
11 (17)
24 (37)
26 (41)
3 (5)
3.33
2 frustration 4 (6)
16 (25)
29 (45)
14 (22)
1 (2)
2.88
3 connectivity 1 (2)
3 (5)
7 (11)
29 (45)
24 (37)
4.13
4 Technical problems
3 (5)
11 (17)
25 (39)
21 (33)
4 (6)
3.19
5 Preference for books
2 (3)
19 (30)
26 (41)
13 (20)
4(6) 2.97
6 Cheating and plagiarism
2 (3)
11 (17)
23 (36)
23 (36)
5 (8)
3.28
7 Less effective 2 (3)
19 (20)
20 (31)
17 (27)
6 (9)
3.09
8 No computer access
15 (23)
30 (47)
13 (20)
5 (8)
1 (2)
2.17
9 Online in-struction dif-ficulty
4 (6)
27 (42)
24 (38)
9 (14)
0 (0)
2.59
The finding disclosed that the only idea that clearly stated by the majority of the students on the view in using computer-assisted learning related to computer belonging. This idea was unaccepted by 70% of students. It was also showed on the demographic data that majority of both semesters have computer at home. However, the skeptical response of frustration was 45%. Another finding also disclosed on the view how technical problem students had while use computer-assisted learning. The percentage of students who were “neutral” as many as stu-dents who accepted the idea (39%).
The data revealed that the salient limita-tion was connectivity since both sixth and eighth semesters showed high response means. It was supported by the interview result. Three inter-
Rombe, Students’ Perception of Blended Learning Environment in CALL Course: Advantages, Limitations, and Suggestions for Improvement
147
viewees confessed how internet connection be-came the major problem while they were learn-ing online, especially on the webinar class that require good connectivity to access audio and video.
Due to my teaching activities, I could only use my personal modem thathas limited access. (Interviewee 2).
The next salient limitations are social isolation and technical problems. Sixth semes-ters view high response means to the idea of so-cial isolation; whereas, the eighth semesters viewed technical problem more crucial than so-cial isolation. It was supported by interviewee 1 as the eighth semester student who experienced one of technical problems.
Another limitation is no computer ac-cess. Findings revealed that students were able to recognize the idea technology cannot merely guarantee better academic achievement. It was indicated on the response means of both sixth and eighth semesters were just moderate. They seemed disagreed that having no computer ac-cess is the main reason cannot using CALL.
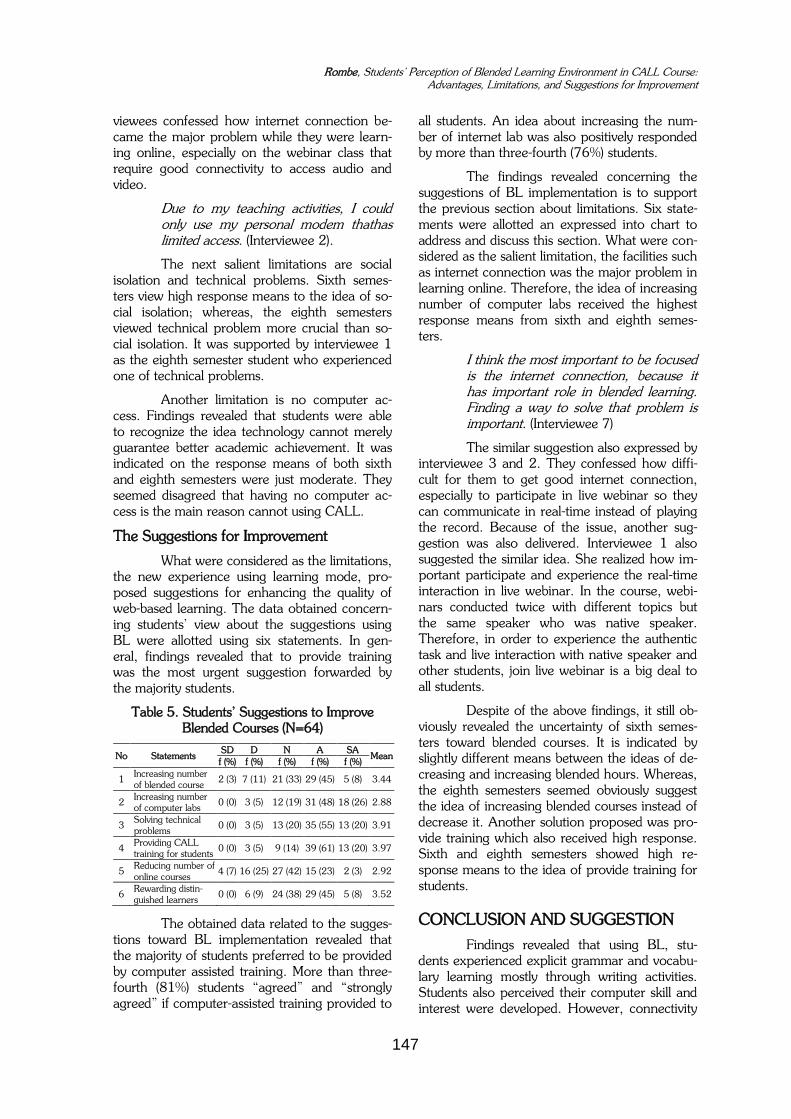
The Suggestions for Improvement
What were considered as the limitations, the new experience using learning mode, pro-posed suggestions for enhancing the quality of web-based learning. The data obtained concern-ing students’ view about the suggestions using BL were allotted using six statements. In gen-eral, findings revealed that to provide training was the most urgent suggestion forwarded by the majority students.
Table 5. Students’ Suggestions to Improve Blended Courses (N=64)
No Statements SD D N A SA
Mean f (%) f (%) f (%) f (%) f (%)
1 Increasing number of blended course
2 (3) 7 (11) 21 (33) 29 (45) 5 (8) 3.44
2 Increasing number of computer labs
0 (0) 3 (5) 12 (19) 31 (48) 18 (26) 2.88
3 Solving technical problems
0 (0) 3 (5) 13 (20) 35 (55) 13 (20) 3.91
4 Providing CALL training for students
0 (0) 3 (5) 9 (14) 39 (61) 13 (20) 3.97
5 Reducing number of online courses
4 (7) 16 (25) 27 (42) 15 (23) 2 (3) 2.92
6 Rewarding distin-guished learners
0 (0) 6 (9) 24 (38) 29 (45) 5 (8) 3.52
The obtained data related to the sugges-tions toward BL implementation revealed that the majority of students preferred to be provided by computer assisted training. More than three-fourth (81%) students “agreed” and “strongly agreed” if computer-assisted training provided to
all students. An idea about increasing the num-ber of internet lab was also positively responded by more than three-fourth (76%) students.
The findings revealed concerning the suggestions of BL implementation is to support the previous section about limitations. Six state-ments were allotted an expressed into chart to address and discuss this section. What were con-sidered as the salient limitation, the facilities such as internet connection was the major problem in learning online. Therefore, the idea of increasing number of computer labs received the highest response means from sixth and eighth semes-ters.
I think the most important to be focused is the internet connection, because it has important role in blended learning. Finding a way to solve that problem is important. (Interviewee 7)
The similar suggestion also expressed by interviewee 3 and 2. They confessed how diffi-cult for them to get good internet connection, especially to participate in live webinar so they can communicate in real-time instead of playing the record. Because of the issue, another sug-gestion was also delivered. Interviewee 1 also suggested the similar idea. She realized how im-portant participate and experience the real-time interaction in live webinar. In the course, webi-nars conducted twice with different topics but the same speaker who was native speaker. Therefore, in order to experience the authentic task and live interaction with native speaker and other students, join live webinar is a big deal to all students.
Despite of the above findings, it still ob-viously revealed the uncertainty of sixth semes-ters toward blended courses. It is indicated by slightly different means between the ideas of de-creasing and increasing blended hours. Whereas, the eighth semesters seemed obviously suggest the idea of increasing blended courses instead of decrease it. Another solution proposed was pro-vide training which also received high response. Sixth and eighth semesters showed high re-sponse means to the idea of provide training for students.
CONCLUSION AND SUGGESTION
Findings revealed that using BL, stu-dents experienced explicit grammar and vocabu-lary learning mostly through writing activities. Students also perceived their computer skill and interest were developed. However, connectivity
Volume 7, Nomor 3, November 2014 : 143-148
148
was indicated as a major problem followed by social isolation. Based on the problems per-ceived, majority of the students suggested to in-crease the number of computer lab and training for students.
Since this study was designed to offer a first step of a wide variety of research, the area of BL use in English classes, further researches investigating students’ attitude of BL in regard to gender, age, English language proficiency are recommended. In addition, the study also showed that there is connection between English mastery level and students’ preference. Howev-er, these conclusion were drawn based on de-scriptive analysis technique. Thus, researches administering statistical analysis to investigate these areas are also recommended.
REFERENCES
Arani, J. A. (2005). Teaching writing and read-ing English in ESP through a web-based communicative medium: Weblog. ESP-world 4 (3).
Bañados, E. (2006). A blended-learning peda-gogical model for teaching and learning EFL successfully through an online in-teractive multimedia environment. CALICO Journal, 23(3), 533–550.
Bijeikiene, Rasinskiene, Zutkiene’s (2011). Teachers’ attitudes towards the use of blended learning in general English classroom. Studies About Languages, 18, 122-127.
Burrus, J. (2009). Adult ESL students percep-tion on computer assisted language learning (M.Sc. Theses). Retrieved from http://digitalscholarship. unlv.edu/thesesdissertations/162/
Dziuban, C. D., Hartman. J. L., & Moskal. P. D. (2004). Blended learning. EDUCAUSE
Center for Applied Learning. Retrieved from http://net.educause.edu/ir/library/pdf/ERB0407.pdf
Lee, L. (2010). Fostering reflective writing and interactive exchange through blogging in an advanced language course. Re-CALL, 22(2), 212–227.
Pardede, P. (2011). Using BALL to develop writing skills: Students’ interest and per-ception. Paper presented at SWCU in-ternational Conference 2011 held in Satya Wacana Christian University, Salatiga, November 2011.
Pardede, P. (2012). Blended learning for ELT. Journal of English Teaching. 2 (3), pp. 165--178
Riley, R. (2000). Intel® Teach to the Future Brings Together Microsoft and Other Industry Leaders in Half-Billion Dollar Commitment to Improve Student Learn-ing. Retrieved on March 14, 2009 from: http://www.intel.de/press room/archive /releases/ed012000.htm
Shen Y. Q. (2004).“The possibilities of teaching online English extensive reading in Eng-lish major”, Journal of Yulin Teachers College, 4, pp.108-110.
Sun, Y. C. (2009). Voice blog: An exploratory study of language learning. Language Learning & Technology, 13(2), 88-103. Retrieved, March 25, 2011, from: http://llt.msu.edu/vol13num2/sun.pdf
Wahed Q. Al Zumor, A., K. Al Refaai, I., A. Ba-der Eddin, E., & H. Aziz Al- Rahman, F. (2013). EFL students’ perceptions of a blended learning environment: Ad-vantages, limitations and suggestions for improvement. English Language Teach-ing, 6(10). doi:10.5539/elt.v6n10p95
149
PENGARUH PENJAMINAN MUTU, KEPEMIMPINAN TRANSFORMASIONAL, BUDAYA AKADEMIK DAN KOMITMEN KERJA TERHADAP KINERJA DOSEN
DI KOTA JAMBI
Erni Murniarti Email: [email protected]
Mahasiswa Pascasarjana Universitas Negeri Jakarta
ABSTRACT
This research is aimed to determine the effect of quality assurance, transforma-tional leadership, academic culture and work commitment to performance.This quanti-tative research using a survey method and techniques of path analysis. The population was lectures of private higher Education in Jambi and 196 lectures were taken as sam-ples and selected by using proportional sampling. The result of data analysis showed that: (1) quality assurance, transformational leadership, and work komitmen effect posi-tively to lectures’ performance; (2) quality assurance, transformational leadership, and academic culture also effect positively to work komitmen; (3) transformational leader-ship effect positively to academic culture. Therefore, the quality assurance, transforma-tional leadership, academic culture, and work commitment in private higher education should be developed to improve lecturers’ performance.
Keywords: Quality assurance, transformational leadership, academic culture, work
commitment, and performance lecture.
ABSTRAK
Penelitian ini bertujuan untuk mengetahui pengaruh penjaminan mutu, kepemimpinan transformasional, budaya akademik, dan komitmen kerja. Teknik analisis jalur digunakan untuk menganalis data secara kwantitatif dan kualitatif. 196 dosen perguru-an tinggi di Jambi yang dipilih secara proposional dijadikan sebagai sampel penelitian. Hasil penelitian menunjukkan bahwa (1) penjaminan mutu, kepemimpinan transforma-sional, dan komitmen kerja berpengaruh positif terhadap kinerja dosen; (2) penjaminan mutu, kepemimpinan transformasional, dan budaya akademik berpengaruh positif ter-hadap komitmen kerja; (3) kepemimpinan transformasional berpengaruh positif ter-hadap bidaya akademik. Untuk itu, penjaminan mutu, kepemimpinan transformasional, budaya akademik, dan komitmen kerja mestinya ditingkatkan untuk meningkatkan kinerja dosen. Kata kunci: penjaminan mutu, kepemimpinan transformasional, budaya akademik, dan komitmen kerja
PENDAHULUAN
Persaingan di sektor jasa pendidikan yang sedemikian ketat dewasa ini mengharuskan setiap perguruan tinggi memiliki daya saing kuat agar dapat suvive. Salah satu modal utama yang harus dimiliki perguruan tinggi dalam membangun kekuatan dan daya saing adalah kualitas sumber daya manusia (SDM). Dalam lingkungan Perguruan Tinggi SDM yang memiliki peranan strategis adalah dosen. Dosen sebagai tenaga pendidik dan pengajar adalah pilar penting bagi kemajuan suatu perguruan tinggi. Oleh karena itu, sejau-
hmana kualitas lulusan mahasiswa suatu Perguruan Tinggi, sangat tergantung pada kuali-tas para dosennya. Dengan kondisi seperti itu, maka dosen dituntut untuk dapat menunjukkan kinerja yang memuaskan agar dapat mem-berikan kontribusi yang optimal bagi organisas-inya.
Kondisi yang berkembang saat ini bahwa persaingan sektor jasa pendidikan di kalangan perguruan tinggi dalam memperebut-kan pasar mahasiswa cukup ketat. Perguruan tinggi di Indonesia saat ini tumbuh subur. Terutama untuk perguruan tinggi swasta, ber-
Volume 7, Nomor 3, November 2014 : 149-156
150
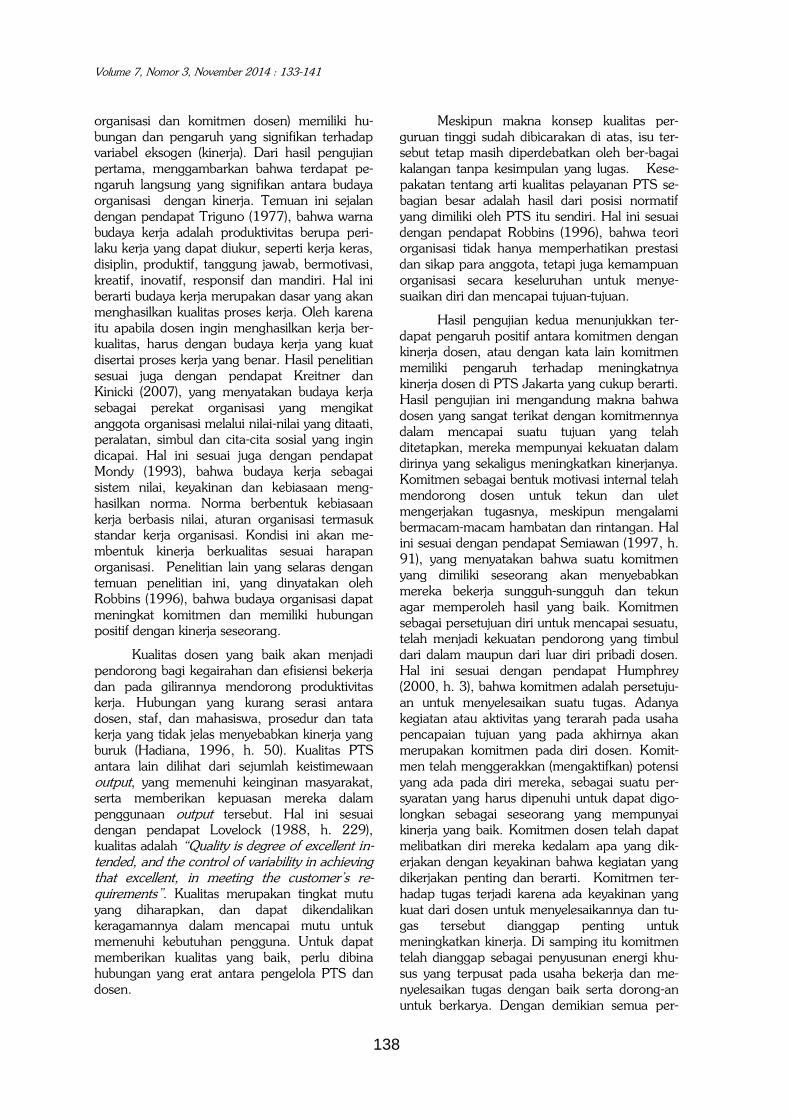
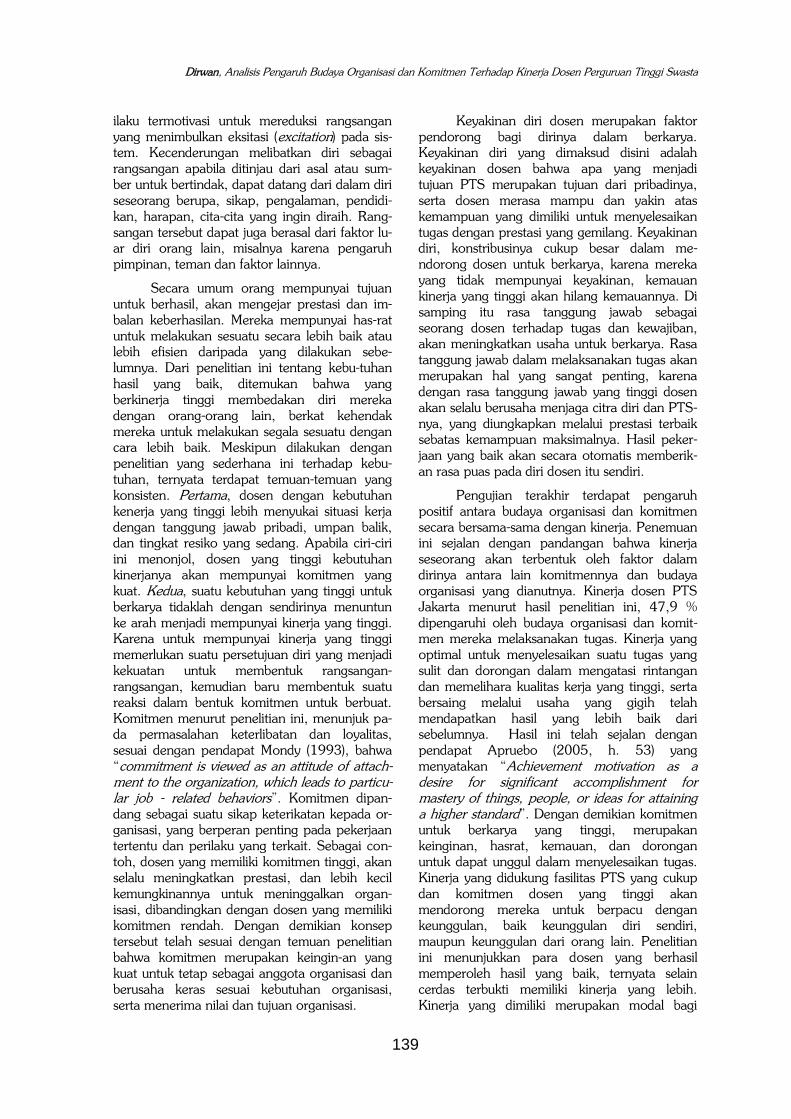
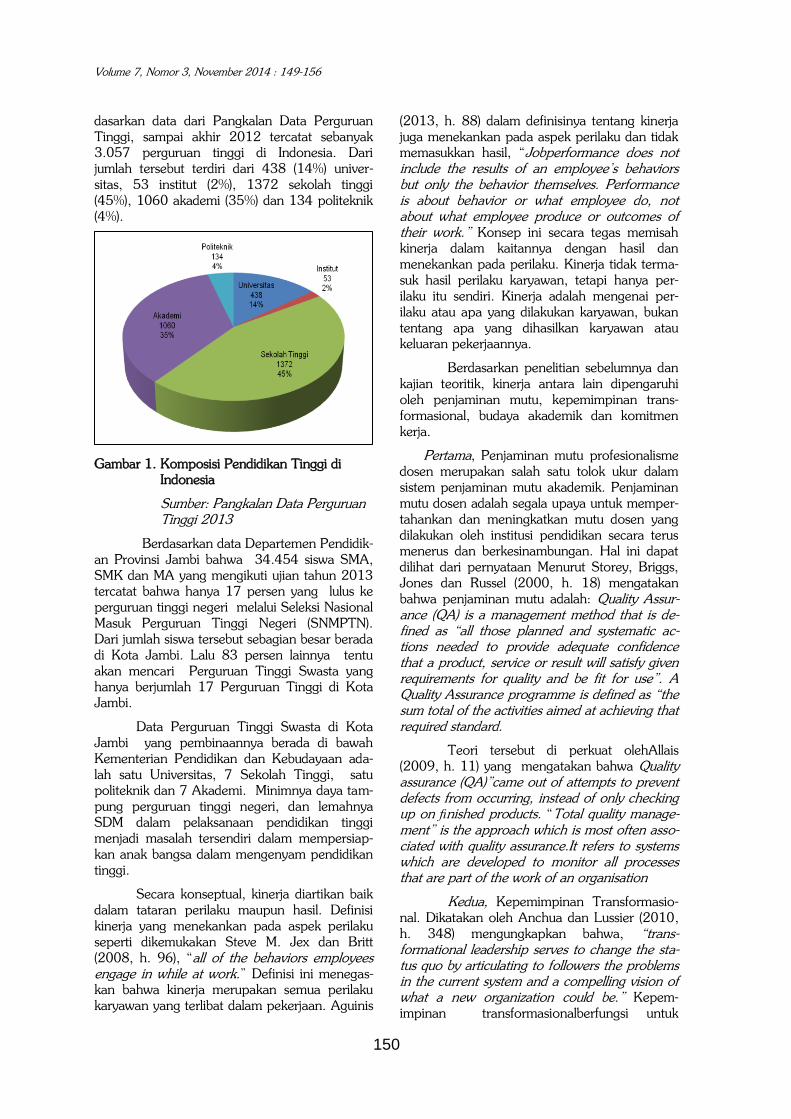
dasarkan data dari Pangkalan Data Perguruan Tinggi, sampai akhir 2012 tercatat sebanyak 3.057 perguruan tinggi di Indonesia. Dari jumlah tersebut terdiri dari 438 (14%) univer-sitas, 53 institut (2%), 1372 sekolah tinggi (45%), 1060 akademi (35%) dan 134 politeknik (4%).
Gambar 1. Komposisi Pendidikan Tinggi di Indonesia
Sumber: Pangkalan Data Perguruan Tinggi 2013
Berdasarkan data Departemen Pendidik-an Provinsi Jambi bahwa 34.454 siswa SMA, SMK dan MA yang mengikuti ujian tahun 2013 tercatat bahwa hanya 17 persen yang lulus ke perguruan tinggi negeri melalui Seleksi Nasional Masuk Perguruan Tinggi Negeri (SNMPTN). Dari jumlah siswa tersebut sebagian besar berada di Kota Jambi. Lalu 83 persen lainnya tentu akan mencari Perguruan Tinggi Swasta yang hanya berjumlah 17 Perguruan Tinggi di Kota Jambi.
Data Perguruan Tinggi Swasta di Kota Jambi yang pembinaannya berada di bawah Kementerian Pendidikan dan Kebudayaan ada-lah satu Universitas, 7 Sekolah Tinggi, satu politeknik dan 7 Akademi. Minimnya daya tam-pung perguruan tinggi negeri, dan lemahnya SDM dalam pelaksanaan pendidikan tinggi menjadi masalah tersendiri dalam mempersiap-kan anak bangsa dalam mengenyam pendidikan tinggi.
Secara konseptual, kinerja diartikan baik dalam tataran perilaku maupun hasil. Definisi kinerja yang menekankan pada aspek perilaku seperti dikemukakan Steve M. Jex dan Britt (2008, h. 96), “all of the behaviors employees engage in while at work.” Definisi ini menegas-kan bahwa kinerja merupakan semua perilaku karyawan yang terlibat dalam pekerjaan. Aguinis
(2013, h. 88) dalam definisinya tentang kinerja juga menekankan pada aspek perilaku dan tidak memasukkan hasil, “Jobperformance does not include the results of an employee’s behaviors but only the behavior themselves. Performance is about behavior or what employee do, not about what employee produce or outcomes of their work.” Konsep ini secara tegas memisah kinerja dalam kaitannya dengan hasil dan menekankan pada perilaku. Kinerja tidak terma-suk hasil perilaku karyawan, tetapi hanya per-ilaku itu sendiri. Kinerja adalah mengenai per-ilaku atau apa yang dilakukan karyawan, bukan tentang apa yang dihasilkan karyawan atau keluaran pekerjaannya.
Berdasarkan penelitian sebelumnya dan kajian teoritik, kinerja antara lain dipengaruhi oleh penjaminan mutu, kepemimpinan trans-formasional, budaya akademik dan komitmen kerja.
Pertama, Penjaminan mutu profesionalisme dosen merupakan salah satu tolok ukur dalam sistem penjaminan mutu akademik. Penjaminan mutu dosen adalah segala upaya untuk memper-tahankan dan meningkatkan mutu dosen yang dilakukan oleh institusi pendidikan secara terus menerus dan berkesinambungan. Hal ini dapat dilihat dari pernyataan Menurut Storey, Briggs, Jones dan Russel (2000, h. 18) mengatakan bahwa penjaminan mutu adalah: Quality Assur-ance (QA) is a management method that is de-fined as “all those planned and systematic ac-tions needed to provide adequate confidence that a product, service or result will satisfy given requirements for quality and be fit for use”. A Quality Assurance programme is defined as “the sum total of the activities aimed at achieving that required standard.
Teori tersebut di perkuat olehAllais (2009, h. 11) yang mengatakan bahwa Quality assurance (QA)”came out of attempts to prevent defects from occurring, instead of only checking up on finished products. “Total quality manage-ment” is the approach which is most often asso-ciated with quality assurance.It refers to systems which are developed to monitor all processes that are part of the work of an organisation
Kedua, Kepemimpinan Transformasio-nal. Dikatakan oleh Anchua dan Lussier (2010, h. 348) mengungkapkan bahwa, “trans-formational leadership serves to change the sta-tus quo by articulating to followers the problems in the current system and a compelling vision of what a new organization could be.” Kepem-impinan transformasionalberfungsi untuk
Murniarti, Pengaruh Penjaminan Mutu, Kepemimpinan Transformasional, Budaya Akademik dan Komitmen Kerja Terhadap Kinerja Dosen di Kota Jambi
151
melakukan perubahan organisasi dari status quo dengan mengartikulasikan visi bersama tentang masa depan kepada pengikutnya.Teori tersebut juga didukung oleh pendapat Daft (2009, h. 4) bahwa, kepemimpinan adalah suatu proses mempengaruhi antara pemimpin kepada para pengikutnya (staff) dimana keduanya berupaya untuk melakukan perubahan sebagai tujuan ber-sama.
Ketiga, Budaya Akademik. Amstrong (2010, h. 383), memberikan definisi mengenai budaya organisasi adalah, “ organizational or corporate culture is the pattern of values, norms, beliefs, attitudes and assumptions that may not have been articulated but shape the ways in which people in organizations behave and things get done. ‘Values’ refer to what is believed to be important about how people and organizations behave. ‘Norms’ are the unwritten rules of behaviour.” Budaya organisasi adalah polanilai, norma, keyakinan, sikap dan asumsi yang mungkin belum diartikulasikan tetapi memben-tuk cara di mana orang-orang dalam organisasi berperilaku dan hal-hal yang dilakukannya. Nilai merujuk pada apa yang diyakini penting tentang bagaimana orang dan organisasi berperilaku.
Dalam organisasi pendidikan, khususnya perguruan tinggi, dikenal adanya istilah budaya akademik. Nayak dan Venkatraman (2010, h. 1-12), memberikan penjelasan tentang budaya akademik sebagai berikut:A pattern of basic as-sumptions’ shared by academics, administrators, and students that has helped them in ‘solving their problems of external adaptation and inter-nal integration’ in the past. As these assump-tions, values, and beliefs have worked so well, they are not only maintained, but are also taught to the new members as ‘the correct way to per-ceive, think, and feel’ in dealing with problems relating to their intellectual activities such as teaching, learning, assessments, research, and administration.
Keempat, Komitmen Kerja. Menurut Amstrong (2010, h. 335) komitmen adalah, “commitment refers to attachment and loyalty. It is associated with the feelings of individuals about their organization.” Komitmen adalah pengikatan (attachment) dan loyalitas (loyality). Hal ini terkait dengan perasaan individu pada organisasi mereka. Brewer dan Hensher (1998, h. 118) yang menegaskan bahwa, “work com-mitment refer toa person's involvement in per-forming work for the benefit of clients or cus-tomers. Work-committed employees are more likely to enjoy their work, demonstrate loyalty
and interest in maximising service to the people they serve. Komitmen kerja adalah keterlibatan dalam melakukan pekerjaan untuk keuntungan klien atau pelanggan. Karyawan yang komit ter-hadap pekerjaan lebih menikmati pekerjaannya, menunjukkan loyalitas dan tetarik dalam me-maksimalkan pelayanan terhadap orang yang di-layaninya.
Penelitian ini diarahkan untuk melihat pengaruh penjaminan mutu, kepemimpinan transformasional, budaya akademik dan komit-men kerja terhadap kinerja dosen di berbagai perguruan tinggi swasta di Kota Jambi. Secara spesifik, masalah penelitian dirumuskan sebagai berikut: 1) apakah penjaminan mutu ber-pengaruh langsung terhadap kinerja?; 2) apakah kepemimpinan transformasional berpengaruh langsung terhadap kinerja?; 3) Apakah komit-men kerja berpengaruh langsung terhadap kiner-ja?; 4) Apakah penjaminan mutu berpengaruh langsung terhadap komitmen kerja?; 5) Apakah kepemimpinan transformasional berpengaruh langsung terhadap komitmen kerja?; 6) Apakah budaya akademik berpengaruh langsung ter-hadap komitmen kerja?; 7) Apakah penjaminan mutu berpengaruh langsung terhadap budaya akademik?; 8) Apakah kepemimpinan transfor-masional berpengaruh langsung terhadap bu-daya akademik? Berdasarkan rumusan masalah tersebut. Sedangkan hipotesis yang akan diuji dalam penelitian ini dirumuskan sebagai berikut: 1) Penjaminan mutu berpengaruh langsung posi-tif terhadap kinerja dosen. 2) Kepemimpinan transformasional berpengaruh langsung positif terhadap kinerja dosen.3) Komitmen kerja ber-pengaruh langsung positif terhadap kinerja dosen. 4) Penjaminan mutu berpengaruh lang-sung positif terhadap komitmen kerja. 5) Kepemimpinan transformasional berpengaruh langsung positif terhadap komitmen kerja. 6) Budaya akademik berpengaruh langsung positif terhadap komitmen kerja. 7) Penjaminan mutu berpengaruh langsung positif terhadap budaya akademik. 8) Kepemimpinan transformasional berpengaruh langsung positifterhadap budaya akademik.
METODOLOGI PENELITIAN
Penelitian ini menggunakan pendekatan kuantitatif dan menganalisis hipotesis dengan menggunakan analisis jalur (path analysis). Popu-lasi penelitian adalah Dosen pada 11 Perguruan Tinggi Swasta di Kota Jambi, berjumlah 385 dosen dan sampel sebanyak 196 dosen. Pengumpulan data menggunakan kuesioner yang didesain dengan skala Linkert skala 1-5.
Volume 7, Nomor 3, November 2014 : 149-156
152
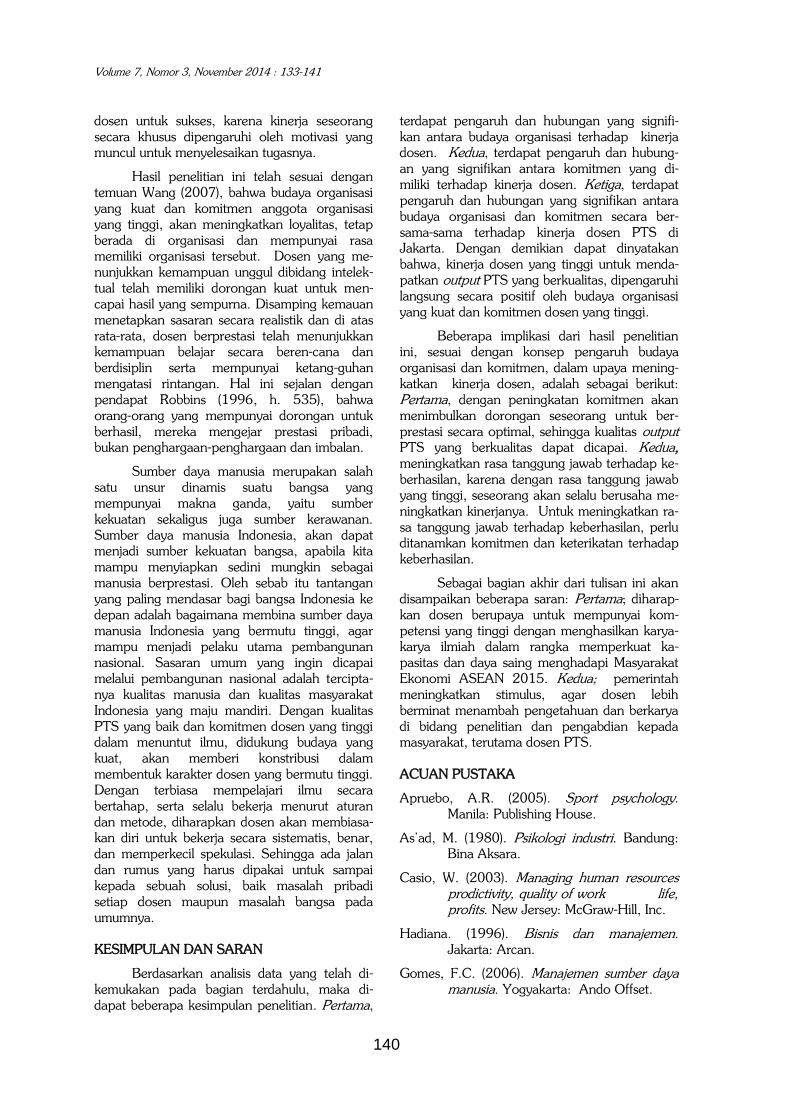
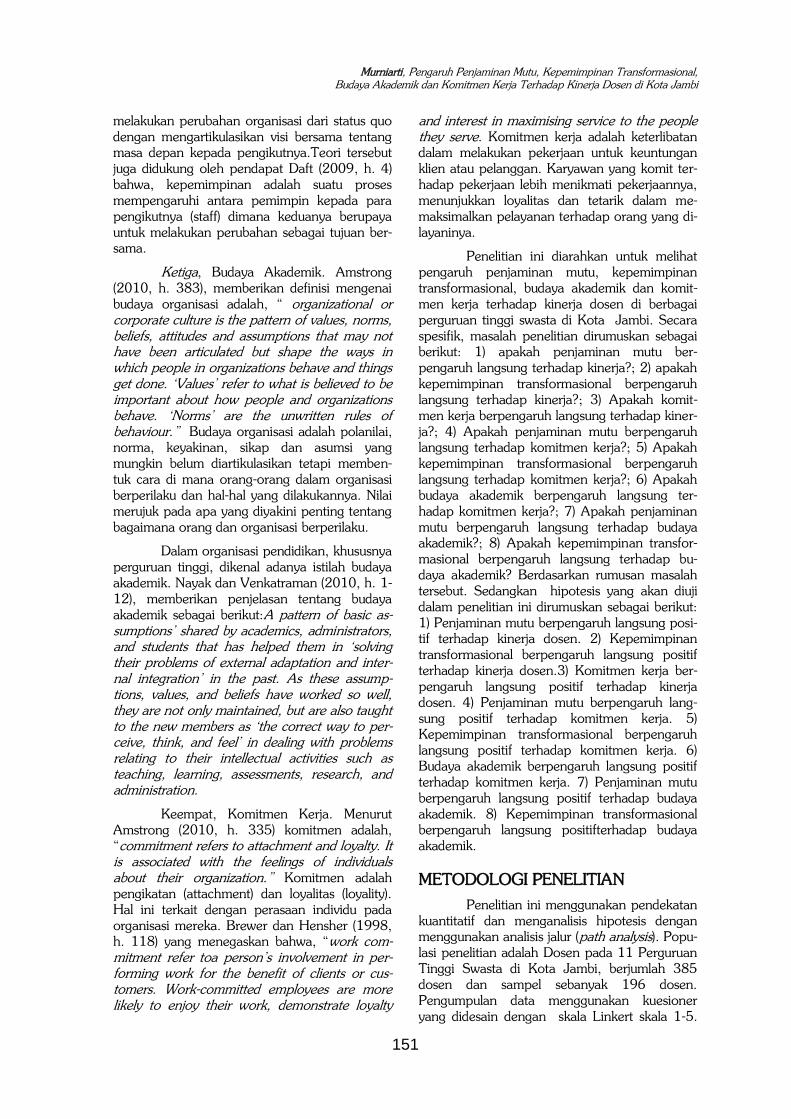
Dan dilakukan uji validasi dan reliabilitas. Pengujian validitas menggunakan Korelasi Product Moment dari Pearson dan reliabilitas menggunakan Alpha Cronbach. Adapun kons-talasi dalam penelitian ini digambarkan pada Gambar 2.
Gambar 2: Konstalasi Penelitian
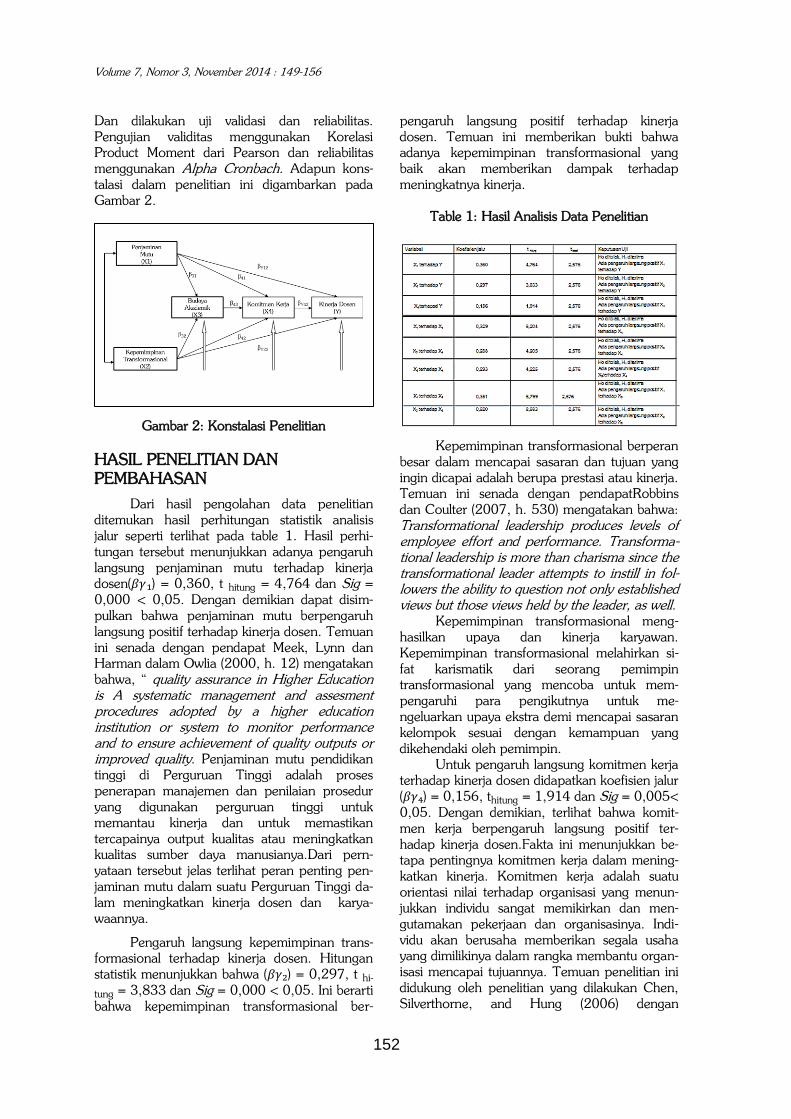
HASIL PENELITIAN DAN PEMBAHASAN
Dari hasil pengolahan data penelitian ditemukan hasil perhitungan statistik analisis jalur seperti terlihat pada table 1. Hasil perhi-tungan tersebut menunjukkan adanya pengaruh langsung penjaminan mutu terhadap kinerja dosen(𝛽𝛾₁) = 0,360, t hitung = 4,764 dan Sig = 0,000 < 0,05. Dengan demikian dapat disim-pulkan bahwa penjaminan mutu berpengaruh langsung positif terhadap kinerja dosen. Temuan ini senada dengan pendapat Meek, Lynn dan Harman dalam Owlia (2000, h. 12) mengatakan bahwa, “ quality assurance in Higher Education is A systematic management and assesment procedures adopted by a higher education institution or system to monitor performance and to ensure achievement of quality outputs or improved quality. Penjaminan mutu pendidikan tinggi di Perguruan Tinggi adalah proses penerapan manajemen dan penilaian prosedur yang digunakan perguruan tinggi untuk memantau kinerja dan untuk memastikan tercapainya output kualitas atau meningkatkan kualitas sumber daya manusianya.Dari pern-yataan tersebut jelas terlihat peran penting pen-jaminan mutu dalam suatu Perguruan Tinggi da-lam meningkatkan kinerja dosen dan karya-waannya.
Pengaruh langsung kepemimpinan trans-formasional terhadap kinerja dosen. Hitungan statistik menunjukkan bahwa (𝛽𝛾₂) = 0,297, t hi-
tung = 3,833 dan Sig = 0,000 < 0,05. Ini berarti bahwa kepemimpinan transformasional ber-
pengaruh langsung positif terhadap kinerja dosen. Temuan ini memberikan bukti bahwa adanya kepemimpinan transformasional yang baik akan memberikan dampak terhadap meningkatnya kinerja.
Table 1: Hasil Analisis Data Penelitian
Kepemimpinan transformasional berperan besar dalam mencapai sasaran dan tujuan yang ingin dicapai adalah berupa prestasi atau kinerja. Temuan ini senada dengan pendapatRobbins dan Coulter (2007, h. 530) mengatakan bahwa: Transformational leadership produces levels of employee effort and performance. Transforma-tional leadership is more than charisma since the transformational leader attempts to instill in fol-lowers the ability to question not only established views but those views held by the leader, as well.
Kepemimpinan transformasional meng-hasilkan upaya dan kinerja karyawan. Kepemimpinan transformasional melahirkan si-fat karismatik dari seorang pemimpin transformasional yang mencoba untuk mem-pengaruhi para pengikutnya untuk me-ngeluarkan upaya ekstra demi mencapai sasaran kelompok sesuai dengan kemampuan yang dikehendaki oleh pemimpin.
Untuk pengaruh langsung komitmen kerja terhadap kinerja dosen didapatkan koefisien jalur (𝛽𝛾₄) = 0,156, thitung = 1,914 dan Sig = 0,005< 0,05. Dengan demikian, terlihat bahwa komit-men kerja berpengaruh langsung positif ter-hadap kinerja dosen.Fakta ini menunjukkan be-tapa pentingnya komitmen kerja dalam mening-katkan kinerja. Komitmen kerja adalah suatu orientasi nilai terhadap organisasi yang menun-jukkan individu sangat memikirkan dan men-gutamakan pekerjaan dan organisasinya. Indi-vidu akan berusaha memberikan segala usaha yang dimilikinya dalam rangka membantu organ-isasi mencapai tujuannya. Temuan penelitian ini didukung oleh penelitian yang dilakukan Chen, Silverthorne, and Hung (2006) dengan
Murniarti, Pengaruh Penjaminan Mutu, Kepemimpinan Transformasional, Budaya Akademik dan Komitmen Kerja Terhadap Kinerja Dosen di Kota Jambi
153
mengambil sampel akuntan profesional di dua negara, yaitu Taiwan dan Amerika. Hasilnya menunjukkan bahwa komitmen organisasi memiliki pengaruh postif terhadap kinerja. Maka hasil penelitian semakin memperkuat teori-teori yang membuktikan bahwa komitmen kerja berpengaruh langsung positif terhadap kinerja.
Berikutnya untuk pengaruh langsung pen-jaminan mutu terhadap komitmen kerja didapat-kan koefisien jalur (𝛽₄₁)= 0,329, t hitung = 5,204 dan Sig = 0,000< 0,05. Dengan demikian dapat disimpulkan bahwa penjaminan mutu berpengaruh langsung positif terhadap komitmen kerja. Temuan ini menggambarkan bahwa secara empiris bahwa penjaminan mutu yang dilakukan secara terus menerus dan berkesinambungan akan meningkatkan komit-men kerja. Fakta ini menjelaskan betapa pent-ingnya penjaminan mutu sebagai upaya untuk meningkatkan komitmen kerja.
Penjaminan mutu adalah proses peneta-pan dan pemenuhan standar mutu pengelolaan secara konsisten dan berkelanjutan, sehingga konsumen, produsen dan pihak lain yang berkepentingan memperoleh kepuasan pelang-gan. Kepuasan pelanggan dapat diperoleh jika setiap karyawan dalam suatu organisasi memiliki komitmen kerja yang tinggi.
Pengaruh penjaminan mutu terhadap komitmen kerja secara teoritik dapat dilihat da-lam penjelasan oleh Meek, lynn dan Harman da-lam Owlia (2008, h.12) mengatakan bahwa, “quality assurance in Higher Education is A sys-tematic management and assessment procedures adopted by a higher education institution or sys-tem to monitor performance and to ensure achievement of quality outputs or improved qual-ity.Penjaminan mutu meliputi: penjaminan mutu internal dan penjaminan mutu eksternal. Penja-minan mutu internal (internal quality assurance), bentuknya berupa evaluasi diri yang dilakukan oleh program studi atau institusi perguruan ting-gi. Tujuannya untuk memperbaiki kinerja dan memberi penjaminan mutu internal, khususnya kepada dosen, peneliti, karyawan, dan maha-siswa. Dengan hasil demikian, maka hasil penelitian semakin memperkuat teori-teori yang membuktikan bahwa penjaminan mutu ber-pengaruh langsung positif terhadap komitmen kerja.
Untuk Pengaruh langsung kepemimpinan transformasional terhadap komitmen kerja (𝛽₄₂) = 0,288, t hitung = 4,205 dan Sig = 0,000 < 0,05. Ini berarti bahwa kepemimpinan transformasional berpengaruh positif terhadap
komitmen kerja. Temuan ini menggambarkan bahwa secara empiris kepemimpinan transformasional akan memberikan dampak terhadap meningkatnya komitmen kerja. Fakta ini menunjukkan betapa pentingnya kepemimpinan transformasional dalam komitmen kerja. Robbins dan Jugde (2011:242) mendefinisikan kepemimpinan transformasional sebagai berikut: Transformational leaders inspire followers to transcend their self-interests for the good of the organization and can have an extraordinary effect on their followers. Transformational leadership isn’t opposing approaches to getting things done.
Pemimpin transformasional menginspirasi pengikut tidak hanya percaya pada pemimpin secara pribadi, tetapi percaya pada potensi mereka sendiri serta untuk membangun dan menciptakan masa depan yang lebih baik bagi organisasi. Pemimpin transformasional membuat perubahan signifikan pada pengikut dan organization. Mereka memiliki kemampuan untuk memimpin perubahan dalam organisasi, misi, strategi, struktur, dan budaya, serta untuk mempromosikan inovasi dalam produk dan teknologi. Pemimpin transformasional tidak hanya mengandalkan aturan nyata dan insentif untuk mengendalikan transaksi tertentu dengan pengikut. Mereka fokus pada kualitas berwujud seperti visi, nilai-nilai bersama, dan ide-ide untuk membangun hubungan, memberikan arti yang lebih besar untuk kegiatan yang beragam, dan menemukan landasan bersama untuk meminta pengikutnya dalam proses perubahan. Dengan hasil demikian, maka hasil penelitian semakin memperkuat teori-teori yang membuktikan bahwa kepemimpinan transformasional ber-pengaruh langsung positif terhadap komitmen kerja.
Sementara untuk pengaruh langsung bu-daya akademik terhadap komitmen kerja didapatkan koefisien jalur (𝛽₄₃) = 0,293, t hitung = 4,225 dan Sig = 0,000 < 0,05. Artinya bah-wa budaya akademikberpengaruh langsung posi-tif terhadap komitmen kerja.Fakta ini menunjuk-kan betapa pentingnya budaya akademik yang kondusif dalam meningkatkan komitmen kerja. Budaya akademik sebagai cerminan nilai akan memberikan semangat, inspirasi dan panutan, sehingga mempengaruhi cara bertindak. Perilaku dan cara bertindakan yang dilakukan warga kampus akan berkontribusi dalam mementukan kualitas kerjanyasuatu kebiasaan.Temuan penelitian ini didukung oleh teori Kreitner dan Kinicki (2001, h. 68) yang mengatakan bahwa budaya organsisasi sebagai berikut: Budaya or-
Volume 7, Nomor 3, November 2014 : 149-156
154
ganisasi adalah nilai-nilai dan keyakinan bersama yang mendasari identitas perusahaan. Teori ini menunjukkan tiga karakteristik penting budaya organisasi yaitu: 1) budaya organisasi diteruskan kepada pekerja baru melalui proses sosialisasi; 2) budaya organisasi mempengaruhi perilaku kita dipekerjaan; dan 3) budaya organisasi bekerja pada dua tingkatan yang berbeda.
Dalam organisasi pendidikan, khususnya perguruan tinggi, dikenal adanya istilah budaya akademik. Terkait dengan budaya akademik ini diungkapkan oleh Shen dan Tian sebagai berikut:Academic culture on campus is actually the external manifest of the common values, spirits, behavior norms of people on campus who are pursuing and developing their study and research. This kind of culture can be embodied in the rules and regulations, behavior patterns and the material facilities. It mainly consists of academic outlooks, academic spirits, academic ethics and academic environments.Pernyataan tersebut menunjukkan bahwa budaya akademik di kampus sebenarnya sebagai cerminan eksternal atas nilai-nilai bersama, roh, norma-norma perilaku orang di kampus yang mengejar dan mengembangkan studi dan penelitian. Budaya semacam ini dapat diwujudkan dalam aturan dan peraturan, pola perilaku dan fasilitas materi. Budaya akademik dapat terlihat dari pandangan akademik, spirit akademik, etika akademik dan lingkungan akademik. Dari pern-yataan ini jelas terlihat peran penting budaya akademik dalam meningkatkan komitmen kerja.
Terakhir untuk pengaruh penjaminan mu-tu terhadap budaya akademik didapatkan koefisien jalur (𝛽₃₁)= 0,351, t hitung = 5,799 dan Sig = 0,000 < 0,05. Dengan demikian dapat disimpulkan bahwa penjaminan mutu ber-pengaruh langsung positif terhadap budaya akademik. Temuan ini memberikan makna bah-wa secara empiris peningkatan penjaminan mu-tuyang secara terus-menerus dan berkelanjutan akan meningkatkan budaya kerja yang kondusif. Fakta ini menunjukkan betapa pentingnya faktor penjaminan mutu dalam meningkatkan budaya akademik.
Pengaruh penjaminan mutu terhadap bu-daya akademik secara teoritik dapat dilihat da-lam penjelasan berikut: Lewis (1994:212) menyatakan bahwa “The principles and process of total quality can be applied to managerial and professional performance, in that the total quality approach is effective strips away ambiguity, improves communication, fosters better performance, and improves customer
relations. This approach is effective for professionals accounting to management information systems and marketing, regardless of the industry”. Artinya bahwa prinsip-prinsip dan proses mutu secara total dapat diterapkan terhadap kinerja manajerial dan professional, dalam pendekatan kualitas total, berjalan secara efektif untuk dua makna, meningkatkan komunikasi, mendorong kinerja yang lebih baik, dan meningkatkan hubungan pelanggan. Pendekatan ini efektif untuk profesinal yang terlibat dalam fungsi staf dari sumber daya manusia dan akuntansi untuk sitem informasi manajemen dan pemasaran, terlepas dari indus-tri.Kemudian Nayak dan Venkatraman (2010, h. 12) memberikan penjelasan tentang budaya akademik sebagai berikut:A pattern of basic assumptions’ shared by academics, administrators, and students that has helped them in ‘solving their problems of external adaptation and internal integration’ in the past. As these assumptions, values, and beliefs have worked so well, they are not only maintained, but are also taught to the new members as ‘the correct way to perceive, think, and feel’ in dealing with problems relating to their intellectual activities such as teaching, learning, assessments, research, and administration.Dari pernyataan ini jelas terlihat peran penting pen-jaminan mutu dalam meningkatkan budaya akademik.Dengan hasil demikian, maka hasil penelitian semakin memperkuat teori-teori yang membuktikan bahwa penjaminan mutu berpengaruh langsung positif terhadap budaya akademik.
Untuk pengaruh langsung kepemimpinan transformasional terhadap budaya akademik (𝛽₃₂) = 0,520, t hitung = 8,583 dan Sig = 0,000 < 0,05. Ini berarti bahwa kepemimpinan trans-formasional berpengaruh positif terhadap bu-daya akademik. Temuan ini menggambarkan bahwa secara empiris kepemimpinan transfor-masional yang humanis akan meningkatkan bu-daya akademik. Fakta ini menunjukkan betapa pentingnya faktor kepemimpinan transformasional dalam budaya akademik.
Kepemimpinan transformasional pertama kali diperkenalkan oleh Burn dikutip oleh Jabnoun dan Rasasi (2005, h. 70) yang menjelaskan bahwa kepemimpinan transfor-masional sebagai proses yang mana pemimpin mempengaruhi perubahan yang radikal dalam perilaku bawahan. Kepemimpinan transfor-masional meningkatkan kepercayaan individu atau kelompok, memunculkan kesadaran dan ketertarikan di dalam kelompok atau organisasi
Murniarti, Pengaruh Penjaminan Mutu, Kepemimpinan Transformasional, Budaya Akademik dan Komitmen Kerja Terhadap Kinerja Dosen di Kota Jambi
155
serta mencoba menggerakan perhatihan bawahan pada prestasi dan pertumbuhan. Pemimpin juga mencari cara kerja baru, peluang baru dan lebih menyukai keefektifan untuk efisiensi.
Budaya akademik tidak dapat dipisahkan dengan kepemimpinan transformasional dalam organisasi karena budaya akademik tumbuh dan berkembang bersama pendiri dan pemimpin transformasional yang kuat. Perkembangan or-ganisasi sangat bergantung pada kemampuan pemimpin. Namun, pemimpin dapat bertindak benar dalam mengelola organisasi, tetapi juga tidak luput dari kemungkinan berbuat salah. Pemimpin transformasional diharapkan juga mampu menangkap harapan dari pengikutnya. Menurut Wibowo (2013, h. 311) pada dasarnya pengikut akan loyal pada pemimpin apabila harapannya terpenuhi.Dengan hasil demikian, maka hasil penelitian semakin memperkuat teori-teori yang membuktikan bahwa kepem-impinan transformasional berpengaruh langsung positif terhadap budaya akademik.
KESIMPULAN
Penjaminan mutu, Kepemimpinan transformasional, Budaya akademik dan Komit-men kerja memiliki pengaruh positif terhadap Kinerja,dan Penjaminan mutu, Kepemimpinan transformasional dan Budaya akademik memiliki pengaruh positif terhadap Komitmen kerja, serta Penjaminan mutu, Kepemimpinan transforma-sional memiliki pengaruh positif terhadap Bu-daya akademik. Dengan demikian penjaminan mutu, kepemimpinan transformasional, budaya akademik, dan komitmen kerja harus ditingkat-kan dan diperbaiki sehingga kinerja seorang dosen dapat berkualitas dan memuaskan agar dapat memberikan kontribusi yang optimal bagi perguruan tingginya.
Langkah-langkah yang harus dilakukan dalam peningkatan Kinerja Dosen Perguruan Tinggi Swasta di Kota Jambi adalah: Pertama, Penjaminan mutuperguruan tinggi swasta di Ko-ta Jambi harus melakukan evaluasi diri untuk mengetahui tantangan dan hambatan yang dihadapi, kemudian melakukan tinjauan ter-hadap kesesuaian visi dan misi dalam menjawab tantangan dan hambatan, termasuk di dalamnya menentapkan visi dan misi. Ditekankan dalam pembuatan visi dan misi sebaiknya visi yang dibuat adalah visi yang merupaka mimpi ber-sama dari perguruan tinggi dan hendak di-wujudkan secara bersama. Kedua, Kepemimpi-nan transformasional harus bisa membuat staff
dosen termotivasi melakukan lebih dari apa yang diharapkan sebelumnya sehingga mendorong kinerja yang lebih baik, dengan memberikan perhatian, inspirasi serta stimulus intelektual se-hingga membuat karyawan lebih nyaman dan termotivasi tanpa merasa tertekan sehingga dapat mencapai kinerja yang diharapkan. Keti-ga, Budaya Akademik perguruan tinggi harus di bangun, di kembangkan dan diimplementasikan dengan baik agar menjadi karakter dan landasan filosofis bagi kemajuan perguruan tinggi itu sendiri maupun Sumber Daya Manusia (staff dosen, karyawan pendidik serta mahasiswa). Keempat, Komitmen Kerja harus ditingkatkan dengan etos kerja yang tinggi, karena dengan etos kerja yang baik akan memiliki keterlibatan kerja yang tinggi sesuai profesinya.
ACUAN PUSTAKA
Aguinis, H. (2013).Performance management, New Jersey: Pearson Education, Inc.
Armstrong, M. (2006). A Handbook of human resource management practice, Phila-delphia: Kogan Page.
Berry (2004). Organizational culture: a frame-work and strategies for facilitating em-ployee whistleblowing, Employee Re-sponsibilities and Rights Journal, vol. 6, 1, 2004, 2-7.
Brown, Andrew D., Organizational culture, Great Britain: Pearson Education Lim-ited, 1998.
Champoux, J. E. (2006).Organizational be-havior (3rd Ed.). Mason: Thomson.
Colquitt, J. A., Jeffery A. L. and Michael J. W. (2009). Organizational behavior: Im-proving performance and commitment in the workplace, New York: McGraw-Hill Companies, Inc.
Dessler, G. (2011). Human resources manage-ment. Essex: Pearson Education Lim-ited.
Gómez-Mejía, Luis R., David B. B., and Robert L. C. (2012).Managing human re-sources. New Jersey: Pearson Educa-tion, Inc.
Hair, J. F., Jr, William C. B., Barry J. B., and Rolph E.A. (2010).Multivariate data analysis: A global perspective.New Jer-sey: Pearson Education, Inc.
Volume 7, Nomor 3, November 2014 : 149-156
156
Jex, S. M. &Britt, T. W. (2008).Psychology: A scientist-practitioner approach. New Jersey: John Wiley & Sons, Inc.
Kreitner, Robert and Angelo Kinicki, (2008),Organizational Behavior, New York: McGraw-Hill Irwin.
Lussier, Robert N. and Christopher F. Achua (2010),. Leadership: Theory, Applica-tion, & Skill Development, Mason: South-Western Cengege Learning.
McShane, Steven L and Mary Ann von Gli-now,(2008),Organizational Behavior, New York: McGraw-Hill Irwin.
Meyer, John H. and Natalie J. Al-len,(1997),Commitment in The Work-place: Theory, Research, and Ap-plication, California: SAGE Publications, Inc.
Pinder, Craig C.(2008),Work Motivation in Or-ganizational Behavior, New York: Psy-chology Press.
Robbins, Stephen P. and Timothy Judge,(2009)Organizational Behavior, New Jersey: Pearson Prentice Hall.
Schargel, Franklin P.(1993),Transforming Edu-cation Through Total Quality Manage-ment: A Practitioner’s Guide, New york: EYE on Education.
Shen, Xi and Xianghong Tian, “Academic Cul-ture and Campus Culture of Universi-ties”, Higher Education Studies, Vol. 2, No. 2, 61-65.
Smith, Andrew Lee, (2008), A Study of the Re-lationship Between School Culture and Standardized Test Scores, Florida: Uni-versal-Publishers. .
Stoner, James A. F., R. Edward Freeman & Daniel R. Gilbert, JR.,(1995),Management , New Jersey: Prentice-Hall, Inc., Englewood Cliffs.
Wood, Jack, Rachid Zeffane, Michele From-holtz, Retha Wiesner, Rachel Morrison, and Pi-Shen Seet,(2013)Organizational Behavour: Core Concepts and Apllica-tions, Milton Qld: John Wiley & Sons, Inc.
Yukl, Gary, (2010),Leadership In Organization,
New Jersey: Pearson Education, Inc.
157
IMPROVING UNIVERSITY STUDENTS’ READING COMPREHENSION USING GRAPHIC ORGANIZERS
Juella Rumiris
Email: [email protected] University of Wolverhampton, United Kingdom
ABSTRACT
This study was a classroom action research aimed to improve EFL tertiary students’ reading comprehension by using graphic organizer, one of teaching methods used uni-versally to help learners to understand reading deeper, especially for retelling story out-come. The participants were 44 undergraduate students attending the researcher Read-ing II class. The improvement in this study was focused on the participants’ skills of de-termining main idea, identifying topic, summarizing, and enriching vocabulary. To check students’ comprehension, the researcher measured the students’ reading com-prehension using open-ended questions in written form, interview, as well as rubrics which are presented in both quantitative and qualitative data. The results revealed that there was no significant improvement in the participants’ main idea identification and vocabulary enrichment skills. However, there was robustly significant improvement in their topic identification and summarizing skills.
Keyword: graphic organizer, reading comprehension, main idea, topic, summarizing.
ABSTRAK
Penelitian tindakan kelas ini bertujuan untuk meningkatkan pemahaman membaca ma-hasiswa dengan menggunakan metode graphic organizer―salah satu metode yang digunakan untuk membantu pemahaman secara menyeluruh dan mendalam, khusunya untuk tujuan mengungkapkan kembali sebuah wacana. Peningkatan pemahaman dalam hal ini dibatasi pada kemampuan mengidentifikasi ide pokok dan topik, penulisan ring-kasan, dan peningkatan kosa kata. Sebanyak 44 mahasiswa yang mengikuti matakuliah Reading II berpatisipasi pada penelitian ini. Untuk mengukur tingkat pembahaman ma-hasiswa dalam membaca, peneliti menggunakan pertanyaan terbuka dalam bentuk ter-tulis, wawancara, dan rubrik, yang disampaikan dalam bentuk kwantitatif dan kualitatif. Hasil penelitian menunjukkan bahwa setelah tiga siklus, pemahaman ide pokok dan kosa kata mahasiswa tidak mengalami peningkatan yang signifikan, namun terjadi pen-ingkatan yang signifikan pada aspek pemahaman topik dan penulisan ringkasan bacaan.
Kata Kunci: graphic organizer, pemahaman membaca, ide pokok, topik, ringkasan.
INTRODUCTION
Reading comprehension is not only an essential but also the most important skill for learners of English because of its importance to ensure success in learning. Correia (2006) states that “Reading is a crucial skill for students of ESL and EFL, …” (p.16). in line with that, Pard-ede (2006) accentuated that for students who are learning a SL/FL reading is the most crucial skill to master due to several reasons. First, stu-dents can usually perform at a higher level in reading than in any other skills. They can quite accurately understand written materials that they could not discuss orally or in writing with equiva-
lent accuracy or thoroughness. Such condition will undoubtedly enhance their motivation to learn. Second, reading necessitates very mini-mum requirements. Different from speaking which requires opportunities to interact with sparring partner, or from writing which needs a lot of guidance and time to practice, reading ne-cessitates only a text and motivation. Third, reading is a service skill. After learning how to read effectively, students will be able to learn ef-fectively by reading.
Despite its great importance reading comprehension is a big matter for EFL students. Students in Indonesia do not have reading habits
Volume 7, Nomor 3, November 2014 : 157-164
158
both at school and home. Much information gained relies on teachers or visual-audio media which are the simplest and fastest ways to gain information. As a result, students do not have much time to interact with books and know them well. Hui (2010) says that when students read English text, they are placed more low level or local processing strategies (p.19). Most lear-ners may read more than three to five times, but they still cannot understand the reading content. Regarding this, there are some reasons. First, learners are lack of prior knowledge. Prior knowledge is established from cognitive infor-mation which is mostly gained from reading. There are many reading texts, especially for uni-versity levels are based on English native lan-guage countries which have different culture and experience from countries using English as se-cond or foreign language. Thus, students do not have interest in reading books in English due to lack of culture understanding. Second, learners tend to use native language in daily conversation rather than English. This situation support learn-ers less to practice unfamiliar words in English as part of learning. Third, in reading lessons learn-ers are occupied to answer questions which only allow them to read parts of reading. As a conse-quence, they do not know the whole reading and find the enjoyment of reading.
As an English teacher in EFL class, I have observed, learned and applied graphic or-ganizers to improve students’ reading compre-hension. Graphic organizer is a technique to help students to make reading content easier to understand and learn (Ellis, 2001). Based on my experience, students can separate important in-formation from less important and has system-atical framework in planning, doing act toward his or her plan and plan reflection. These guide them to be strategic learners (Ellis, 2001).
The use of graphic organizers have been proved successfully helping EFL students to reach better reading comprehension due to the fact the method makes reading an active activity so that the readers can comprehend what they read or see what lies between the lines. The idea of the importance of reading as an active activity was clearly indicated by Correia (2006) in her classification of reading into passive and active reading. Passive reading tasks do not require students to read deeply to answer the questions. The types of passive tasks of reading compre-hension practice are multiple choice items, true and false form and vocabulary work e.g syno-nym and antonym. These are known as the most frequent types of reading comprehension
practices used. Correia (2006) believes such types of exercises as reading activity in class-room will encourage passive reading behavior: to find answer to a question. They also discour-age students to read between the lines or ques-tion the veracity and source of the information contained in the text. Those kinds of practice generally refer only to parts of the text, not to the text as a whole. The last reason is that it is totally neither challenging nor fun (p.17). On the other hand, active reading tasks require students to go beyond a superficial reading of the text to read “between the lines.” Learners are en-couraged to think not only deeply but also criti-cally about the topic. Correia agrees (as cited in Grabe,1997) that there are strong evidence by making diagrams and tables while reading texts, students can get better understand the co-herence and logic of the information being pre-sented. As consequence “will be able to locate the main ideas and distinguish them from less important information” (p.17).
A teacher’s role is to make sure that learners have prior knowledge related to concept and to provide a means for helping the students make connections between prior knowledge and new concepts. Graphic organizers can link the new information to existing knowledge easier and help learners to build schema to understand new concepts. Guastello et.al (2000) says that if prior knowledge is activated, the schema will provide a framework to which the new infor-mation can be attached and comprehension will be improved (pp.356-364).
According to Strangman, Hall, and Meyer (2003) a graphic organizer is a visual and graphic display that depicts the relationships be-tween facts, terms, and/or ideas within a learn-ing task. Graphic organizers are also sometimes referred to as knowledge maps, concept maps, story maps, cognitive organizers, advance organ-izers, or concept diagrams (pp.2-4). There are many types of graphic organizers and each of them has the core concept, which is to show connection among facts, terms and ideas of reading task. A graphic organizer is supposed to show these three components to be a communi-cative graphic organizer.
Ellis (2005, p.3) mentions three bene-fits of using graphic organizers. First, graphic organizers make content easier to understand and learn. They help students to separate im-portant information from less important, yet in-teresting enough. Second, graphic organizers decrease the necessary semantic information
Rumiris, Improving University Students’ Reading Comprehension Using Graphic Organizers
159
processing skills required to learn the material. Graphic organizers allow material to be set in sophisticated organization to be easier to under-stand. Third, students who use graphic or-ganizers may become more strategic learners. Strategic learners include how a person thinks and acts when planning, executing and evalu-ating a task and the outcomes.
Ellis agrees with Novak and Gawin (cited in Ellis, 2005) that a concept map is a vis-ual illustration displaying the organization of concepts and outlining the relationship among or between the concepts. Concept maps should be: hierarchical with subordinate concepts at the apex; labeled with precise linking words; and crosslink the relation between sub-branches of the hierarchy are identified. Concept maps in-clude two key elements: concepts and proposi-tions. Concept is a perceived regularity in events or objects designated by arbitrary label. A prop-osition is formed by connecting two concepts with a rational link.
Graphic organizers come in many dif-ferent forms, each one best suited to organizing a particular type of information. There are thir-teen main types of graphic organizers. First, a Descriptive or Thematic Map works well for mapping generic information, but particularly well for mapping hierarchical relationships. Second, organizing a hierarchical set of infor-mation, reflecting superordinate or subordinate elements, is made easier by constructing a Net-work Tree. Third, a Spider Map. When the in-formation relating to a main idea or theme does not fit into a hierarchy, a Spider Map can help with organization. Fourth, a problem and solu-tion map. This kind of map is used to show in-formation contains cause and effect problems and solutions. Fifth, a Problem-Solution Outline helps students to compare different solutions to a problem. Sixth, A Sequential Episodic Map is useful for mapping cause and effect. Seventh when cause-effect relationships are complex and non-redundant a Fishbone Map may be particu-larly useful. Eighth, a Comparative and Contras-tive Map can help students to compare and con-trast two concepts according to their features. Ninth, another way to compare concepts’ attrib-utes is to construct a Compare-Contrast Matrix. Tenth, Continuum Scale is effective for organiz-ing information along a dimension such as less to more, low to high, and few too many. Elev-enth, a Series of Events Chain can help students organize information according to various steps or stages. Twelfth, a Cycle Map is useful for or-ganizing information that is circular or cyclical,
with no absolute beginning or ending. Thir-teenth, a Human Interaction Outline is effective for organizing events in terms of a chain of ac-tion and reaction (especially useful in social sci-ences and humanities).
Graphic organizers have been applied in any subject areas, such as science, social stud-ies, language arts, and math. In these subject ar-eas, graphic organizers have been shown to have benefits that extend beyond their well-established effects on reading comprehension Graphic organizers related to operations such as mapping cause and effect, note taking, compar-ing and contrasting concepts, organizing prob-lems and solutions, and relating information to main ideas or themes can give advantages in learning process. Thus, there are three im-portant factors influencing the effectiveness of Graphic Organizers. First is grade level. Graphic Organizers cover all level in learning, from ele-mentary to university populations. The function is the same, yet the depth of the topic discussion is different. Second is point of implementation. Graphic organizers generate larger improve-ments in learning when used as a follow up to reading rather than a pre-reading activity. The last is instructional context Graphic Organizers. Instructional context concept suggests that graphic organizers can be effective learning tools when implemented within a proper and precise instructional context, especially an interactive approach involving teacher modeling, student-teacher discussion, and practice with reflection.
Graphic organizers can be thought as a procedure to measure a students’ declarative knowledge. Any assessments can be conceived as a combination of a task, a response format, and a scoring system. A task means to provide evidence of students’ knowledge structure. A scoring system means that learners’ graphic or-ganizers can be evaluated accurately and con-sistently.
METHODOLOGY
This study was conducted at the Eng-lish Teaching Study Program of the Faculty of Education and Teachers Training of the Chris-tian University of Indonesia in the even semester of 2011/2012 Academic Year. The participants were attendees of Reading II course. The re-search was conducted approximately 10 weekswith time allocation 1.5 hours in one ses-sion per week. The participants had mastered the basic reading comprehension skills, like iden-
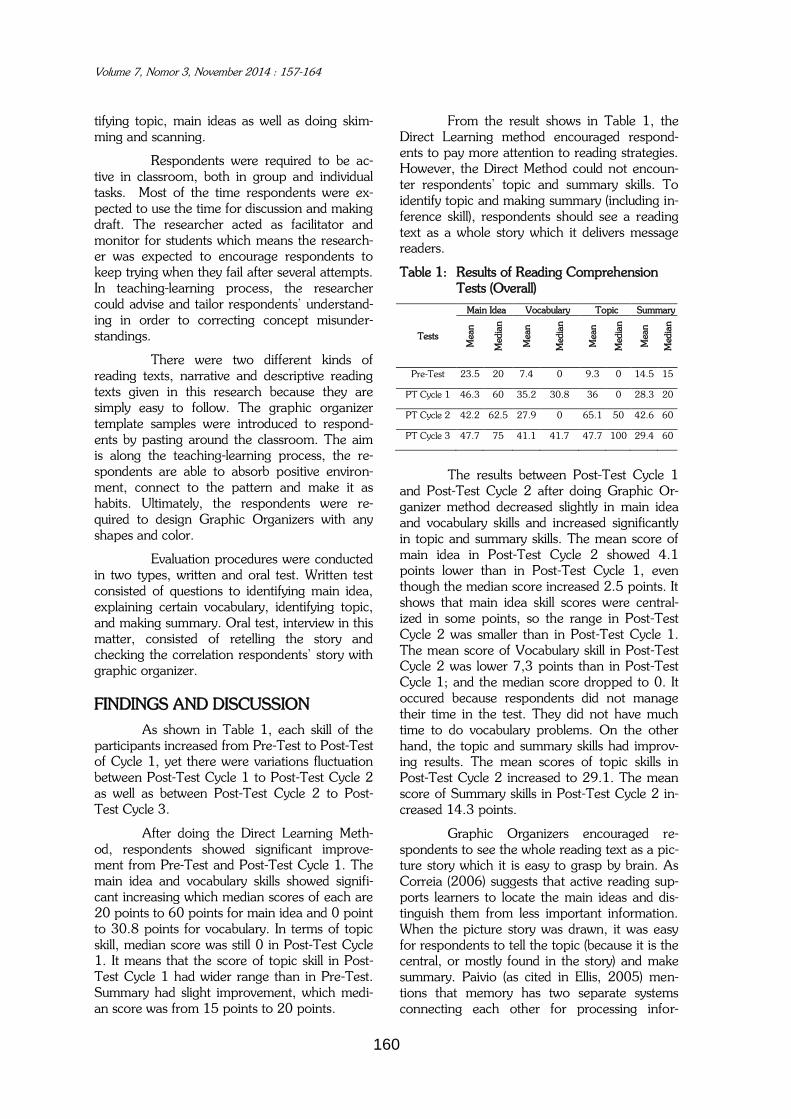
Volume 7, Nomor 3, November 2014 : 157-164
160
tifying topic, main ideas as well as doing skim-ming and scanning.
Respondents were required to be ac-tive in classroom, both in group and individual tasks. Most of the time respondents were ex-pected to use the time for discussion and making draft. The researcher acted as facilitator and monitor for students which means the research-er was expected to encourage respondents to keep trying when they fail after several attempts. In teaching-learning process, the researcher could advise and tailor respondents’ understand-ing in order to correcting concept misunder-standings.
There were two different kinds of reading texts, narrative and descriptive reading texts given in this research because they are simply easy to follow. The graphic organizer template samples were introduced to respond-ents by pasting around the classroom. The aim is along the teaching-learning process, the re-spondents are able to absorb positive environ-ment, connect to the pattern and make it as habits. Ultimately, the respondents were re-quired to design Graphic Organizers with any shapes and color.
Evaluation procedures were conducted in two types, written and oral test. Written test consisted of questions to identifying main idea, explaining certain vocabulary, identifying topic, and making summary. Oral test, interview in this matter, consisted of retelling the story and checking the correlation respondents’ story with graphic organizer.
FINDINGS AND DISCUSSION
As shown in Table 1, each skill of the participants increased from Pre-Test to Post-Test of Cycle 1, yet there were variations fluctuation between Post-Test Cycle 1 to Post-Test Cycle 2 as well as between Post-Test Cycle 2 to Post-Test Cycle 3.
After doing the Direct Learning Meth-od, respondents showed significant improve-ment from Pre-Test and Post-Test Cycle 1. The main idea and vocabulary skills showed signifi-cant increasing which median scores of each are 20 points to 60 points for main idea and 0 point to 30.8 points for vocabulary. In terms of topic skill, median score was still 0 in Post-Test Cycle 1. It means that the score of topic skill in Post-Test Cycle 1 had wider range than in Pre-Test. Summary had slight improvement, which medi-an score was from 15 points to 20 points.
From the result shows in Table 1, the Direct Learning method encouraged respond-ents to pay more attention to reading strategies. However, the Direct Method could not encoun-ter respondents' topic and summary skills. To identify topic and making summary (including in-ference skill), respondents should see a reading text as a whole story which it delivers message readers.
Table 1: Results of Reading Comprehension Tests (Overall)
Tests
Main Idea Vocabulary Topic Summary
Mean
Media
n
Mean
Media
n
Mean
Media
n
Mean
Media
n
Pre-Test 23.5 20 7.4 0 9.3 0 14.5 15
PT Cycle 1 46.3 60 35.2 30.8 36 0 28.3 20
PT Cycle 2 42.2 62.5 27.9 0 65.1 50 42.6 60
PT Cycle 3 47.7 75 41.1 41.7 47.7 100 29.4 60
The results between Post-Test Cycle 1 and Post-Test Cycle 2 after doing Graphic Or-ganizer method decreased slightly in main idea and vocabulary skills and increased significantly in topic and summary skills. The mean score of main idea in Post-Test Cycle 2 showed 4.1 points lower than in Post-Test Cycle 1, even though the median score increased 2.5 points. It shows that main idea skill scores were central-ized in some points, so the range in Post-Test Cycle 2 was smaller than in Post-Test Cycle 1. The mean score of Vocabulary skill in Post-Test Cycle 2 was lower 7,3 points than in Post-Test Cycle 1; and the median score dropped to 0. It occured because respondents did not manage their time in the test. They did not have much time to do vocabulary problems. On the other hand, the topic and summary skills had improv-ing results. The mean scores of topic skills in Post-Test Cycle 2 increased to 29.1. The mean score of Summary skills in Post-Test Cycle 2 in-creased 14.3 points.
Graphic Organizers encouraged re-spondents to see the whole reading text as a pic-ture story which it is easy to grasp by brain. As Correia (2006) suggests that active reading sup-ports learners to locate the main ideas and dis-tinguish them from less important information. When the picture story was drawn, it was easy for respondents to tell the topic (because it is the central, or mostly found in the story) and make summary. Paivio (as cited in Ellis, 2005) men-tions that memory has two separate systems connecting each other for processing infor-

Rumiris, Improving University Students’ Reading Comprehension Using Graphic Organizers
161
mation. One system is specialized in non-verbal imagery and the other one is specialized in deal-ing with language. Therefore, determining main idea and vocabulary should be supported by Graphic Organizers as long as respondents make no assumptions at all to the reading text. The ideas in reading text connect each other and are framed in a united non-verbal imagery; it is logic. The significant results are proved in topic and summarizing skills. Respondents ap-plied what Ellis (2005) suggests that Graphic Organizer helps learners to separate important information from less important and decrease the necessary semantic information.
It is inferred that someone's prior knowledge to certain topic could affect his judg-ment to see the reading text as information. As Guastello (2000) says that if prior knowledge is activated, the schema will provide a framework to which the new information can be attached and comprehension will be improved. In this re-search, learners had had prior knowledge about the topic when they did Pre-Test. Yet, they as-sumed the content of reading text too quickly which lead them to the wrong perception about the content of the text. So, it should be empha-sized that prior knowledge is not only about the topic itself, but included the interrelated topics. If learners have insufficient prior knowledge, guessing and making conclusion are not sug-gested. Learners should take the reading text as new information to enrich their knowledge.
Another reason is that time manage-ment. The respondents did not manage time well since each class got extra 20 minutes to fin-ish their work. They were really focused to make "great" Graphic Organizer rather than "commu-nicative" Graphic Organizer. As Ellis (2005) mentions that Graphic Organizer set the reading material in sophisticated organization which lead the content of reading is easy to understand. It can be concluded that learners were in the learn-ing process of improving the reading compre-hension.
Having Review session before Post-Test Cycle 3 showed another interesting result be-tween Post-Test Cycle 2 and Post-Test Cycle 3. The mean scores of main idea and vocabulary skills increased 5.5 points for Main Idea and 13.2 points for vocabulary. Yet, the declination can be seen in topic and summary skills. The mean scores of topic decreased 17.4 and of summary decreased 13.2 points.
In Post-Test Cycle 3, the researcher did not instruct respondents to use Graphic Organ-
izers as a tool to answer questions. The re-searcher facilitated some spaces for simple pic-tures if they wanted to use Graphic Organizers. The fluctuation scores could happen with several reasons. First, the respondents found the text seemed easier than before. It encouraged re-spondents to read attentively and answered main idea and vocabulary well. It also indicated that learners have sufficient prior knowledge of the topic. Second, the respondents using simple pictures or Graphic Organizers could improve their scores in all areas because they saw the whole picture well. Third, around 30% of re-spondents did not join in Review session and came in Post-Test Cycle 3. It was one of the ways for not reaching any improvement in an-swering questions. Fourth, around 40% re-spondents did not join the test, so there are score 0 influencing the calculation.
The researcher also did judgment through rubric of Tony Stead. Below are the re-sultsof Pre-Test, Post-Test Cycle 1, Post-Test Cycle 2 and Post-Test Cycle 3:
Table 2: Results of Reading Comprehension Using Rubric (Overall)
Tests
Literal Level Interpretive Level
Memory Translation Interpretation Application
Mean
Media
n
Mean
Media
n
Mean
Media
n
Mean
Media
n
Pre-Test 0.9 1 0.3 0 0.9 1 0.8 1
PT Cycle 1 1.6 2 0.6 1 1.1 1 1 1
PT Cycle 2 2.3 2 1.9 1 2 2 1.8 1
PT Cycle 3 1.9 3 1.5 0 1.4 2 1.5 2
The data in Table 2 above reveal posi-
tive improvement between the Pre-Test and Post-Test Cycle 1. All mean scores increased, yet not all median levels increased. The median levels of memory category and translation cate-gory increased one level; yet interpretation and application category stayed the same.
After doing the Direct Learning method, the respondents found determining main idea and vocabulary were easier to do. This affected respondents’ view to see the story clearer than before. So, they could recall the details of the story better. The respondents had not reached Interpretative Level yet, because they still saw the story of reading text as writing form. They found difficult to connect one paragraph to an-other as one whole story. The other factor which could increase their scores is the same reading text. They had certain way in retaining what they had seen before. This prior experi-
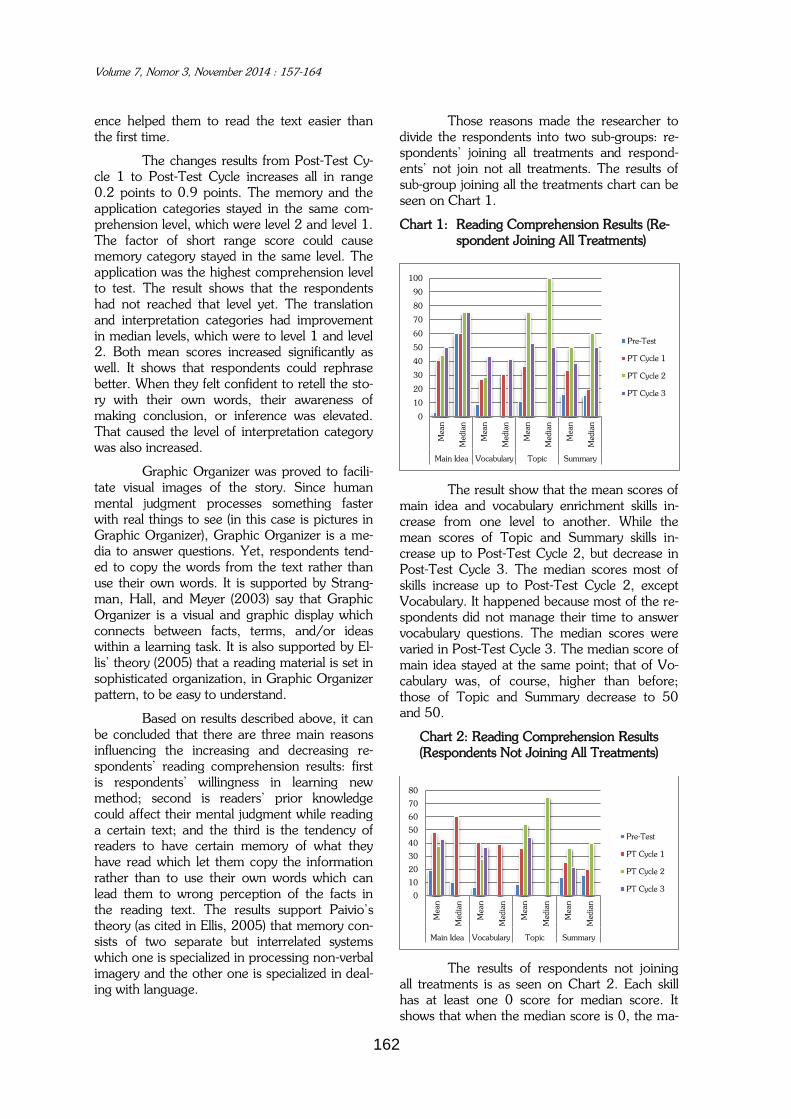
Volume 7, Nomor 3, November 2014 : 157-164
162
ence helped them to read the text easier than the first time.
The changes results from Post-Test Cy-cle 1 to Post-Test Cycle increases all in range 0.2 points to 0.9 points. The memory and the application categories stayed in the same com-prehension level, which were level 2 and level 1. The factor of short range score could cause memory category stayed in the same level. The application was the highest comprehension level to test. The result shows that the respondents had not reached that level yet. The translation and interpretation categories had improvement in median levels, which were to level 1 and level 2. Both mean scores increased significantly as well. It shows that respondents could rephrase better. When they felt confident to retell the sto-ry with their own words, their awareness of making conclusion, or inference was elevated. That caused the level of interpretation category was also increased.
Graphic Organizer was proved to facili-tate visual images of the story. Since human mental judgment processes something faster with real things to see (in this case is pictures in Graphic Organizer), Graphic Organizer is a me-dia to answer questions. Yet, respondents tend-ed to copy the words from the text rather than use their own words. It is supported by Strang-man, Hall, and Meyer (2003) say that Graphic Organizer is a visual and graphic display which connects between facts, terms, and/or ideas within a learning task. It is also supported by El-lis’ theory (2005) that a reading material is set in sophisticated organization, in Graphic Organizer pattern, to be easy to understand.
Based on results described above, it can be concluded that there are three main reasons influencing the increasing and decreasing re-spondents' reading comprehension results: first is respondents' willingness in learning new method; second is readers' prior knowledge could affect their mental judgment while reading a certain text; and the third is the tendency of readers to have certain memory of what they have read which let them copy the information rather than to use their own words which can lead them to wrong perception of the facts in the reading text. The results support Paivio’s theory (as cited in Ellis, 2005) that memory con-sists of two separate but interrelated systems which one is specialized in processing non-verbal imagery and the other one is specialized in deal-ing with language.
Those reasons made the researcher to divide the respondents into two sub-groups: re-spondents’ joining all treatments and respond-ents’ not join not all treatments. The results of sub-group joining all the treatments chart can be seen on Chart 1.
Chart 1: Reading Comprehension Results (Re-spondent Joining All Treatments)
The result show that the mean scores of main idea and vocabulary enrichment skills in-crease from one level to another. While the mean scores of Topic and Summary skills in-crease up to Post-Test Cycle 2, but decrease in Post-Test Cycle 3. The median scores most of skills increase up to Post-Test Cycle 2, except Vocabulary. It happened because most of the re-spondents did not manage their time to answer vocabulary questions. The median scores were varied in Post-Test Cycle 3. The median score of main idea stayed at the same point; that of Vo-cabulary was, of course, higher than before; those of Topic and Summary decrease to 50 and 50.
Chart 2: Reading Comprehension Results (Respondents Not Joining All Treatments)
The results of respondents not joining all treatments is as seen on Chart 2. Each skill has at least one 0 score for median score. It shows that when the median score is 0, the ma-
0
10
20
30
40
50
60
70
80
90
100
Mean
Media
n
Mean
Media
n
Mean
Media
n
Mean
Media
n
Main Idea Vocabulary Topic Summary
Pre-Test
PT Cycle 1
PT Cycle 2
PT Cycle 3
0
10
20
30
40
50
60
70
80
Mean
Media
n
Mean
Media
n
Mean
Media
n
Mean
Media
n
Main Idea Vocabulary Topic Summary
Pre-Test
PT Cycle 1
PT Cycle 2
PT Cycle 3
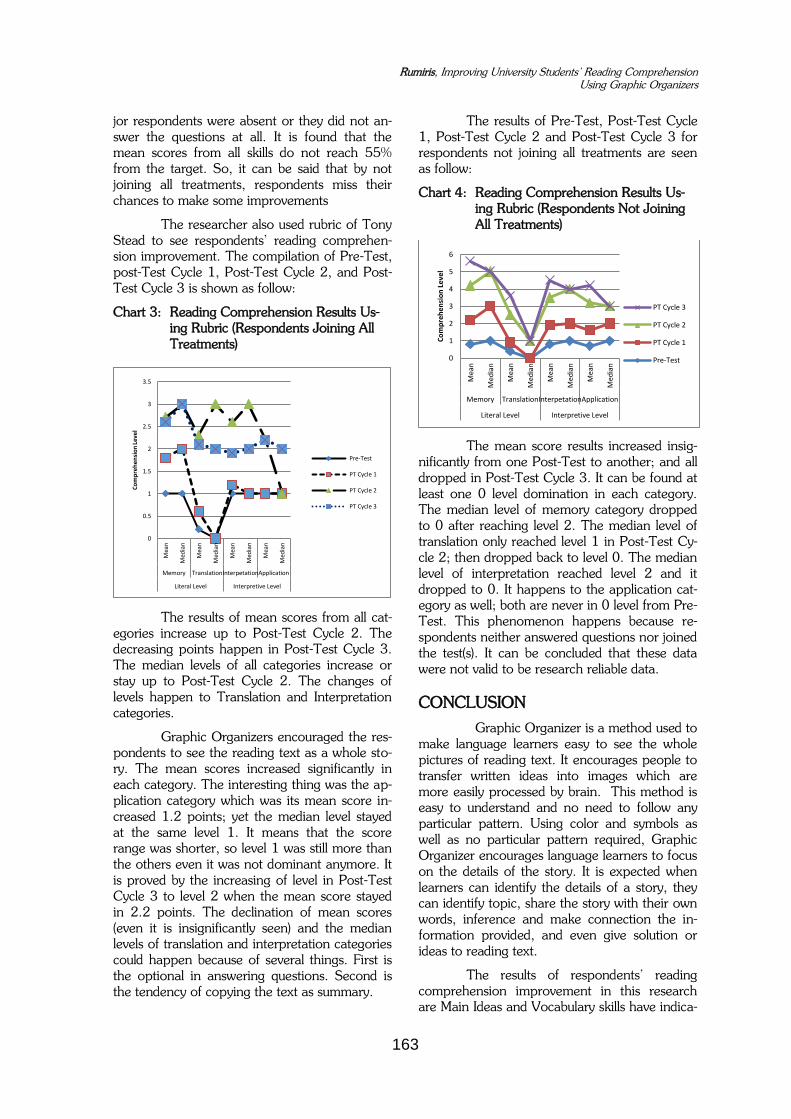
Rumiris, Improving University Students’ Reading Comprehension Using Graphic Organizers
163
jor respondents were absent or they did not an-swer the questions at all. It is found that the mean scores from all skills do not reach 55% from the target. So, it can be said that by not joining all treatments, respondents miss their chances to make some improvements
The researcher also used rubric of Tony Stead to see respondents' reading comprehen-sion improvement. The compilation of Pre-Test, post-Test Cycle 1, Post-Test Cycle 2, and Post-Test Cycle 3 is shown as follow:
Chart 3: Reading Comprehension Results Us-ing Rubric (Respondents Joining All Treatments)
The results of mean scores from all cat-egories increase up to Post-Test Cycle 2. The decreasing points happen in Post-Test Cycle 3. The median levels of all categories increase or stay up to Post-Test Cycle 2. The changes of levels happen to Translation and Interpretation categories.
Graphic Organizers encouraged the res-pondents to see the reading text as a whole sto-ry. The mean scores increased significantly in each category. The interesting thing was the ap-plication category which was its mean score in-creased 1.2 points; yet the median level stayed at the same level 1. It means that the score range was shorter, so level 1 was still more than the others even it was not dominant anymore. It is proved by the increasing of level in Post-Test Cycle 3 to level 2 when the mean score stayed in 2.2 points. The declination of mean scores (even it is insignificantly seen) and the median levels of translation and interpretation categories could happen because of several things. First is the optional in answering questions. Second is the tendency of copying the text as summary.
The results of Pre-Test, Post-Test Cycle 1, Post-Test Cycle 2 and Post-Test Cycle 3 for respondents not joining all treatments are seen as follow:
Chart 4: Reading Comprehension Results Us-ing Rubric (Respondents Not Joining All Treatments)
The mean score results increased insig-nificantly from one Post-Test to another; and all dropped in Post-Test Cycle 3. It can be found at least one 0 level domination in each category. The median level of memory category dropped to 0 after reaching level 2. The median level of translation only reached level 1 in Post-Test Cy-cle 2; then dropped back to level 0. The median level of interpretation reached level 2 and it dropped to 0. It happens to the application cat-egory as well; both are never in 0 level from Pre-Test. This phenomenon happens because re-spondents neither answered questions nor joined the test(s). It can be concluded that these data were not valid to be research reliable data.
CONCLUSION
Graphic Organizer is a method used to make language learners easy to see the whole pictures of reading text. It encourages people to transfer written ideas into images which are more easily processed by brain. This method is easy to understand and no need to follow any particular pattern. Using color and symbols as well as no particular pattern required, Graphic Organizer encourages language learners to focus on the details of the story. It is expected when learners can identify the details of a story, they can identify topic, share the story with their own words, inference and make connection the in-formation provided, and even give solution or ideas to reading text.
The results of respondents’ reading comprehension improvement in this research are Main Ideas and Vocabulary skills have indica-
0
0.5
1
1.5
2
2.5
3
3.5
Mea
n
Med
ian
Mea
n
Med
ian
Mea
n
Med
ian
Mea
n
Med
ian
Memory TranslationInterpetationApplication
Literal Level Interpretive Level
Co
mp
reh
en
sio
n L
eve
l
Pre-Test
PT Cycle 1
PT Cycle 2
PT Cycle 3
0
1
2
3
4
5
6
Mea
n
Med
ian
Mea
n
Med
ian
Mea
n
Med
ian
Mea
n
Med
ian
Memory TranslationInterpetationApplication
Literal Level Interpretive Level
Co
mp
reh
ensi
on
Lev
el
PT Cycle 3
PT Cycle 2
PT Cycle 1
Pre-Test
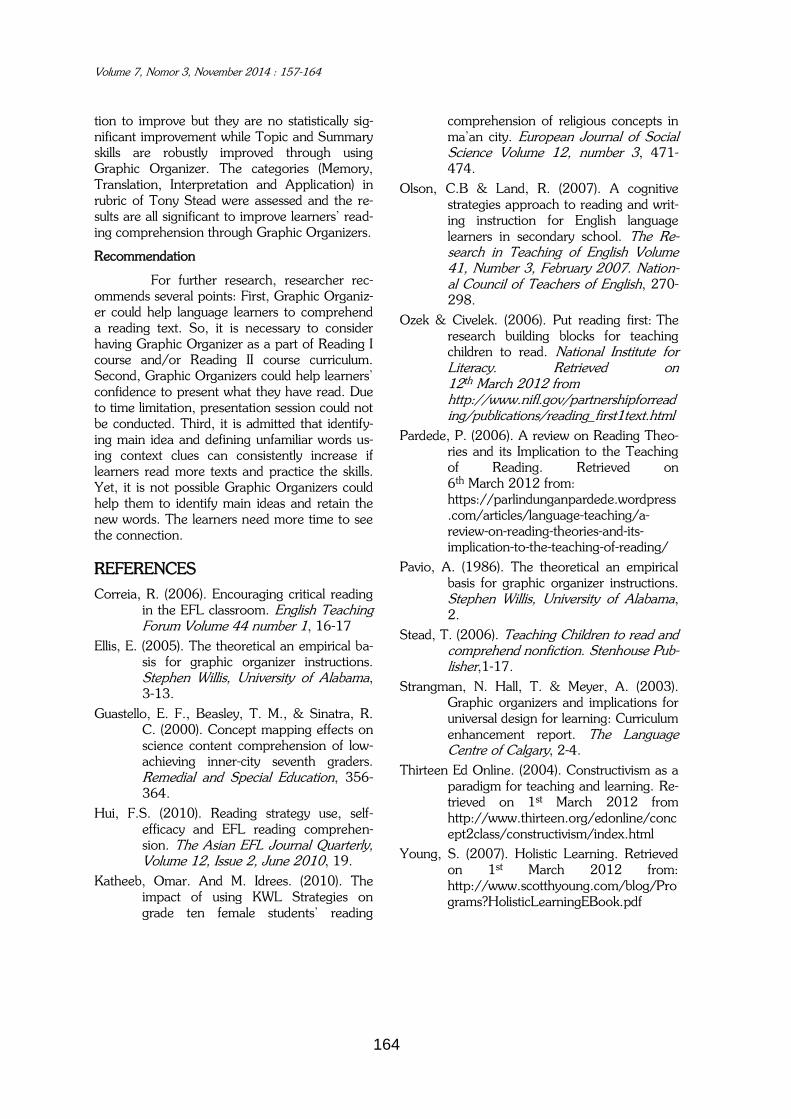
Volume 7, Nomor 3, November 2014 : 157-164
164
tion to improve but they are no statistically sig-nificant improvement while Topic and Summary skills are robustly improved through using Graphic Organizer. The categories (Memory, Translation, Interpretation and Application) in rubric of Tony Stead were assessed and the re-sults are all significant to improve learners’ read-ing comprehension through Graphic Organizers.
Recommendation
For further research, researcher rec-ommends several points: First, Graphic Organiz-er could help language learners to comprehend a reading text. So, it is necessary to consider having Graphic Organizer as a part of Reading I course and/or Reading II course curriculum. Second, Graphic Organizers could help learners’ confidence to present what they have read. Due to time limitation, presentation session could not be conducted. Third, it is admitted that identify-ing main idea and defining unfamiliar words us-ing context clues can consistently increase if learners read more texts and practice the skills. Yet, it is not possible Graphic Organizers could help them to identify main ideas and retain the new words. The learners need more time to see the connection.
REFERENCES
Correia, R. (2006). Encouraging critical reading in the EFL classroom. English Teaching Forum Volume 44 number 1, 16-17
Ellis, E. (2005). The theoretical an empirical ba-sis for graphic organizer instructions. Stephen Willis, University of Alabama, 3-13.
Guastello, E. F., Beasley, T. M., & Sinatra, R. C. (2000). Concept mapping effects on science content comprehension of low-achieving inner-city seventh graders. Remedial and Special Education, 356-364.
Hui, F.S. (2010). Reading strategy use, self-efficacy and EFL reading comprehen-sion. The Asian EFL Journal Quarterly, Volume 12, Issue 2, June 2010, 19.
Katheeb, Omar. And M. Idrees. (2010). The impact of using KWL Strategies on grade ten female students’ reading
comprehension of religious concepts in ma’an city. European Journal of Social Science Volume 12, number 3, 471-474.
Olson, C.B & Land, R. (2007). A cognitive strategies approach to reading and writ-ing instruction for English language learners in secondary school. The Re-search in Teaching of English Volume 41, Number 3, February 2007. Nation-al Council of Teachers of English, 270-298.
Ozek & Civelek. (2006). Put reading first: The research building blocks for teaching children to read. National Institute for Literacy. Retrieved on 12th March 2012 from http://www.nifl.gov/partnershipforreading/publications/reading_first1text.html
Pardede, P. (2006). A review on Reading Theo-ries and its Implication to the Teaching of Reading. Retrieved on 6th March 2012 from: https://parlindunganpardede.wordpress.com/articles/language-teaching/a-review-on-reading-theories-and-its-implication-to-the-teaching-of-reading/
Pavio, A. (1986). The theoretical an empirical basis for graphic organizer instructions. Stephen Willis, University of Alabama, 2.
Stead, T. (2006). Teaching Children to read and comprehend nonfiction. Stenhouse Pub-lisher,1-17.
Strangman, N. Hall, T. & Meyer, A. (2003). Graphic organizers and implications for universal design for learning: Curriculum enhancement report. The Language Centre of Calgary, 2-4.
Thirteen Ed Online. (2004). Constructivism as a paradigm for teaching and learning. Re-trieved on 1st March 2012 from http://www.thirteen.org/edonline/concept2class/constructivism/index.html
Young, S. (2007). Holistic Learning. Retrieved on 1st March 2012 from: http://www.scotthyoung.com/blog/Programs?HolisticLearningEBook.pdf
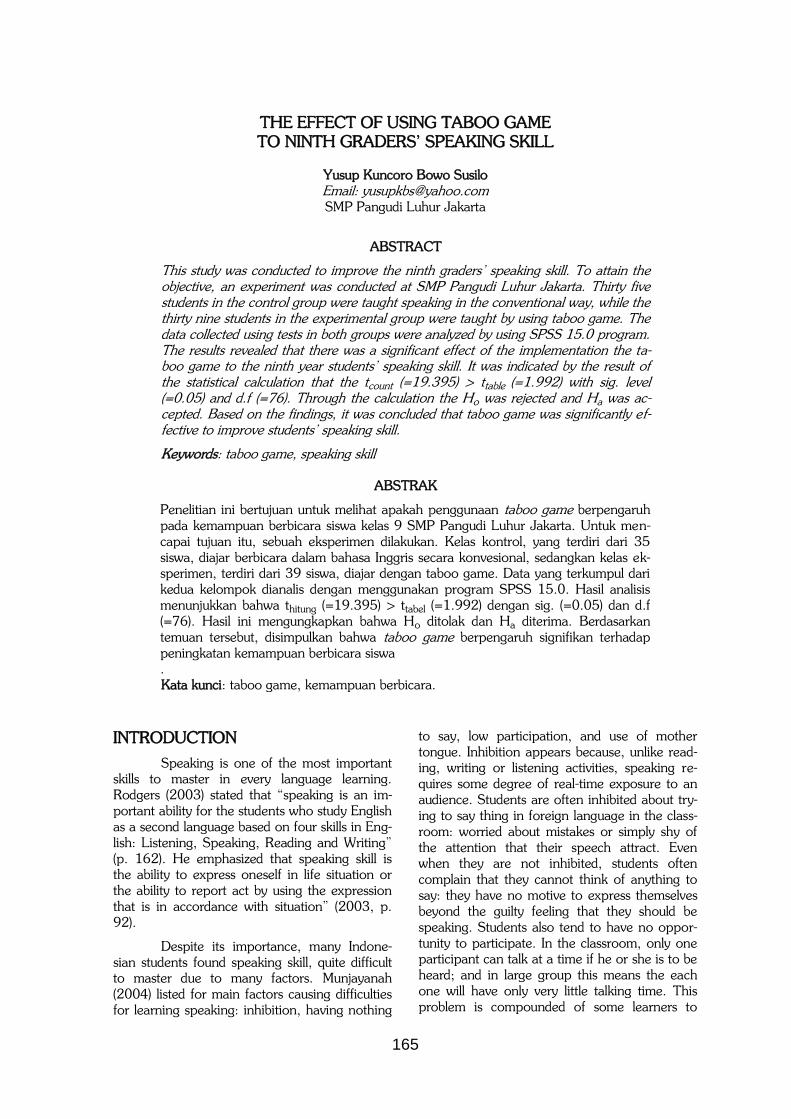
165
THE EFFECT OF USING TABOO GAME TO NINTH GRADERS’ SPEAKING SKILL
Yusup Kuncoro Bowo Susilo Email: [email protected] SMP Pangudi Luhur Jakarta
ABSTRACT
This study was conducted to improve the ninth graders’ speaking skill. To attain the objective, an experiment was conducted at SMP Pangudi Luhur Jakarta. Thirty five students in the control group were taught speaking in the conventional way, while the thirty nine students in the experimental group were taught by using taboo game. The data collected using tests in both groups were analyzed by using SPSS 15.0 program. The results revealed that there was a significant effect of the implementation the ta-boo game to the ninth year students’ speaking skill. It was indicated by the result of the statistical calculation that the tcount (=19.395) > ttable (=1.992) with sig. level (=0.05) and d.f (=76). Through the calculation the Ho was rejected and Ha was ac-cepted. Based on the findings, it was concluded that taboo game was significantly ef-fective to improve students’ speaking skill.
Keywords: taboo game, speaking skill
ABSTRAK
Penelitian ini bertujuan untuk melihat apakah penggunaan taboo game berpengaruh pada kemampuan berbicara siswa kelas 9 SMP Pangudi Luhur Jakarta. Untuk men-capai tujuan itu, sebuah eksperimen dilakukan. Kelas kontrol, yang terdiri dari 35 siswa, diajar berbicara dalam bahasa Inggris secara konvesional, sedangkan kelas ek-sperimen, terdiri dari 39 siswa, diajar dengan taboo game. Data yang terkumpul dari kedua kelompok dianalis dengan menggunakan program SPSS 15.0. Hasil analisis menunjukkan bahwa thitung (=19.395) > ttabel (=1.992) dengan sig. (=0.05) dan d.f (=76). Hasil ini mengungkapkan bahwa Ho ditolak dan Ha diterima. Berdasarkan temuan tersebut, disimpulkan bahwa taboo game berpengaruh signifikan terhadap peningkatan kemampuan berbicara siswa . Kata kunci: taboo game, kemampuan berbicara.
INTRODUCTION
Speaking is one of the most important skills to master in every language learning. Rodgers (2003) stated that “speaking is an im-portant ability for the students who study English as a second language based on four skills in Eng-lish: Listening, Speaking, Reading and Writing” (p. 162). He emphasized that speaking skill is the ability to express oneself in life situation or the ability to report act by using the expression that is in accordance with situation” (2003, p. 92).
Despite its importance, many Indone-sian students found speaking skill, quite difficult to master due to many factors. Munjayanah (2004) listed for main factors causing difficulties for learning speaking: inhibition, having nothing
to say, low participation, and use of mother tongue. Inhibition appears because, unlike read-ing, writing or listening activities, speaking re-quires some degree of real-time exposure to an audience. Students are often inhibited about try-ing to say thing in foreign language in the class-room: worried about mistakes or simply shy of the attention that their speech attract. Even when they are not inhibited, students often complain that they cannot think of anything to say: they have no motive to express themselves beyond the guilty feeling that they should be speaking. Students also tend to have no oppor-tunity to participate. In the classroom, only one participant can talk at a time if he or she is to be heard; and in large group this means the each one will have only very little talking time. This problem is compounded of some learners to

Volume 7, Nomor 3, November 2014 : 165-170
166
dominate, while other speaks very little or not a tall. Finally, it is easier for the student to use their mother tongue in their class because it looks naturally. Therefore, most of the students are not disciplined in using the target language in the learning process.
Another classification of problems in learning speaking was proposed by Mulia (2008) who emphasized that the most common prob-lem is a lack of practice. Other factors that influ-ence speaking problems are: student’s lack of vocabulary, students rarely practice to use Eng-lish to communicate, low confidence to speak English in class, rare participation in conversa-tional classes, and disinterest in the material. Their low mastery of grammar makes it hard for them to produce grammatically correct sentenc-es.
Some other problems faced by students in learning speaking are difficulty in pronouncing words correctly, low ability in grammar, and low motivation. They rarely practice to use any Eng-lish words in the class since they have difficulty in pronouncing words correctly. The fact that English is not used in their daily life contributes to their low motivation to interact using English.
Last but not least, another factor that hinder in the learning process is the way of teaching. Many teachers just use conventional way of teaching with monotonous activity, such as doing exercises in the textbook, completing the blank dialogues, rearranging jumbled dia-logues. As a consequence, the students are less motivated and getting bored. Moreover, the there is so limited time to perform dialogues so that the students do not have appropriate op-portunity to actively use English in the class-room.
To solve the problem, it is necessary to provide the students interesting activities that fa-cilitate them to develop speaking skills in an in-teractive way. One form of such activities is game. Some studies concerning the use of games in language learning revealed that such activities are effective to help students practice to master speaking. Mariyana’s (1999) study showed that by using games, the students be-came more interested, actively involved and mo-tivated in the learning activities. Games also help the students in building a good relationship with their friends as well as increasing their achieve-ment in learning English.
Nurisnaini (2000) found out that games are effective strategies in improving the students’
participation in the classroom activities. Fur-thermore, Huyen and Nga (2003) claimed that games have been shown to have more ad-vantages and effectiveness in learning speaking in various ways. First, games bring relaxation and fun for the students, thus help them to learn and retain new words more easily. Second, games usually involve friendly competition and they keep learners interested in the activities. These create the motivation for learners of Eng-lish to get involved and participated actively in the learning activities. Third, games bring real world context into the classroom and enhance students in using English language in a flexible and communicative way.
Teaching speaking should be more in-teractive to keep students interested in the les-son. Games can be used to practice speaking in the classroom. Games are effective teaching tools which create opportunities for students to communicate in
a relaxed, friendly, and cooperative environ-ment. According to Cross (1992) and Martin (2000), games reduce tension by adding fun and humor to lessons, and they add an element of competitiveness that motivates students to par-ticipate. Games encourage learners to interact, cooperate, to be creative and spontaneous in us-ing the language in a meaningful way. Learners want to take part in activities. In order for them to take part they must be able to understand and communicate in the target language. Games also encourage learners to keep interested in the work and a teacher can use them to create con-texts in which the language is useful. Cross (1992) argued that when students are absorbed by games, they acquire the essential vocabulary, grammar, and other aspects of English uncon-sciously because they are focused on the mes-sage and not the language itself (as cited in Cer-vantes, 2009). Importantly, games provide a perfect opportunity for the teacher to take the backseat and let the students do the talking.
Realizing the effectiveness of game to improve students’ speaking skill, the researcher in this current study would like to see whether taboo game (a word guessing game made by the teacher where the partners guess the keyword on the card without using the keyword itself or additional words (taboo words) listed on the card) as complementary teaching activity significantly improve the ninth graders’ speaking skill. The study addressed the following problem state-ment: Is there any significant effect of using ta-boo game to the ninth graders’ speaking skill at
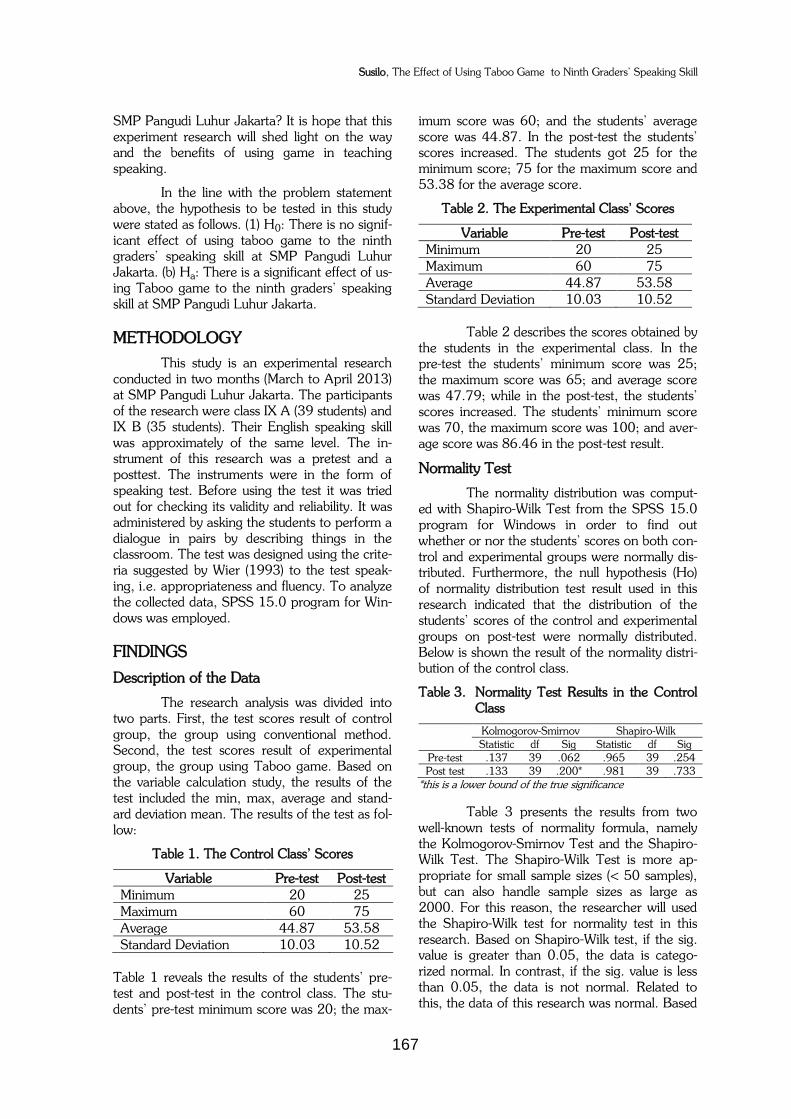
Susilo, The Effect of Using Taboo Game to Ninth Graders’ Speaking Skill
167
SMP Pangudi Luhur Jakarta? It is hope that this experiment research will shed light on the way and the benefits of using game in teaching speaking.
In the line with the problem statement above, the hypothesis to be tested in this study were stated as follows. (1) H0: There is no signif-icant effect of using taboo game to the ninth graders’ speaking skill at SMP Pangudi Luhur Jakarta. (b) Ha: There is a significant effect of us-ing Taboo game to the ninth graders’ speaking skill at SMP Pangudi Luhur Jakarta.
METHODOLOGY
This study is an experimental research conducted in two months (March to April 2013) at SMP Pangudi Luhur Jakarta. The participants of the research were class IX A (39 students) and IX B (35 students). Their English speaking skill was approximately of the same level. The in-strument of this research was a pretest and a posttest. The instruments were in the form of speaking test. Before using the test it was tried out for checking its validity and reliability. It was administered by asking the students to perform a dialogue in pairs by describing things in the classroom. The test was designed using the crite-ria suggested by Wier (1993) to the test speak-ing, i.e. appropriateness and fluency. To analyze the collected data, SPSS 15.0 program for Win-dows was employed.
FINDINGS
Description of the Data
The research analysis was divided into two parts. First, the test scores result of control group, the group using conventional method. Second, the test scores result of experimental group, the group using Taboo game. Based on the variable calculation study, the results of the test included the min, max, average and stand-ard deviation mean. The results of the test as fol-low:
Table 1. The Control Class’ Scores
Variable Pre-test Post-test
Minimum 20 25
Maximum 60 75
Average 44.87 53.58
Standard Deviation 10.03 10.52
Table 1 reveals the results of the students’ pre-test and post-test in the control class. The stu-dents’ pre-test minimum score was 20; the max-
imum score was 60; and the students’ average score was 44.87. In the post-test the students’ scores increased. The students got 25 for the minimum score; 75 for the maximum score and 53.38 for the average score.
Table 2. The Experimental Class’ Scores
Variable Pre-test Post-test
Minimum 20 25
Maximum 60 75
Average 44.87 53.58
Standard Deviation 10.03 10.52
Table 2 describes the scores obtained by
the students in the experimental class. In the pre-test the students’ minimum score was 25; the maximum score was 65; and average score was 47.79; while in the post-test, the students’ scores increased. The students’ minimum score was 70, the maximum score was 100; and aver-age score was 86.46 in the post-test result.
Normality Test
The normality distribution was comput-ed with Shapiro-Wilk Test from the SPSS 15.0 program for Windows in order to find out whether or nor the students’ scores on both con-trol and experimental groups were normally dis-tributed. Furthermore, the null hypothesis (Ho) of normality distribution test result used in this research indicated that the distribution of the students’ scores of the control and experimental groups on post-test were normally distributed. Below is shown the result of the normality distri-bution of the control class.
Table 3. Normality Test Results in the Control Class
Kolmogorov-Smirnov Shapiro-Wilk
Statistic df Sig Statistic df Sig
Pre-test .137 39 .062 .965 39 .254
Post test .133 39 .200* .981 39 .733
*this is a lower bound of the true significance
Table 3 presents the results from two well-known tests of normality formula, namely the Kolmogorov-Smirnov Test and the Shapiro-Wilk Test. The Shapiro-Wilk Test is more ap-propriate for small sample sizes (< 50 samples), but can also handle sample sizes as large as 2000. For this reason, the researcher will used the Shapiro-Wilk test for normality test in this research. Based on Shapiro-Wilk test, if the sig. value is greater than 0.05, the data is catego-rized normal. In contrast, if the sig. value is less than 0.05, the data is not normal. Related to this, the data of this research was normal. Based
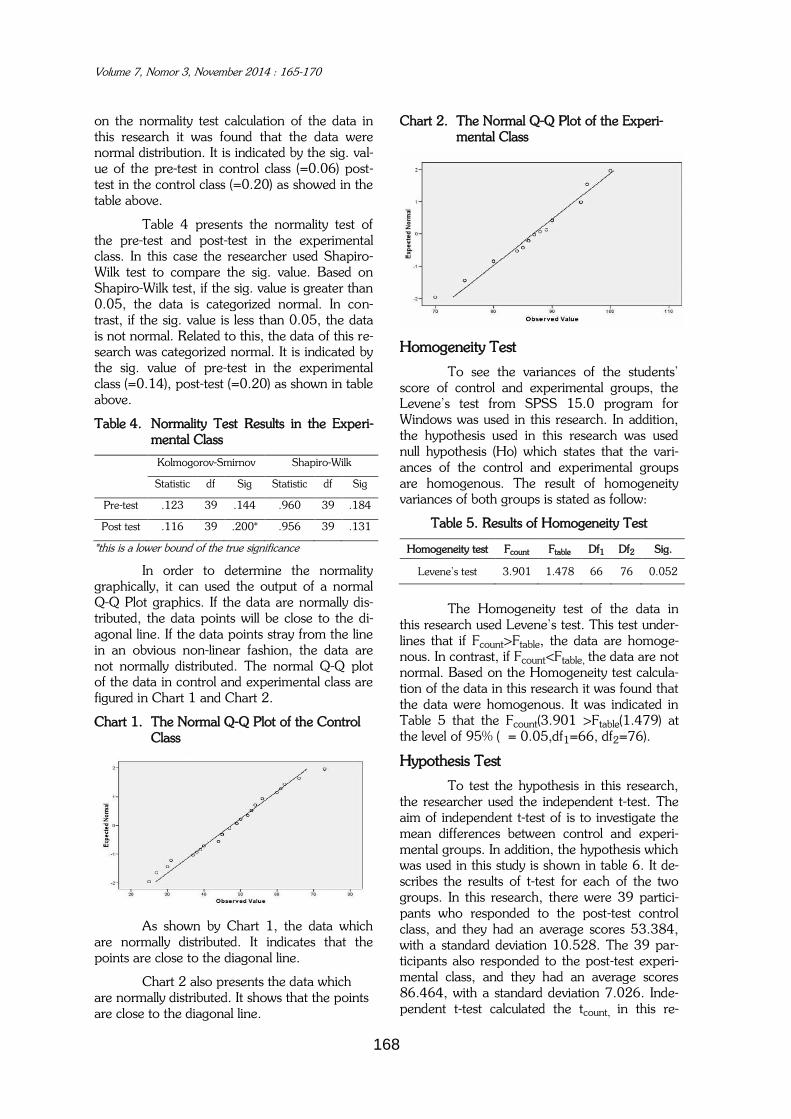
Volume 7, Nomor 3, November 2014 : 165-170
168
on the normality test calculation of the data in this research it was found that the data were normal distribution. It is indicated by the sig. val-ue of the pre-test in control class (=0.06) post-test in the control class (=0.20) as showed in the table above.
Table 4 presents the normality test of the pre-test and post-test in the experimental class. In this case the researcher used Shapiro-Wilk test to compare the sig. value. Based on Shapiro-Wilk test, if the sig. value is greater than 0.05, the data is categorized normal. In con-trast, if the sig. value is less than 0.05, the data is not normal. Related to this, the data of this re-search was categorized normal. It is indicated by the sig. value of pre-test in the experimental class (=0.14), post-test (=0.20) as shown in table above.
Table 4. Normality Test Results in the Experi-mental Class
Kolmogorov-Smirnov Shapiro-Wilk
Statistic df Sig Statistic df Sig
Pre-test .123 39 .144 .960 39 .184
Post test .116 39 .200* .956 39 .131
*this is a lower bound of the true significance
In order to determine the normality graphically, it can used the output of a normal Q-Q Plot graphics. If the data are normally dis-tributed, the data points will be close to the di-agonal line. If the data points stray from the line in an obvious non-linear fashion, the data are not normally distributed. The normal Q-Q plot of the data in control and experimental class are figured in Chart 1 and Chart 2.
Chart 1. The Normal Q-Q Plot of the Control Class
As shown by Chart 1, the data which are normally distributed. It indicates that the points are close to the diagonal line.
Chart 2 also presents the data which are normally distributed. It shows that the points are close to the diagonal line.
Chart 2. The Normal Q-Q Plot of the Experi-mental Class
Homogeneity Test
To see the variances of the students’ score of control and experimental groups, the Levene’s test from SPSS 15.0 program for Windows was used in this research. In addition, the hypothesis used in this research was used null hypothesis (Ho) which states that the vari-ances of the control and experimental groups are homogenous. The result of homogeneity variances of both groups is stated as follow:
Table 5. Results of Homogeneity Test
Homogeneity test Fcount Ftable Df1 Df2 Sig.
Levene's test 3.901 1.478 66 76 0.052
The Homogeneity test of the data in
this research used Levene’s test. This test under-lines that if Fcount>Ftable, the data are homoge-nous. In contrast, if Fcount<Ftable, the data are not normal. Based on the Homogeneity test calcula-tion of the data in this research it was found that the data were homogenous. It was indicated in Table 5 that the Fcount(3.901 >Ftable(1.479) at the level of 95% (α = 0.05,df1=66, df2=76).
Hypothesis Test
To test the hypothesis in this research, the researcher used the independent t-test. The aim of independent t-test of is to investigate the mean differences between control and experi-mental groups. In addition, the hypothesis which was used in this study is shown in table 6. It de-scribes the results of t-test for each of the two groups. In this research, there were 39 partici-pants who responded to the post-test control class, and they had an average scores 53.384, with a standard deviation 10.528. The 39 par-ticipants also responded to the post-test experi-mental class, and they had an average scores 86.464, with a standard deviation 7.026. Inde-pendent t-test calculated the tcount, in this re-
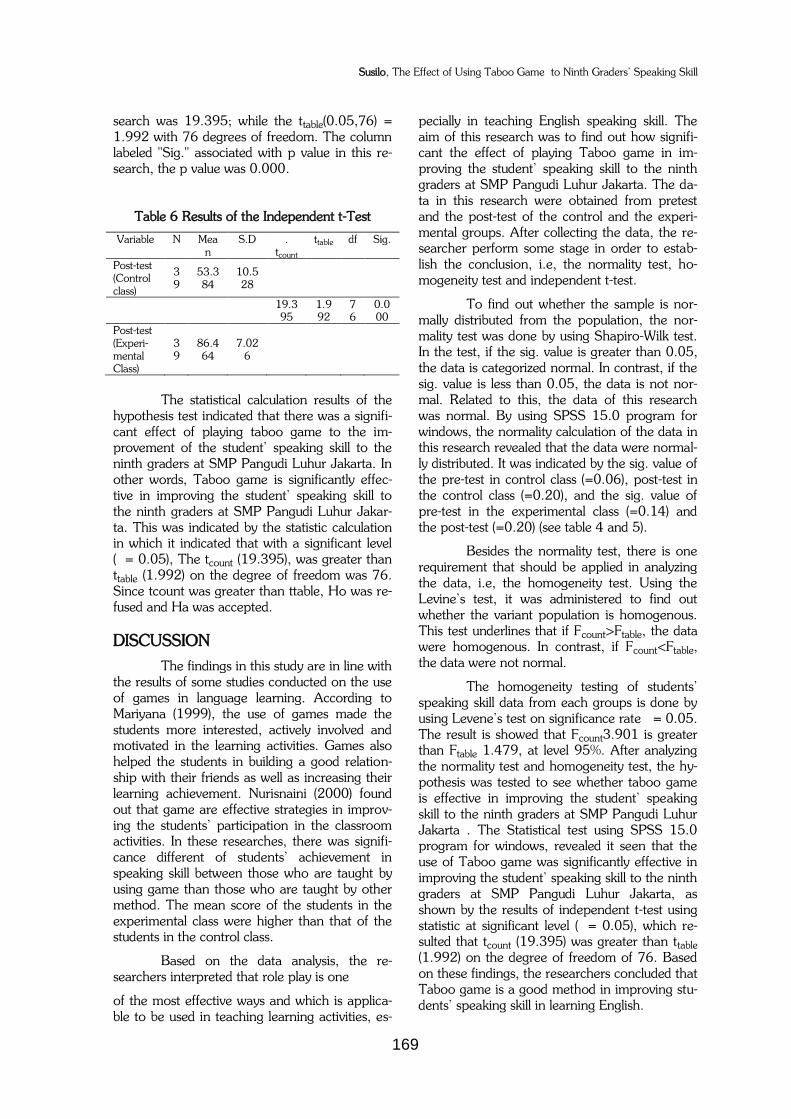
Susilo, The Effect of Using Taboo Game to Ninth Graders’ Speaking Skill
169
search was 19.395; while the ttable(0.05,76) = 1.992 with 76 degrees of freedom. The column labeled "Sig." associated with p value in this re-search, the p value was 0.000.
Table 6 Results of the Independent t-Test
Variable N Mean
S.D . tcount
ttable df Sig.
Post-test (Control class)
39
53.384
10.528
19.395
1.992
76
0.000
Post-test (Experi-mental Class)
39
86.464
7.026
The statistical calculation results of the
hypothesis test indicated that there was a signifi-cant effect of playing taboo game to the im-provement of the student’ speaking skill to the ninth graders at SMP Pangudi Luhur Jakarta. In other words, Taboo game is significantly effec-tive in improving the student’ speaking skill to the ninth graders at SMP Pangudi Luhur Jakar-ta. This was indicated by the statistic calculation in which it indicated that with a significant level (α = 0.05), The tcount (19.395), was greater than ttable (1.992) on the degree of freedom was 76. Since tcount was greater than ttable, Ho was re-fused and Ha was accepted.
DISCUSSION
The findings in this study are in line with the results of some studies conducted on the use of games in language learning. According to Mariyana (1999), the use of games made the students more interested, actively involved and motivated in the learning activities. Games also helped the students in building a good relation-ship with their friends as well as increasing their learning achievement. Nurisnaini (2000) found out that game are effective strategies in improv-ing the students’ participation in the classroom activities. In these researches, there was signifi-cance different of students’ achievement in speaking skill between those who are taught by using game than those who are taught by other method. The mean score of the students in the experimental class were higher than that of the students in the control class.
Based on the data analysis, the re-searchers interpreted that role play is one
of the most effective ways and which is applica-ble to be used in teaching learning activities, es-
pecially in teaching English speaking skill. The aim of this research was to find out how signifi-cant the effect of playing Taboo game in im-proving the student’ speaking skill to the ninth graders at SMP Pangudi Luhur Jakarta. The da-ta in this research were obtained from pretest and the post-test of the control and the experi-mental groups. After collecting the data, the re-searcher perform some stage in order to estab-lish the conclusion, i.e, the normality test, ho-mogeneity test and independent t-test.
To find out whether the sample is nor-mally distributed from the population, the nor-mality test was done by using Shapiro-Wilk test. In the test, if the sig. value is greater than 0.05, the data is categorized normal. In contrast, if the sig. value is less than 0.05, the data is not nor-mal. Related to this, the data of this research was normal. By using SPSS 15.0 program for windows, the normality calculation of the data in this research revealed that the data were normal-ly distributed. It was indicated by the sig. value of the pre-test in control class (=0.06), post-test in the control class (=0.20), and the sig. value of pre-test in the experimental class (=0.14) and the post-test (=0.20) (see table 4 and 5).
Besides the normality test, there is one requirement that should be applied in analyzing the data, i.e, the homogeneity test. Using the Levine’s test, it was administered to find out whether the variant population is homogenous. This test underlines that if Fcount>Ftable, the data were homogenous. In contrast, if Fcount<Ftable, the data were not normal.
The homogeneity testing of students’ speaking skill data from each groups is done by using Levene’s test on significance rate α = 0.05. The result is showed that Fcount3.901 is greater than Ftable 1.479, at level 95%. After analyzing the normality test and homogeneity test, the hy-pothesis was tested to see whether taboo game is effective in improving the student’ speaking skill to the ninth graders at SMP Pangudi Luhur Jakarta . The Statistical test using SPSS 15.0 program for windows, revealed it seen that the use of Taboo game was significantly effective in improving the student’ speaking skill to the ninth graders at SMP Pangudi Luhur Jakarta, as shown by the results of independent t-test using statistic at significant level (α = 0.05), which re-sulted that tcount (19.395) was greater than ttable (1.992) on the degree of freedom of 76. Based on these findings, the researchers concluded that Taboo game is a good method in improving stu-dents’ speaking skill in learning English.
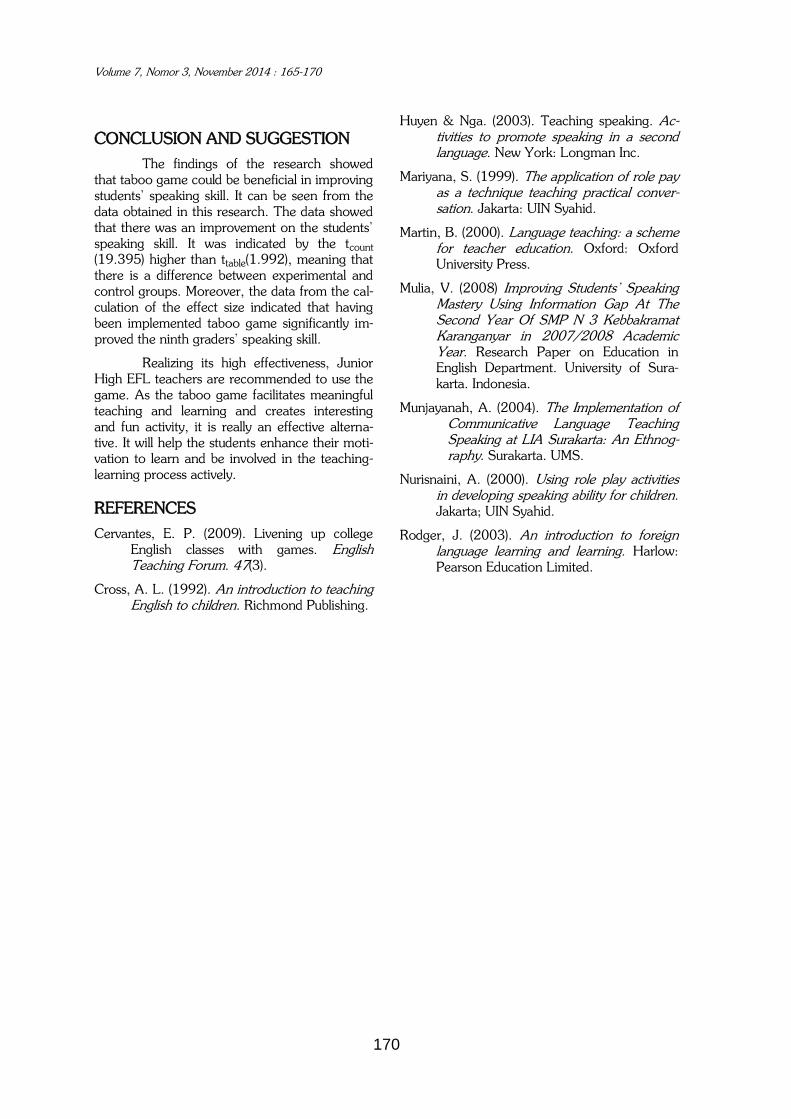
Volume 7, Nomor 3, November 2014 : 165-170
170
CONCLUSION AND SUGGESTION
The findings of the research showed that taboo game could be beneficial in improving students’ speaking skill. It can be seen from the data obtained in this research. The data showed that there was an improvement on the students’ speaking skill. It was indicated by the tcount (19.395) higher than ttable(1.992), meaning that there is a difference between experimental and control groups. Moreover, the data from the cal-culation of the effect size indicated that having been implemented taboo game significantly im-proved the ninth graders’ speaking skill.
Realizing its high effectiveness, Junior High EFL teachers are recommended to use the game. As the taboo game facilitates meaningful teaching and learning and creates interesting and fun activity, it is really an effective alterna-tive. It will help the students enhance their moti-vation to learn and be involved in the teaching-learning process actively.
REFERENCES
Cervantes, E. P. (2009). Livening up college English classes with games. English Teaching Forum. 47(3).
Cross, A. L. (1992). An introduction to teaching English to children. Richmond Publishing.
Huyen & Nga. (2003). Teaching speaking. Ac-tivities to promote speaking in a second language. New York: Longman Inc.
Mariyana, S. (1999). The application of role pay as a technique teaching practical conver-sation. Jakarta: UIN Syahid.
Martin, B. (2000). Language teaching: a scheme for teacher education. Oxford: Oxford University Press.
Mulia, V. (2008) Improving Students’ Speaking Mastery Using Information Gap At The Second Year Of SMP N 3 Kebbakramat Karanganyar in 2007/2008 Academic Year. Research Paper on Education in English Department. University of Sura-karta. Indonesia.
Munjayanah, A. (2004). The Implementation of Communicative Language Teaching Speaking at LIA Surakarta: An Ethnog-raphy. Surakarta. UMS.
Nurisnaini, A. (2000). Using role play activities in developing speaking ability for children. Jakarta; UIN Syahid.
Rodger, J. (2003). An introduction to foreign language learning and learning. Harlow: Pearson Education Limited.
171
NATIVE ENGLISH SPEAKER TEACHERS (NESTS) AND NON-NATIVE ENGLISH SPEAKER TEACHERS (NNESTS)
IN INDONESIA: PREFERENCE AND DILEMMA
Kartika Septarini [email protected]
Monash University
ABSTRACT
Issues about native English speaker teachers (NESTs) versus non-native English speaker teachers (NNESTs) have become a never ending debate. Whether native English speak-er teachers or non-native English speaker teachers who are more appropriate to teach English in outer or expanding circle countries have been discussed and researched by some scholars. This paper discusses about people’s preference towards both of them by investigating previous research about people’s perception towards native English speaker teachers and non-native English speaker teachers. This paper also explores another issue arising from the dichotomy of native and non-native i.e. Whose English and what English should be taught in Indonesia. Whether English Native or other varie-ties of English is best taught in Indonesia.
Keywords: Native English Teachers, Non-Native English Teachers, World Englishes.
ABSTRACT
Isu-isu yang terkait dengan guru bahasa Inggris penutur asli (NESTs) dan guru bahasa Inggris yang bukan penutur asli (NNESTs) merupakan salah satu topik yang sudah lama dan tidak pernah berhenti diperdabatkan. Persoalan tentang siapa, NESTs atau NNESTs, atau keduanya, yang lebih sesuai untuk mengajarkan bahasa Inggris di negara yang baha-sa Inggris bukan sebagai bahasa pertama telah banyak diteliti dan dibahas. Makalah ini membahas preferensi terhadap NESTs atau NNESTs melalui telaah pada hasil-hasil penelitian tentang persepsi terhadap kedua kelompok guru bahasa Inggris tersebut. Ma-kalah ini juga menyoroti isu lain yang timbul dari pendikotomian guru penutur asli dan bukan penutur asli, yaitu bahasa Inggris siapa dan bahasa Inggris yang mana yang harus diajarkan di Indonesia—Bahasa Inggris asli atau variasi-variasi bahasa Inggris lain yang harus diajarkan di Indonesia.
Kata Kunci: Guru bahasa Inggris penutur asli, Guru bahasa Inggris bukan penutur asli, World Englishes
INTRODUCTION
People preference towards native Eng-lish speaker teachers or NESTs in Indonesia is reflected in the advertisement in printed and electronic media about job vacancy offered to native English speaking teachers in private schools and English courses in Indonesia, partic-ularly in urban areas. The need of native English teachers to fill the vacancy in these schools and course centers is due to these institutions want to attract parents to enroll their children to learn in their ‘prestigious institutions’ for the sake of marketing strategy. In addition, hypothetical preference towards NESTs reflected in the newspaper ads (Moussu & Llurda, 2008) is due to benchmark or label given by the L2 speakers that native speakers are the “brand” of good
English that they can be models for L2 learners in terms of speaking. As cited in Moussu and Llurda (2008, p.316) who affirm that “… social recognition is often based on judgments of the speakers’ accent”, thus, it can be assumed that people justification of ‘good English’ speakers given to NESTs are based on their accent as it is believed that accent is a signifier between NESTs and NNESTs (Moussu & Llurda, 2008). Moreo-ver, Takada (2000); Tang (1997); Widdowson (1992) cited in Ellis (2002) agree that people prefer native speaker teachers because they are perceived as having ‘fluent, idiomatic spoken and pronunciation’ (p.71).
This paper will address a debate about NESTs and NNESTs, how people in many coun-tries including in Indonesia perceive them as le-
Volume 7, Nomor 3, November 2014 : 171-178
172
gitimate English teachers, who are more suitable to be employed in Indonesia will also be dis-cussed in this paper. At the end of this paper, it will also discuss about native English variety and non-native English variety and their implication in English teaching and learning in Indonesia. However, prior to discussing these three main points, the definition about who native and non-native speakers are will be discussed by using Hall’s notions (1997) about language, culture, and identity as a framework of this paper.
Hall’s notion about language, culture, and identity
Language, identity and culture are close-ly connected. Hall (1997) argues that language is one of the media in which people who have the same thoughts, feeling, and idea make meaning. According to Hall (1997) everything in this world was meaningless until people who share the same culture give meanings to things. Cul-ture is about ‘shared meanings (p.1)’. It means that there is an agreement within people who have the same thoughts, feelings, and idea about the way they see and make meaning about things. Hall (1997) maintains that people from the same culture may interpret things in more or less the same way; they give meanings to the world in a way that they understand each other. In addition, Kramsch (1998) agrees to what is said by Hall. According to Kramsch, people who belong to members of a social group view the world in the same manner through their interac-tions with other members who belong to the same group.
Hall (1997) adds that people give mean-ing in two ways. First, by ‘the way they use things in everyday practice’ (p.3) such as lan-guage. People who share the same language give meanings to things in the way that they can understand. Secondly, people give things mean-ing by ‘the way they represent them’ (p.3). For instance, the language registers, jargon, English native speaker variety, or local English variety. English native speaker variety represents the us-ers, the native English speaking people. Local English variety represents its users, the ‘other’ speakers of English. Bahasa Gaul, language reg-ister spoken among young people in Indonesia, represents Indonesian urban young people, and so forth. We give things meaning by how we represent them, in terms of how we use them, how we feel them, and how we think about them.
Furthermore, through the circuit of cul-ture meanings are produced and circulated.
Meaning is produced by people who share the same culture through their language and at the same time, meaning also gives us sense of our identity; who we are, with whom we belong to. Moreover, Woodward (1997) maintains that identity is marked by difference. The difference between native and non-native speakers is in their accent in terms of speaking. Accented is associated with non-native speakers’ identity. It is also constructed by language and symbolic sys-tems, the existence of another identity by deny-ing similarity against other groups (who is in-cluded, who is excluded), things used by mem-bers of social groups (signifiers). Identity, in one part, is fixed and unchanged. Yet in another part, it is unfixed, it changes, and it is historical (Woodward, 1997; Norton Pierce, 1995).
Identity is sometimes marked by nature (nationality, race, ethnicity), thus it can be said that identity is fixed, unchanged. For example, people often associate ‘white’ as native speak-ers. Whiteness is a natural marker which is at-tached in the physics of most native speakers. Nevertheless, because of history, identity can change, it is unfixed. For instance, children who were born in an English speaking country from parents who are non-English speakers are native speakers by history. They were born as non-English speaker, but as they grew up, they use English and perhaps, their parents’ language as well for communication. They become fluent us-ers of English because English could be their first language and it could be a language they learned first when they were little. As a result, they can be called native English speakers. Furthermore, identity is also shaped by culture (Woodward, 1997, p.15) and language (Kramsch, 1998). People’s identity can be constructed by differ-ences in culture and language. Woodward (1997) mentions that difference can be seen as negative and positive. It is seen as negative if it is used to exclude people by stereotyping and marginalizing people or group. On the other hand, difference can be seen as positive if it is used to ‘enrich’ or if we interpret it as ‘the source of diversity, heterogeneity, and hybridity’ (p.35). For example, the use of varietyof Eng-lishesother than native English variety. Like the use of Singlish which is seen as the marker of ‘inferiority’, ‘language of social marginal’, being prejudiced as ‘deficient speaker as vulgar, stupid, lacking refinement and culture of the speaker of good English’ (Hoon, 2003, p.55). On the other hand local variety like Singlish can be regarded as the source of diversity, heterogeneity, and hybridity. Singlish can also be seen as a repre-
Septarini, Native English Speaker Teachers (NESTS) and Non-Native English Speaker Teachers (NNESTS) in Indonesia: Preference And Dilemma
173
sentation of Singaporean identity. Similar to ba-hasa gaul, a register used among urban young people in Indonesia, which is seen as the repre-sentation of Indonesian youth and modernity.
Now, let us see who native speaker is, how people perceive native and non-native teachers, what advantages and disadvantages of having both of them.
Who is native speaker?
It is difficult to define who exactly native speaker is. Medgyes (1992) argues that the issue about native speaker is controversial and debat-able in sociolinguistic and pure linguistic point of view. He maintains that native and non-native division can be clearly seen in countries where English is spoken as a second or foreign lan-guage, but in countries where English is used as the first language, it is difficult to break the ho-mogeneity of native/ non native division. Medgyes (1992) takes an example of a 9 year old-boy whose his parents are Mexican and Norway. This boy has been living in the United States for five years. Which native language he has is ambiguous; it can be English, Spanish, Norway, or all three of them. As Bloomfield (1933) cited in Cook (1999) claims that native language is the first language which is learned by a person. Furthermore, Davies (1996) called this as “bio-developmental definition” (cited in Cook, 1999, p.186). Ellis (2002) citing Davies (1991) gives a distinction between the native and non-native speakers, she quotes from Davies’ circular definition of non-native speakers (1991) that ‘being native speakers means not being a non-native speakers’ (p. 72). Shuck (2006) uses Said (1978) and Pennycook’s (1998) concept of bina-ry opposition to describe more about the di-chotomy between native and non-native con-cept. Shuck (2006) argues that oppositional pairs such as native and non-native have ‘gener-ative power’ to produce hierarchical social or-ders (p.261). He uses linguistic concept of ‘markedness’ (p.261) to give a description that oppositional pairs are hierarchically related. Ac-cording to Shuck (2006) the unmarked term is often seen as neutral, while the marked term represents narrower categories. Thus, the dis-tinction between native and non-native can be seen as unmarked and marked categories. Na-tive as the unmarked category is neutral; it does not have color, culture, and accent. While non-native as the marked category is the opposite of native. It is narrowed to something which has color, culture, and accent. As a result, it is not surprising that people often associate ‘whiteness’
as native speaker teachers (Holliday &Aboshiha, 2009, p.670). Or in other words, it is often that people, especially in the countries of expanding circle, think that white people are native speak-ers.
Due to the difficulty in defining the term of native speakers, some writers such as Edge (1988), Kachru (1985),Paikeday (1985), Ramp-ton (1990) cited in Medgyes (1992, p.342) sug-gest to replace the term native speakers as ‘more or less accomplished users’, ‘more or less users of English’, ‘expert speakers and affilia-tion’, and ‘English-using speech fellowship’. The replacing of the term native speakers becomes ‘multi competent users’ (Cook, 1999), ‘accom-plished users’ (Medgeys, 1992), ‘language ex-perts’ (Rampton, 1990), and ‘proficient users’ (Paikeday, 1985) also shows the writers’ dissatis-faction of the terms native speakers as it leads to devaluing the non-native speaker teachers (Selvi, 2011, p. 187). This is evident in Firth and Wagner (1997) cited in Selvi (2011) who argue that non-native speaker teachers are stereotyped as being deficient in communication. The partic-ipants in Figueiredo’s research (2011) who are Brazilian English teachers working in the United State felt insecure relating to their confidence and authority of being English teachers because they are non-native. According to Figueiredo (2011) the dichotomy between native and non-native is marked by speaking proficiency (ac-cented and unaccented), hence the Brazilian NNESTs felt unconfident due to their accent in speaking English. Furthermore, as cited in Selvi (2011), Suarez (2000) and Bernat (2009) agree that non-native speaker teachers or NNESTs of-ten suffer from ‘impositorsyndrom’ due to native speaker teachers or NESTs are seen as a ‘benchmark for teaching employment’ (p. 187). As a result, NNESTs often face discrimination by ‘employers’ and ‘customers’ and this leads to NNESTs have to compete for jobs with less qual-ified NESTs (Phillipson, 1992; Holliday, 2008, p.121).
Moreover, discrimination towards NNESTs is seen from the appreciation given to NNESTs in forms of salary and the acknowl-edgement of expertise. NNESTs in Indonesia re-ceive lower salary and less acknowledgement of expertise compare to their peers, the NESTs (Dewi, 2007). Additionally, discrimination to-wards non-native speakers in English pedagogy is not only addressed to the non-NES teachers, but also to the non-NES students of TESOL programs who are conducting practicum. Brady &Gulikers (2004) cited in Moussu and Llur-
Volume 7, Nomor 3, November 2014 : 171-178
174
da(2008) saidthat many teacher educators do not let non-NES students to do the practicum in their institutions due to non-NES students are seen as having poor linguistic skills and they are afraid this deficiency would obstruct the students’ learning.
However, the belief which assumes that NESTs are better English teachers than NNESTs is not always true. By using Phillipson’sterm (1992), ‘native speakers fallacy’,(p.185) which best describes an assumption that ideal English teacher is a native teacher, I would like to say that I agree that native speaker teachers are not always ideal teachers of English, as we will see from people’s perception about native and non-native English teachers in many countries in the following section.
People’s perception towards NESTs and NNESTs
Based on his research, Üstünlüoglu (2007) finds that his participants who are the students in Turkey give positive attitudes towards NNESTs in terms of ‘in-class teaching role’ and‘in-class management roles’. On the other hand, the participants feelthat NESTs are better than NNESTs in terms of ‘in-class communica-tion’ (p.70-71). Some interesting findings in Üstünlüoglu’s study (2007) about students’ per-ception towards NESTs and NNESTs were found in the answers of his participants which reflect that students prefer NNESTs because they can understand NNEST speaking more eas-ily compare to NESTs. The researcher assumes that NESTs might speak too fast and their ac-cent could be an obstacle for students’ under-standing.Additionally, NNESTs in Turkey’s class-rooms can use their ability to translate the mate-rial into their mother tongue to explain difficult terms. Moreover, according to the participants, NNESTs maintain order and discipline in the classroom better than NESTs. This represents Turkey’s educational system in which authoritar-ian teachers are more respected than lenient teachers (Üstünlüoglu, 2007). Additionally, NNESTs are perceived as better prepared and know the topic well compared to NESTs. Üstünlüoglu (2007) assumes that the NNESTs are better prepared because they need to study more than native teachers because they teach a language which is not their native language, thus they have to study harder in order to be well prepared and informed about the subject they are about to teach in class.
However, the study also showed that NESTs have some positive values in terms of
communication skills. According to the partici-pants, NESTs are more communicative, they of-ten praise the students, make lesson enjoyable and treat students respectfully. NESTs also em-phasize more on communication in the class-room and disregard grammar errors (Üstünlüoglu, 2007).
Similar studies were also conducted by Grubbs, et al., (2010) among Thai students about their perceptions towards NESTs and NNESTs in Thailand. The research findings showed that students perceive NESTs, com-pared to NNESTs, are better in oral skills (speak-ing, pronunciation, and vocabulary usage), thus the Thai students prefer NESTs to teach pro-nunciation, reading, speaking and listening. On the other hand, Thai students prefer NNESTs to teach grammar and writing. Similarly, in Indone-sia, based on a study conducted in a blog in the website, Indonesian students agree that NESTs have a good ability in conversation skill; as a re-sult, they think that NESTs are better in teaching listening, speaking and pronunciation, while ac-cording to Indonesian students, NNESTs are good in grammar (2011). Moreover, both Thai and Indonesian students agree that NESTs know better about the culture of the English-speaking worlds, they can provide students’ demand of learning colloquial English or slang. However, NESTs are also seen as having weaknesses in knowledge and awareness of their students’ cul-ture (Grubbs, et al., 2010) as well as inability to detect difficulty faced by their students. As it re-flects from one of the respondents in the blog who says ‘they [NESTs] may not be able to un-derstand the common mistakes of learners’. On the other hand, NNESTs in Indonesia, according to them, can explain differences between L1 and target language. In addition, NNESTs know fundamental grammar and can clarify basic rules of English grammar in L1 (2011).
Furthermore, there are some other re-searchers who conduct similar study to find out people’s perception towards NESTs and NNESTs, such as Rao (2010) who conducted a research on students’ perceptions towards NESTs in China, Han (2005) in Korea, Ying and Braine (2007) who conducted research about students’ attitudes towards NNESTs in Hong Kong. Based on their research, it is found that the students in China, Hong Kong, and Ko-rea could distinguish the advantages and disad-vantages of having NESTs. The advantages of having NESTs are: 1). Most of them have quali-ties and skills which show that they are efficient language teachers, they are friendly and helpful,
Septarini, Native English Speaker Teachers (NESTS) and Non-Native English Speaker Teachers (NNESTS) in Indonesia: Preference And Dilemma
175
fluent and idiomatically appropriate in using English language, be able to appreciate the cul-tural connotations of the language, and in as-sessing whether a given language form is ac-ceptably correct or not (Rao, 2010), 2). NESTs can teach students ‘real English’ based on na-tive-like pronunciation, spontaneity in speaking (without hesitations), and cultures of English-speaking people (Han, 2005). Conversely, some disadvantages of having NESTs are: 1). NESTs are insensitive to students’ linguistic problems due to their lack experience of learning English as second language, 2). NESTs are ignorant of their students’ mother tongue, it makes difficult for NESTs to compare and to highlight differ-ences between the students’ mother tongue and the target language, 3). NESTs’ lack of familiari-ty and understanding of students’ culture and educational systems leads to a disparity between teaching and learning styles of the NESTs and preferred way of teaching and learning in the socio-cultural context of their students (Han, 2005; Rao, 2010).
In contrast, Yin and Braine (2007) find that the participants in their study in Hong Kong mentioned some advantages of having NNESTs, which are: 1). NNESTs are effective English teacher (they do not have difficulty in under-standing and answering the students’ questions), 2). NNESTs can apply effective strategies in teaching English as they have the experience of learning English through the same education sys-tem, the same cultural background, as a result NNESTs can understand the difficulties faced by the students, 3). NNESTs can explain difficult terms or issues using the students’ L1. NNESTs are also able to design teaching materials ac-cording to the need and the learning style of the students.
However, the participants in Yin and Braine (2007) research also mentioned some shortcomings of NNESTs such as the NNESTs tend to spoon-fed their students, they also see NNESTs as ‘exam-oriented teachers’ because NNESTs put more emphasize on practicing past examination questions. NNESTs are also per-ceived as over-reliant on textbooks. Finally, the participants critically stated that NNESTs are over-correcting the mistakes of the students in English usage.
The studies conducted by some re-searchers above about the perceptions towards NESTs and NNESTs in several countries proved that NESTs are not always better than NNESTs. As said by Rampton(1990) that ‘being born into
language does not mean that one inherently speaks it well’ (cited in Moussu and Llurda, 2008, p.321), it appears that Reis’participant (2011) has the same idea. Reis’ participant (2011), in order to challenged native speaker myth, states that being good reader and good writer in English is through the process of ac-quiring in schools, not automatically gained by someone because he or she has a native status. Thus, it can be concluded that being a native speakers alone does not guarantee one can be a good English teacher; to become a good English teacher one should have skills and qualifications.
DISCUSSION
Who should be employed in Indonesia? NESTs or NNESTs?
Both NESTs and NNESTs have their own strengths and weaknesses as English teach-ers. As Canagarajah (1999) cited in Moussu and Llurda (2008) argues that NESTs are ideal teachers because of their unique cultural knowledge, while NNESTs can also be ideal teachers because they have multicultural experi-ence.
Widdowson (1992) cited in Ellis (2002) maintains that a teacher is both informant and instructor,he also argues that NESTs have more experience as English users thus they may be better informants, whereas NNESTs have more experience as English learners hence they may be better instructors. Thus, it can be said that ideally both NESTs and NNESTs should be hired in Indonesia. They can collaborate in using their own strengths in teaching English in the class-rooms. As Medgyes (1992) suggests that ‘ideal school, there should be a good balance of NESTs and NNESTs, who complement each other in their strengths and weaknesses’ (p.349). He contends that NNESTs have strengths in providing a good learner model, teaching lan-guage learning strategies more effectively, antic-ipating and preventing language difficulties, us-ing their mother tongue to explain difficult terms, being more empathetic to the needs and problems of learners (Medgyes, 1994 in Moussu & Llurda, 2008). Liu (1999) and Widdowson (1992) cited in Ellis (2002) also agree that NNESTs’ experiences in learning target lan-guage are helpful for teaching the learners. While the strengths of NESTs as mentioned ear-lier are in their proficiency in speaking, pronun-ciation, vocabulary usage, culture of English-speaking worlds, and so forth.
Volume 7, Nomor 3, November 2014 : 171-178
176
However, Indonesian government re-stricts the number of native speakers to teach in Indonesia. It is regulated in the policy issued by Indonesian Ministry of Education PP no.78/ 2009 which says that foreign teachers cannot be more than 30 percent in compositions with local teachers. Thus, it would be difficult to place duo teachers (native and non-native teachers) to do collaborative teaching in all schools in Indonesia. Secondly, not all schools in Indonesia can afford to pay native speaker teachers since most of schools in small towns and villages are shortage of funds to pay the native teachers. For an illus-tration, some schools in Papua, East Indonesia can only afford to pay their contracted teachers (guru honor) for approximately IDR 3000 to IDR 5000 per hour (it equivalent with approximately AUD 50 cents per hour).
Nevertheless, native versus non-native teachers’ dichotomy has become a never ending debate. As Miller (2007)argues that it does not matter who the teacher is, whether he/ she is NEST or NNEST. The most important thing is whether he/ she is competent in speaking, reading and writing in English, have excellent knowledge in grammar, and have good teaching knowledge and skill since both NESTs and NNESTs are facing the same problems in Eng-lish teaching and learning. Some common prob-lems faced by both NESTs and NNESTs accord-ing to Miller (2007) are: 1). In choosing appro-priate materials for students (the materials should be engaging, have socio-cultural context which is understood by both students and teachers), 2). In determining the purpose of the lesson and mak-ing a cohesive tie of each lesson.
Hence, it can be concluded that even though NESTs teachers are needed to do coop-erative teaching in Indonesia, it seems that it contradicts government regulation in hiring na-tive teachers in schools. However, both NESTs and NNESTs should have language teaching qualifications in order to be able to serve Indo-nesian schools. Ellis (2002) argues that it is nec-essary for all ESL teachers, native and non-native, to have training, experience, understand-ing of language, and teaching skills. Thus, it is becomes no matter who teach in Indonesia, whether they are NESTs or NNESTs as long as they have appropriate teaching qualification, skills, and experience.
The fact that it is not really necessary to debate whether NESTs or NNESTs who are more suitable to be hired in Indonesia, another issue arising now is about which English and
whose English should be taught in Indonesia. Is it English native speakers (ENS) or local variety of Englishes? The following section will discuss about English native speakers, variety of Eng-lishes, and the dilemma faced in Indonesia in choosing which English should be taught.
English native speakers (ENS) or local varie-ty of Englishes?- A dilemma
English in Indonesia is used as the first official foreign language. It is used for interna-tional communication, and as a medium to ac-quire knowledge, particularly science and tech-nology. In addition, English is also used as sources for lexical development of Bahasa Indo-nesia (Sadtono, 1976; Diah, 1982 cited in Lowenberg, 1991). Furthermore, Sadtono (1976) cited in Lowenberg (1991) believes that English will never be a social language in the In-donesian community nor as the second official language of the administration of Indonesia.
English was identified as the first foreign language in Indonesia soon after Indonesian in-dependence in 1945 replacing former colonial languages of Dutch and Japanese. Hence, Eng-lish became a compulsory subject in the second-ary curriculum from the early years of independ-ence and it continues become one of the most significant subjects at schools and universities in Indonesia (Lamb and Coleman, 2008). Schools and other formal & informal institutions in Indo-nesia refer to English Native Speaker (ENS) vari-eties such as American English (AmE) and Brit-ish English (BrE) to be used in English class-rooms. However, ENS varieties which are learned in class are not used in daily conversa-tion. As a result, people in Indonesia create local variety which uses English as an additional lan-guage (Lowenberg, 1991).It becomes a chal-lenge for English language professionals to de-termine whose English, which English should be taught to the students in Indonesia. Should it be local variety or ENS variety? Regarding that now, English as Lingua Franca (ELF) which uses local variety seems effective to be used in world-wide communication (Young & Walsh, 2010).
Moussu and Llurda (2008) point out that before the beginning of 1990s native-like command is used as a parameter of the success of learning English. More recently, language professionals have been starting to question the usefulness of a native speaker model in English pedagogy, regarding the fact that non-native speakers are outnumbered native speakers (Graddol, 2006 cited in Moussu & Llurda, 2008; Maley, 2009), thus Moussu and Llurda (2008);
Septarini, Native English Speaker Teachers (NESTS) and Non-Native English Speaker Teachers (NNESTS) in Indonesia: Preference And Dilemma
177
Prodromou (1997) cited in Timmis (2002)believe that currently communication in English is occurred between NNS and NNS, as a result the norms and usage of ENS should not be the focus for NNS to pursue. Moreover, using non-native English variety orso called by Maley (2009) as non-standard, is not seen as negative prejudice or discrimination.
It will be a benefit for NNEST to teach local variety since the NNEST does not have to be as perfect as NES especially in accent which is very difficult to be gained, as argued by Kramsch (1997) cited in Moussu and Llurda (2008) that it is not possible for non-native speakers to be exactly like native speakers espe-cially in speaking competence. She suggests that it would be better for non-native speakers to re-tain their uniqueness and become competent in a new language.Moreover, the teaching situation in Indonesia where the classes are large, teach-ers have minimal English proficiency and most of them cannot afford to travel abroad to learn ‘real English’ or native English norms, limited contact time, and exam-oriented teaching, other variety of English is more suitable to be taught. As Bruthiaux (2010, p.368) agrees that ‘to learners in developing, resource-poor EFL set-ting especially, it matters very little who says tomahto and who says tomayto. Knowing the word tomato is achievement enough’.
However, there is a disparity between the use of English as an additional language which leads to the emergence of new variety of English and the Bourdieu’s cultural capital (Nor-ton Pierce, 1995) of learning English. Learning English is an investment for getting better job and going to a higher level of education. English is also seen as the ‘mark of well-educated man’, a symbol of the ‘new elite’ (Tanner, 1967 cited in Lowenberg, 1991). The common standard tests of English used in job industry or higher degree of education are IELTS and TOEFL, and these two tests follow the NS models. Thus, there is a dilemma in which, in reality, local vari-ety of English is used among people in Indone-sia; on the other hand, if someone wants to suc-ceed in life, they must learn ENS variety because to be able to enter the ‘gate’ of higher degree of education and get a better job, one has to show his/ her mastery of English which is measured by the standard tests such as IELTS and TOEFL.
CONCLUSION
People preference on NESTs is due to NESTs are seen as a ‘brand’ or benchmark of
‘good English’. The brand of good English speakers given to NESTs is measured by accent as a marker which distinguishes NESTs and NNESTs, fluency in speaking, and so forth. On the other hand, NNESTs are often seen as defi-cient English speakers because they speak with accent, less fluent in speaking compared to NNESTs, and so forth. As a result, negative prejudices given to NNESTs lead to discrimina-tion to NNESTs in teaching employment.
Nevertheless, based on some studies about people’s perception towards NESTs and NNESTs, it can be seen that native speaker fal-lacy is true. NESTs are not always ideal teachers. On the other hand, NNESTs are not always worse than NESTs. In fact, both NESTs and NNESTs have their own strengths and weak-nesses as English teachers. Some researchers suggest hiring NESTs and NNESTs in each Eng-lish class because they can collaborate and com-plement each other. However, most schools in Indonesia, especially state schools cannot apply collaboration between NESTs and NNESTs due to government policy which restricts the number of foreign teachers to teach in Indonesia. In ad-dition, most schools in Indonesia, due to finan-cial difficulty or shortage of funding, cannot af-ford to hire foreign teachers.
However, the most important thing in choosing good English teachers is based on the qualification, skills, and experience of teaching; no matter they are native or non-native. A prob-lem which arises now is in determining which English should be taught. It is dilemmatic in de-termining variety of Englishes and native English variety since there is a disparity between the consumption of English as additional language and the cultural capital of learning English among Indonesian community.
REFERENCE
Cook, V. (1999). Going beyond the native speaker in language teaching. TESOL Quarterly, 33(2), 185-209.
Dewi, A. (2007). Shifts in NNESTs' professinal identity: an impact of language and culture immersion. The Asian EFL journal quarterly, 9(4), 111-125.
Ellis, L. (2002). Teaching from experience: a new perspective on the non native teacher in adult ESL. Australian review of applied linguistics, 25(1), 71-107.
Figueiredo, E. H. D. d. (2011). Nonnative English-speaking teachers in the United
Volume 7, Nomor 3, November 2014 : 171-178
178
States: issues of idenitity. Language and Education, 25(5), 419-423.
Grubbs, S. J., Jantarah, V., & Kettem, S. (2010). Studying English with Thai and native-speaking teachers. Teachers and Teaching, 16(5), 559-576.
Hall, S. (1997a). Introduction. In S. Hall (Ed.), Representation: cultural representations and signifying practices. London: SAGE.
Hall, S. (1997b). The work of representation. In S. Hall (Ed.), Rpresentation: cultural representations and signifying practices. London: SAGE.
Han, S. A. (2005). Good teachers know where to scratch when learners feel itchy: Korean learners' views of native-speaking teachers of English. Australian Journal of Education, 49(2), 197-213.
Holliday, A. (2008). Standards of English and politics of inclusion. Language teaching, 41(1), 119-130.
Holliday, A. & Aboshiba, P. (2009). The Denial of ideology in perceptions of 'nonnative speakers' teachers. TESOL Quarterly, 43(4), 669-689.
Hoon, C. H. (2003). "You see me no up". Language problems & language planning, 27(1), 45-62.
Kramsch, C. (1998). The relationship of language and culture,Language and culture. Oxford: Oxford University Press.
Lowenberg, P. H. (1991). English as an additional language in Indonesia. World Englishes, 10(2), 127-138.
Lamb, M., & Coleman, H. (2008). Literacy in English and the transformation of self and society post-Soeharto Indonesia. The International Journal of Bilingual Education and Bilingualism, 11(2), 189-205.
Miller, J. (2007). Identity construction in teacher education. In Z. Hua, P. Seedhouse, L. Wei & V. Cook (Eds.), Language learning and teaching as social interaction (pp. 148-162). Basington, UK: Palgrave Macmillan.
Medgeyes, P. (1992). Native or non-native: who's worth more? ELT Journal, 46(4), 340-349.
Moussu, L., & Llurda, E. (2008). Non-native English-speaking language teachers:
history and research. Language teaching, 41(3), 318-348.
Native speaking teacher vsnon native speaker. (n.d). Retrieved August 25, 2011, from www.englishbaby.com/forum/AskEnglish/thread/434175
Norton Pierce, B. (1995). Social identity, investement, and language learning. TESOL Quarterly, 29(1), 9-31.
Paikeday, T. (1985). The Native Speeaker is Dead! Toronto, Canada: Paikeday Publishing Inc.
Phillipson, R. (1992). Lingusitic imperialism. Oxford, UK: Oxford Univeristy Press.
Rampton, M. B. H. (1990). Displacing the "native speaker": expertise, affiliation, and inheritance. ELT Journal, 44(2), 97-101.
Rao, Z. (2010). Chinese students' perceptions of native English-speaking teachers in EFL teaching. Journal of Multilingual and Multicultural Development, 31(1), 55-68.
Reis, D. A. (2011). Non-native English-speaking teachers (NNESTs) and professional legitimacy: a sociocultural theoretical perspective on identity transformation. International Journal of the sociology of language, 208, 139-160.
Selvi, Ali Fuad. (2011). The non-native speaker teacher. ELT Journal, 65(2), 187-189
Shuck, G. (2006). Racializing the nonnative English speaker. Journal of language, identity, and education, 5(4), 259-276.
Timmis, T. (2002). Native-speaker norms and international English: a classroom view. ELT Journal, 56(3), 240-249.
Üstünlüoglu, E. (2007). University students' perceptions of native and non-native teachers. Teachers and Teaching, 13(1), 63-79.
Woodward, K. (1997). Introduction. In K. Woodward (Ed.), Identity and difference. London: SAGE Publications.
Ying, C. L., & Braine, G. (2007). The Attitudes of univeristy students towards non-native speakers English teachers in Hong Kong. RELC Journal, 38(3), 257-277.
Young, T. J., & Walsh, S. (2010). Which English? Whose English? An investigation of 'non-native' teachers' beleifs about target varieties. Language, culture and curriculum, 23(2), 123-137.