how to improve the ‘sepeda kampus’ bicycle sharing system · to the ‘sepeda kampus’ system...
TRANSCRIPT

il
How to improve the ‘Sepeda
Kampus’ bicycle sharing system
Jan M. Engels BSc. Thesis
February - June 2016
Supervisors:
Ir. M.J.G. Brussel Dr. T. Thomas
Dr. Ir. A. Wismadi
Civil Engineering Faculty of Engineering Technology
University of Twente P.O. Box 217
7500 AE Enschede
The Netherlands

June 2016 Bachelor thesis Jan Engels – Final report 2
Preface You are reading now the final report of my internship. The occasion that led to the writing of
the report is the final stage of the bachelor degree. For this final stage a research must be
conducted where the knowledge that was gained during the previous years of study is
applied at a particular project. The research that will be described in this report was
conducted at the Universitas Gadjah Mada in the department Pusat Studi Transportasi dan
Logistik.
I have chosen to do this internship outside the Netherlands because I thought going to
another country and working there would be a great experience which can help me later in
my work as civil engineer. To do an internship and writing a report with the focus on the
traffic and transportation aspect of civil engineering was an easy choice. I am very curious
about how the future of transportation will look like and how people will deal with the new
rising problems. One development within the traffic and transportation aspect of civil
engineering is the introduction of so called bicycle sharing systems which have gained more
and more attention during the last years. During my search for an interesting subject for my
research I came across these bicycle sharing systems and their development. They caught
my attention because they are a flexible and environmentally friendly way to move around in
cities. These two aspects are from my point of view the things we need to focus on in the
development of the traffic and transportation in the upcoming years. Because of the high
population and the related busy traffic I have chosen to go to Asia to do my research. The
opportunity to go to Indonesia was based on the fact that the University Gadjah Mada
already has such a bicycle sharing system and that the University of Twente, especially the
ITC, has very good connections with them.
Before starting the report I would like to thank some people which made it possible for me to
live and work in a different country for nearly 3,5 months. I would like to thank the people
from PUSTRAL, which helped me whenever it was necessary. Especially I would like to
thank Listi who arranged so many things for me and helped me a lot with everyday things in
Yogyakarta. Also I would like to thank my three supervisors Mark Brussel, Tom Thomas and
Arif Wismadi, from the beginning on their feedback was helpful and made this report also
possible.

June 2016 Bachelor thesis Jan Engels – Final report 3
Contents 1. Introduction .................................................................................................................... 5
2. Methodology ................................................................................................................... 7
3. Characteristics ............................................................................................................... 9
3.1 System characteristics ............................................................................................ 9
3.2 Characteristics of the main user .............................................................................15
3.3 Environmental characteristics .................................................................................15
3.4 Traffic streams .......................................................................................................18
3.5 Conclusions from characteristics ............................................................................21
4. Construction of the survey .............................................................................................23
4.1 The sample ............................................................................................................23
4.2 The method ............................................................................................................23
4.3 The questions .........................................................................................................23
5. Analysis .........................................................................................................................27
5.1 Preparation of the data ...........................................................................................27
5.2 Descriptive statistics ...............................................................................................28
5.3 Inferential statistics .................................................................................................30
6. Critical review ................................................................................................................37
7. Conclusions ...................................................................................................................41
8. Discussion .....................................................................................................................44
9. References ....................................................................................................................45
10. Attachments ...............................................................................................................47
10.1 Appendix A – Research questions and definitions: .................................................47
10.2 Appendix B – Characteristics: ................................................................................48
10.3 Appendix C – Final survey: .....................................................................................51
10.4 Appendix D – Analysis: ..........................................................................................56
June 2016 Bachelor thesis Jan Engels – Final report 4
Abstract
The masterplan of the Gadjah Mada University aims to achieve a more sustainable and
environmentally friendly campus. The introduction of a bicycle sharing system is an
embodiment of the vision. The aim of the implementation of this bicycle sharing system is to
increase the meeting between students across the campus. The bicycle sharing system
should also improve the connectivity between the university buildings and contribute to a
healthier environment. In 2011 the bicycle sharing system called ‘Sepeda Kampus’ was
introduced as follow up of the in 2005 introduced ‘Sepeda HIjau UGM’ (Green bicycle UGM).
The centre of transportation and logistics of the Gadjah Mada University helped to introduce
this system and is currently working on the improvement of the system. This research will
contribute its part to improve the system, it will look at the characteristics of the system, the
relationship between cycling behaviour and the characteristics and analyse which
improvements will help to promote that more people use the bicycle sharing system. The
research that is going to be described in this report will give an answer to the following
research question: ‘Which factors influence the bicycle travel demand of the bike sharing
system at Gadjah-Mada University in Yogyakarta’.
To answer this question an online survey was constructed which covered four different
aspects that are relevant to the research. First socio-demographic characteristics were
collected followed up by questions about the current bicycle usage. These two categories
were followed up by statements about characteristics of the bicycle sharing system, people
could agree or disagree with these statements. The last section of the survey consists of
seven combinations of stated improvements. The underlying idea here was to analyse which
factors will influence people so that they will cycle more with the ‘Sepeda Kampus’ system.
Between the 29th February 2016 and the 12 May 2016, 1936 valid responses were collected.
The biggest group which participated in the research were the students, this could be
expected because students are also the biggest group within UGM. One important finding of
this research is that the more positive people are about the system the more they cycle with
or without the system. The next thing is that the weather influences the choice to cycle the
most. The results from the last section of the survey indicate that for users and possible
users of the systems single policies are just effective as the introduction of all three policies.
Based on the answers to the statements and the stated improvements the most important
factors to increase the travel demand are better service, more and easier accessible stations
within the area. To increase the safety more bicycle paths which are better signed, or even
physical separated from other traffic, should be established.
June 2016 Bachelor thesis Jan Engels – Final report 5
1. Introduction The research was executed at the Gadjah Mada University at the centre of transportation
and logistics studies. The centre for Transportation and Logistics Studies (PUSTRAL) is a
research centre for transportation and regional development. Its commitment is supported by
excellent quality of researches from various disciplines which are the main assets to answer
the problems and challenges in transportation and regional development
1.1 Context The research “Motorization and non-motorized transport in Asia - Transport system evolution
in China, Japan and Indonesia” (Walter Hook, Michael Replogle, 1996) shows that traffic in
Indonesia is dominated by motorcycles, they contribute to 70% of the total amount of traffic
to and off work. These motorcycles are according to Hook and Replogle one reason of the
growing air pollution in Asian cities. Also they investigated that the average travel speed in
Asian cities is about 10km/h, this speed could easily be achieved by bicycles. The low
average travel speed and the air pollution are two main concerns of traffic researchers. The
high amount of motorcycles is also an issue on the area of the University-Gadjah-Mada in
Yogyakarta. Based on their masterplan the University-Gadjah-Mada (UGM) has introduced in
2011 the so called ‘Sepeda Kampus’ system where students and employees from UGM can
borrow a bicycle to go around the campus after they came to UGM by bicycle, motorcycle or
car. This system is further development of ‘Green Bike UGM’ which was introduced in 2005.
Basically there are two main reasons two introduce a bicycle sharing system on a campus,
one reason is to solve the parking and traffic problem on the campus and the other reason is
for sustainability and health reasons. A statement by Dr. Joyce illustrates that very well “We
did it (bicycle sharing) as a means of reducing the need for parking, but as we looked at it
from the standpoint of fitness, health and sustainability, we realized we have the opportunity
to create a change.” (Zezima, 2008). The statement “Sustainable and practical personal
mobility solutions for campus environments have traditionally revolved around the use of
bicycles, or provision of pedestrian facilities” (Ian Vince McLoughlin, I. Komang Narendra,
Leong Hai Koh, Quang Huy Nguyen, Bharath Seshadri, Wei Zeng, Chang Yao, 2012) is also
an indication that bicycle sharing systems on a campus become more and more interesting.
At UGM the system was introduced, next to the previous two reasons, to increase the
connectivity between campus buildings. In the current situation the traffic within the campus
is either terminating traffic people coming to UGM or traffic that uses one of the four main
roads, which run through the campus, to enter or exit Yogyakarta. The ‘Sepeda Kampus’
system aims to reduce the terminating and internal traffic, these trips are now mainly done by
motorbikes.
In recent years adoption of and studies on this wide spread urban public transportation “revolution” have spread across the globe. Two key questions for the success of bike sharing programs are how many ridership bike sharing systems can attract, and what influences their effectiveness (Jinbao Zhao, Wei Deng, Yan Song, 2014). Results from researches show that the usage of the bike sharing systems increases when the urban population, the number of docking stations, the number of members and the government expenditure increases. Other researches show that the land-use, demographics and environmental conditions influence the usage of the bike sharing systems. The article ‘Factors influencing the choice of shared bicycles and shared electric bikes in Beijing’ found that bike share users are sensitive to levels of comfort and effort, temperature will also temper demand (Andrew A. Campbell, Christopher R. Cherry, Megan S. Ryerson, Xinmiao Yang , 2016). The research by A.A. Campbell et al. also states that a bike sharing system should be deployed in a dense area with a high intensity of short trips, the ‘Sepeda Kampus’ is a bicycle sharing system in a dense area however the intensity of the short trips is until now unknown. They also prefer a high amount of small stations over a low number of big stations. These PBS more mostly

June 2016 Bachelor thesis Jan Engels – Final report 6
used to solve the so called ‘first or last mile’ problem. ‘Offering workable solutions that help a person traverse this “first or last mile” between home, work, or another destination and transit, increases the likelihood that residents will leave the car at home’ (BAAQMD, 2016). For Yogyakarta the PBS is mainly aiming on reducing the motor bicycle usage. From the different articles that deal with difficulties of bike sharing systems it can be seen that these systems are very complex and one has to keep many things in mind to make a bike sharing system successful. Whether those difficulties and possible solutions also apply to the ‘Sepeda Kampus’ system in Yogyakarta is unknown, this is why this research is executed.
1.2 Objective The main purpose of the research is to explore and explain the factors that can help to
increase the travel demand of the bicycle sharing system at the Gadjah-Mada University.
Based on these factors recommendations can be made. Therefore it is necessary to
determine the various characteristics and factors of the bicycle sharing system.
1.3 Research question To reach the objective an answer to the following research question must be found:
Main research question:
Which factors influence the bicycle travel demand of the bike sharing system at Gadjah-
Mada University in Yogyakarta?
Sub questions:
What are the characteristics of the bike sharing system at UGM?
How are the characteristics from UGM similar or different to characteristics from
comparable systems?
Is there a relationship between the characteristics of the travel system and the travel
demand?
Which factors are based on the findings important to increase the travel demand?
Which recommendations can be made on the basis of the research findings to
increase the use of the system?
These sub questions can again be split up in sub-sub questions, these can be found in
Appendix A
1.4 Reading guide This reading guide will help to understand the structure of this report and make it easier to
follow the argumentation. This report fill generally follow the structure of the conceptual
model presented in Figure 1. First the system and environmental characteristics of the
system will be analysed. The chapter followed by that will be the chapter about construction
of the survey. After the data from the survey is collected an analysis will be executed. Based
on this analysis a comparison between the results from this research and from other
researches on this topic will be done. Finally the conclusions will be drawn on which
recommendations will be based.
The general set up of a chapter will be a short introduction to the chapter and what it will be
about. After that different sections of the chapter will describe and analyse the chapter
specific things. At the end of each chapter a summary will present the important things of the
chapter.
June 2016 Bachelor thesis Jan Engels – Final report 7
2. Methodology In the following the research method is described and which work is going to be executed to
answer the research question. The methodology this research will use is illustrated in the
following figure.
Figure 1 – Conceptual model
In the available literature different characteristics are described, the different researches use
different types of characteristics they analyse. The article ‘Mining bicycle sharing data for
generating insights into sustainable transport systems’ by (Oliver O'Brien, James Cheshire,
Michael Batty, 2013) summarizes the characteristics and provides an overview about the
various characteristics of a PBS. This research will due to the limited amount of time focus
on the following characteristics:
The aggregate characteristics
The spatial characteristics
The environmental characteristics
Main users characteristics
The first three characteristics are required to measure the performance and quality of the
system. The main user characteristics are used to determine which people actually use the
system and what their social-economic characteristics are. It is important to realize that the
difference between characteristics and factors is very small. For example the total amount of
bicycles is an aggregate characteristic of the system while the amount of bicycles available
at a station is an important factor why people might or might not cycle, for this reason one
has to be careful while analysing the characteristics. The characteristics from UGM will be
tested on the basis of the guidelines for successfully bike-sharing system designed by ITDP.

June 2016 Bachelor thesis Jan Engels – Final report 8
From Figure 1 it can be seen that the first step is to identify the system and environmental
characteristics at UGM. As described this research will focus on four different characteristics.
The systems characteristics can be analysed by looking at the aggregate characteristics –
number of docking stations, number of docking points, number of bicycles available. The
spatial characteristics are also related to the system, for this type of characteristics we need
to identify the system’s area of influence and the mean distance between docking stations.
The characteristics of the main users are also part of the system characteristics. For the
analysis of the environmental characteristics a closer look must be taken at the roadway
characteristics. These characteristics have to deal with the available infrastructure and the
land use of the area.
There are different methods necessary to identify the different characteristics. Each type of
data needs to be analysed in its on specific manner. All this data is needed to identify the
special characteristics of the bicycle sharing system at UGM. The information from the
analysis of the characteristics is also required to obtain possible differences between the
objective analysis and the outcomes from the survey.
The next step in the research is to prepare a survey based on the characteristics identified in
the first step. This survey needs to provide insights on the opinion, of the users and possible
users, about the characteristics. The set-up of the survey is crucial because as it can be
seen from Figure 1 the next step of the conceptual model is to identify the ‘satisfaction with
characteristics’ ‘factors of importance in cycling’ and as already mentioned the ‘social
economic characteristics’ of the users and possible-users.
The difference between users and possible users of the system is required to identify
characteristics and factors why people might not cycle. This can be retrieved by looking at
the results from the possible users. To guarantee an adequate comparison between users
and possible users the survey will ask the same questions to both groups, this is also done to
identify possible differences in outcomes.
The information from the surveys is essential to come to conclusions and to answer the
research question. Different descriptive an inferential statistics will be used to summarize the
results from the survey. The next step in the conceptual model is to summarize the findings
to ‘Findings from UGM’. Before the research questions can be answered all information from
the characteristics, factors, survey, possible users and users must be summarized.
After the findings are summarized a critical review must be carried out, this review is done by
comparing the findings from UGM with the findings from other researches on this topic.
Another part of this review is to determine the possible differences in findings and try to
explain causes of the differences. With the critical review, the results from the characteristics
analysis and the results from the survey the research questions can be answered.

June 2016 Bachelor thesis Jan Engels – Final report 9
3. Characteristics
3.1 System characteristics This chapter provides a general overview of the system and its characteristics. The following
sections will describe how to use the bicycle sharing system and will explain the spatial and
the aggregate characteristics of the system. Next to this the environmental characteristics will
also be analysed. The traffic streams and the land use are also part of this chapter. The
collection of this information is the first step in the conceptual model.
3.1.1 Spatial characteristics This section will provide information about the geographical aspects of the system. It will
determine the systems area of influence and the mean distance between docking stations.
Also the available information about elevation will be analysed. The spatial and aggregate
characteristics are collected and analysed using a geographical information system (GIS).
Yogyakarta is a city within the special province of Yogyakarta. The urban campus of the
Gadjah Mada University is located in the north of Yogyakarta. The following figures will show
the exact location of the campus area.
Figure 2 - Special province of Yogyakarta

June 2016 Bachelor thesis Jan Engels – Final report 10
Figure 3 - City of Yogyakarta
Figure 4 - Campus area

June 2016 Bachelor thesis Jan Engels – Final report 11
The systems area of influence is regulated by the rules of the system. All trips need to be
within the area of UGM, therefore the boundaries of UGM must be clear. The northern
boundary of UGM from West to East is the ‘Pogung Kidul’ followed by ‘Jalan Teknika
Selatan’ followed by the ‘Jalan Agro’. The western boundary of the campus is determined by
the ‘Jalan Kesehatan’ and the ‘Jalan Yacaranda’. The ‘Jalan Prof. Dr. Sardijto’, ‘Jalan
Terban’ and ‘Jalan Colombo’ form together the southern boundary. In the East the campus is
limited by the ‘Jalan Prof. Dr. Drs. Notonagoro’ followed by the ‘Jalan Imogirir Barat Km 7
Desa’ and the ‘Depok’. The Indonesian word ‘Jalan’ means road that is why this word
appears so often. The total length of this boundary is 6.4 km, which results in an area of
2.0km².
3.1.2 Aggregate characteristics In this section the aggregate characteristics of the bicycle sharing system will be analysed.
It will present the number of docking stations, the number of docking points and the number
of available bicycles.
The necessary data was provided by a report about the ‘Sepeda Kampus’ and the website
http://sepedakampus.ugm.ac.id/. This data provides information about the number of
stations, the location of the stations and other information that is going to be used for this
research. In Figure 5 the green area shows the area of the campus of UGM and the yellow
points mark the locations of the bicycle sharing stations. In total there are 17 stations across
the campus. The following list shows the name of the stations:
1. Perpustakaan
2. Gelanggang 3. Lembah 4. Agro Fauna 5. Taman Biologi 6. Teknik 7. Kesehatan 8. Vokasi 9. GMC 10. Bank UGM 11. Farmasi 12. PAU
Pascasarjana 13. Hotel UC 14. Dinas 15. Klebengan 16. Bengkel
Figure 5 - Locations of the stations
The stations are built out of standardized docking ‘shelters’, these shelters provide space for
eight dockings points. Such a standard shelter can be seen in Figure 6. These standard
shelters can be moved between different stations to guarantee a sufficient amount of docking
points per station.
Each station of the bicycle sharing system consists of a different amount of these shelters.
Figure 7 shows a closed shelter, some stations have the opportunity to lock the bicycle in a
closed shelter. These closed shelters are used for transportation, they fit on a small truck so
that the operator can move the bicycles to another station where not enough bicycles are
available. Table 11 in appendix B gives an overview of the name of the station, the exact
location, the ideal amount of bicycles, the maximum amount of bicycles and the amount of

June 2016 Bachelor thesis Jan Engels – Final report 12
bicycles at each station at the 11th February 2016. The ideal amount is based on experiences
of the operator. The system was introduced in July 2011, based on the experience of the
previous four years the ideal amount of bicycles per station is determined.
Figure 6 - Standard shelter Figure 7 - Closed shelter
Before the research can go on three things must be mentioned that are important. The first
thing is that ‘Bengkel’ and ‘Lembah’ are at the same location, ‘Bengkel’ means workshop, at
this station the bicycles are repaired if they are broken. At first the station ‘Bengkel’ was at a
different location but due to a lack of space they moved the station close to ‘Lembah’. In the
system they are listed as two station but in reality they are one station with facilities for
repairs. The second thing is that not all stations are electronic, some stations use manually
filled books to register the users of the systems. For this reason the data of some stations is
less reliable. The last thing is that the station ‘Jl. Tevesia’ is excluded from the research
because during the research this station is still under construction. It is unclear where the
station is located and what the ideal and maximum amount of bicycles is.
To determine the distance between the docking stations Google maps was used.
Unfortunately the option for bicycles is not available for Yogyakarta, so the ‘walking’ option
was used to measure the distances. With this option all possible trips between different
stations are calculated. The result can be seen in Table 12 in appendix B, in this table all
distances are measured in meters. The longest possible trip between two stations is 1997m
and is a trip between the stations ‘4. Agro Fauna’ and ‘8. Vokasi’. The shortest possible trip is
between the stations ‘1. Perpustakaan’ and ’14. Dinas’, this trip is only 120m long. The
average distance between two stations is 932,78m this would take about 4 minutes to cycle.
The elevation of the area is also a spatial characteristic of the system. To determine the
elevation again the geo information model is used. The model provided by PUSTRAL shows
only level curves with a difference of 6,25m. For our research we would like to have a more
detailed description of the elevation of the UGM campus area. Therefore the level curves are
interpolated using a GIS-software. An image of the newly generated level curves together
with the streets can be seen in the following figure.

June 2016 Bachelor thesis Jan Engels – Final report 13
Figure 8 - Area with interpolated level curves
With these interpolated level curves it is now possible to determine the gradient of each road.
Table 13 in appendix B shows the ID of the road, the length, the minimum and maximum
elevation, the difference between these two values and the gradient
From Table 13 in appendix B we can see that there is one steep elevation of 5% (ID 9741)
one possible has to cycle. If people cycle from ‘Jalan Prof. Dr. Notonagoro’ up to the Masjid
Kampus UGM they would have to cycle up this steep elevation. The mean gradient of the
UGM area is 1%. By looking at the values of the gradient and the experiences during the
time in Yogyakarta it can be concluded that with a little amount of effort one can cycle up the
elevations. So from the data and the personal observations it can be said that the elevation is
not a reason why people might not use the system. The elevation might be an issue why
people do not use the system in combination with the weather, when it warmer one has to
put in more effort to cycle which makes it less attractive. This aspect will be covered by the
survey.

June 2016 Bachelor thesis Jan Engels – Final report 14
3.1.3 How to use the system The ‘Sepeda Kampus’ bicycle sharing is a free system that is intended for students, faculty
staff as well as guests of UGM. The bicycle infrastructure is not just available for the system
users, it is also available for users of personal bicycles. To use a bicycle from the bicycle
sharing system you first have to register. The registration is done at every station by an
officer. For the registration and the usage of the system a personal ID is necessary. After the
registration one can immediately use the bicycle. Before one can leave the station the
departure has to be registered also by an officer. The bicycles should only be used within the
area of UGM and be returned to a ‘Sepeda Kampus’ station. After the arrival at the
destination station an officer will register your arrival. The usage of the bicycles is limited to
30 minutes for each trip, this is sufficient time to cycle to another station. The system is
available on Monday till Thursday from 06:00 to 18:00 and on Friday from 06:00 to 17:00.
(Kampus, 2016). Since the 24th October 2015 the system is also open on Saturdays because
there are some lectures on Saturday.
3.1.4 The standard bicycle This section will give a short description of the bicycle that is used for the bicycle sharing
system at UGM. The bicycle has six different gears which can be changed manually at the
right side of the handlebars. The bicycle also has two breaks, one for the front wheel and one
for the back wheel. To transport things a basket in front of the handlebars is installed and at
the back a carrier is installed. To this basket a serial number for identification purposes is
attached, this serial number can also be found attached to the carrier. For the night the bike
also has a dynamo which generates electricity for the lights of the bicycle. Every user gets a
lock for his/her bicycle so one can secure the bicycle outside the docking stations. The
following picture shows a bicycle that is used by the bicycle sharing system at UGM.
Figure 9 - Standard bicycle
June 2016 Bachelor thesis Jan Engels – Final report 15
3.2 Characteristics of the main user Some characteristics of the main users are already described in the section ‘How to use the
system’, the main user must be a student, faculty member, staff or a visitor of the UGM. The
other characteristics are identified by the survey and will be presented in the ‘Analysis’
chapter of this report.
3.3 Environmental characteristics This chapter is used to describe the environmental characteristics of the bicycle sharing
system. The roadway characteristics, the available infrastructure and the land use of the area
are examined.
3.3.1 Available infrastructure During a field trip it was discovered that the data provided by PUSTRAL does not cover all
streets on the UGM campus area. For this reason an Openstreetsmap (OSM) file is added to
the data. The data provided by OSM is more accurate and consists of nearly every street in
the UGM campus area. With the additional data this model provides information about the
location of roads and bicycle paths. Both models, the one from PUSTRAL and the OSM-
model indicate that on every road on the UGM campus bicycle paths are present. This might
be the case according to the model but from the field trip different results were collected.
After the OSM-data was added it was obtained that some roads that the PUSTRAL-model
showed were not shown by the OSM-model. Two images showing the OSM- and the
PUSTRAL-model can be seen below. Because of the different degree of accuracy the OSM-
model is used for the research because it is more detailed.
Figure 10 - PUSTRAL-model Figure 11 - OSM-model
From the following pictures, which were taken during the field trip on 10.02.2016, can be
seen that there are some roads where bicycle paths are indicated/available and some where
they are not indicated/available. If the bicycle path is indicated with a dashed yellow line
there is no physical separation from the other traffic. During the field trip it was also
discovered that neither the PUSTRAL- nor the OSM-model show all roads within the area.
Especially small roads within the faculties, where it is possible to cycle or walk, are not
mapped. The following analysis of the roadway characteristics is not only for the roads of the
model, it also covers the small roads on the UGM campus. The information from the small
streets was collected by a field trip.
June 2016 Bachelor thesis Jan Engels – Final report 16
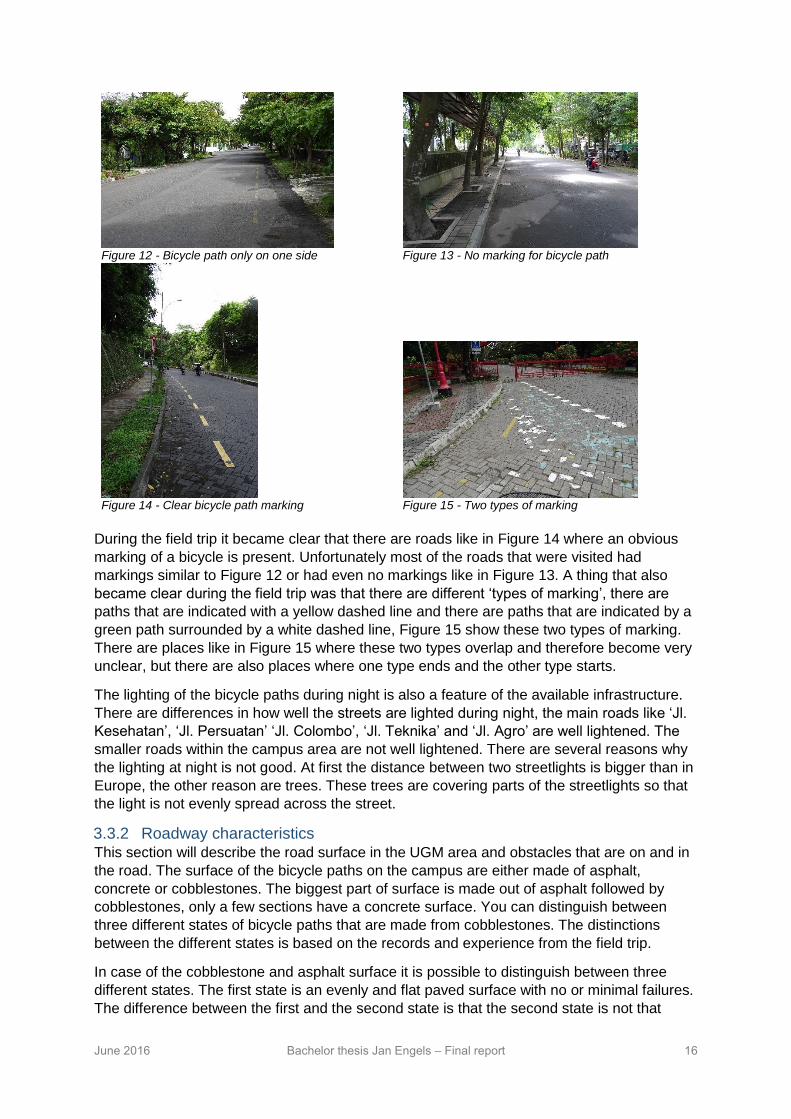
Figure 12 - Bicycle path only on one side Figure 13 - No marking for bicycle path
Figure 14 - Clear bicycle path marking Figure 15 - Two types of marking
During the field trip it became clear that there are roads like in Figure 14 where an obvious
marking of a bicycle is present. Unfortunately most of the roads that were visited had
markings similar to Figure 12 or had even no markings like in Figure 13. A thing that also
became clear during the field trip was that there are different ‘types of marking’, there are
paths that are indicated with a yellow dashed line and there are paths that are indicated by a
green path surrounded by a white dashed line, Figure 15 show these two types of marking.
There are places like in Figure 15 where these two types overlap and therefore become very
unclear, but there are also places where one type ends and the other type starts.
The lighting of the bicycle paths during night is also a feature of the available infrastructure.
There are differences in how well the streets are lighted during night, the main roads like ‘Jl.
Kesehatan’, ‘Jl. Persuatan’ ‘Jl. Colombo’, ‘Jl. Teknika’ and ‘Jl. Agro’ are well lightened. The
smaller roads within the campus area are not well lightened. There are several reasons why
the lighting at night is not good. At first the distance between two streetlights is bigger than in
Europe, the other reason are trees. These trees are covering parts of the streetlights so that
the light is not evenly spread across the street.
3.3.2 Roadway characteristics This section will describe the road surface in the UGM area and obstacles that are on and in
the road. The surface of the bicycle paths on the campus are either made of asphalt,
concrete or cobblestones. The biggest part of surface is made out of asphalt followed by
cobblestones, only a few sections have a concrete surface. You can distinguish between
three different states of bicycle paths that are made from cobblestones. The distinctions
between the different states is based on the records and experience from the field trip.
In case of the cobblestone and asphalt surface it is possible to distinguish between three
different states. The first state is an evenly and flat paved surface with no or minimal failures.
The difference between the first and the second state is that the second state is not that

June 2016 Bachelor thesis Jan Engels – Final report 17
evenly paved. Some cobblestones stand out or there are some holes in the asphalt and this
makes the surface less even. The last of the three states is the most irregular paved state. In
this state not only some cobblestones stand out or the asphalt has some holes, in this state
there are also obstacles in the path like manhole cover. The use of cobblestones as surface
has some problems, at some points in the area the cobblestones have sunk and therefore
created holes in the bicycle path. For the bicycle paths that have concrete as surface, there
is only one state because all paths have a similar state. The state of the concrete surface is
flat with some small holes between the abreast concrete section. Pictures from the field trip
which indicate the different states can be seen in appendix B.
Another topic that raised attention during the field trip were obstacles on the bicycle path.
The obstacles that are on the bicycle path are very different, mostly these obstacles are cars
parking on the bicycle paths. The problem of cars parking on the bicycle path were described
by people from PUSTRAL even before the field trip was executed. They indicated that as a
major problem. The other obstacles next to the cars are obstacles that were put on the
bicycle path to secure construction work or plants that hang into the bicycle path. An obstacle
that was put on the bicycle path for construction work can be seen in Figure 16. A picture of
a plant that is hanging into/blocking the bicycle path can be seen in Figure 17. Also there are
some speed bumps in the smaller streets within the faculties. These speed bumps stretch
across the whole width of the street including the bicycle paths.
Figure 16 - Obstacle for construction work Figure 17 - Plant hanging into the bicycle path

June 2016 Bachelor thesis Jan Engels – Final report 18
3.4 Traffic streams In this section the bicycle movements will be analysed. The most frequent used stations and routes
will be determined. After that these results are linked to the land use to obtain possible
relationships.
3.4.1 Bicycle movements To measure the performance of the system it is essential to determine the main bicycle
movements, this means how many trips are made and what the most favourable routes
within the campus area are. With the available data from 2015 it is possible to determine the
average number of borrowed bicycles per day and the routes between the most frequent
used stations. The following table shows the amount of borrowed bicycles per day. The low
amount of borrowed bicycles on Saturdays might be due to the fact that there is only a small
amount of classes on Saturday which means not so many people come to UGM.
Table 1 - Average number of borrowed bicycles per day
With the available data it is also possible to determine the most frequent used arrival and
departure stations.
Table 2 - Most frequent used stations in 2015
With the information from the most frequent used stations it is possible to determine the most
frequently used routes within the campus area. The following figure shows these routes in
red.
Figure 18 - Routes between most frequent used stations
Monday Tuesday Wednesday Thursday Friday Saturday
Average per day 447 474 455 445 345 5
Arrival Departure
Perpustakaan Perpustakaan
Gelanggang Teknik
Vokasi Taman Biologi
Taman Biologi Vokasi
June 2016 Bachelor thesis Jan Engels – Final report 19
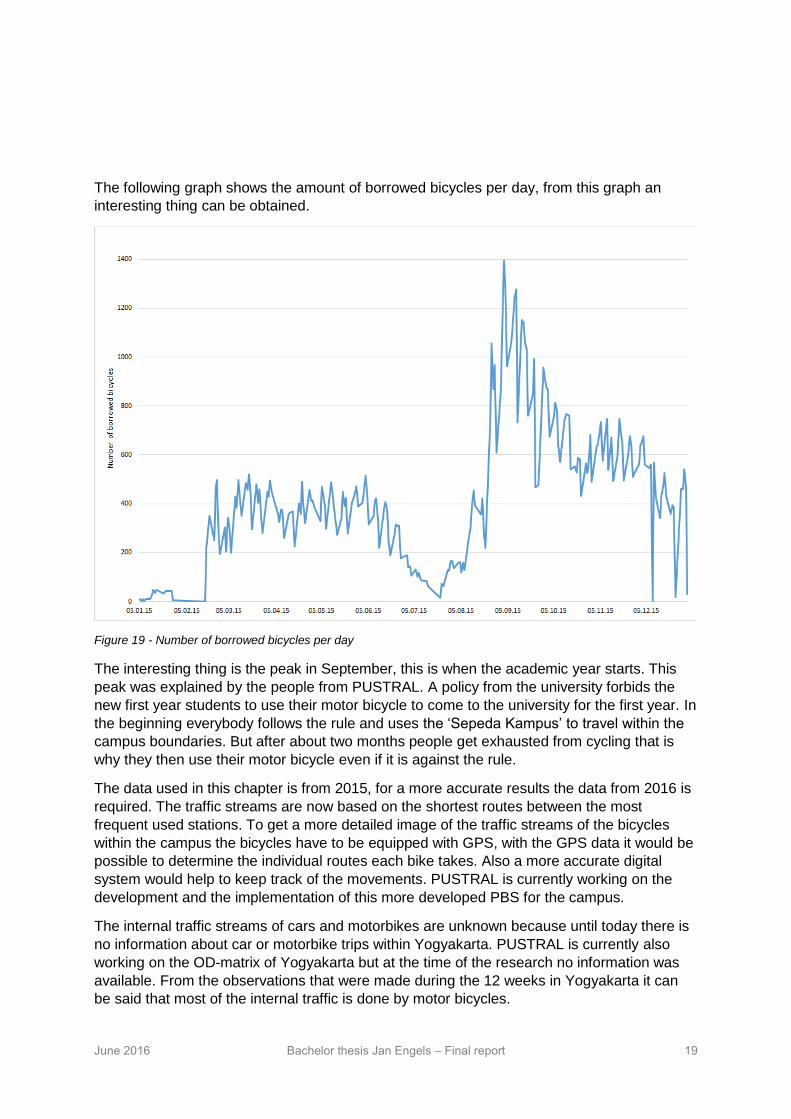
The following graph shows the amount of borrowed bicycles per day, from this graph an
interesting thing can be obtained.
Figure 19 - Number of borrowed bicycles per day
The interesting thing is the peak in September, this is when the academic year starts. This
peak was explained by the people from PUSTRAL. A policy from the university forbids the
new first year students to use their motor bicycle to come to the university for the first year. In
the beginning everybody follows the rule and uses the ‘Sepeda Kampus’ to travel within the
campus boundaries. But after about two months people get exhausted from cycling that is
why they then use their motor bicycle even if it is against the rule.
The data used in this chapter is from 2015, for a more accurate results the data from 2016 is
required. The traffic streams are now based on the shortest routes between the most
frequent used stations. To get a more detailed image of the traffic streams of the bicycles
within the campus the bicycles have to be equipped with GPS, with the GPS data it would be
possible to determine the individual routes each bike takes. Also a more accurate digital
system would help to keep track of the movements. PUSTRAL is currently working on the
development and the implementation of this more developed PBS for the campus.
The internal traffic streams of cars and motorbikes are unknown because until today there is
no information about car or motorbike trips within Yogyakarta. PUSTRAL is currently also
working on the OD-matrix of Yogyakarta but at the time of the research no information was
available. From the observations that were made during the 12 weeks in Yogyakarta it can
be said that most of the internal traffic is done by motor bicycles.

June 2016 Bachelor thesis Jan Engels – Final report 20
3.4.2 Land use In the introduction it was already mentioned that the land use might influence the usage of
the PBS. First a closer look at the available literature regarding the correlation between
bicycle usage and land use will be taken. The research ‘Land use effects on bicycle
ridership: a framework for state planning agencies’ states that ‘when land use diversity
increases, …, people tend to rely on non-automobile modes more frequently’. (Yuchen Cui,
Sabyasachee Mishra, Timothy F. Welch, 2014). Another study found that ‘stations in areas
with higher job or population density or stations with higher number of point of interests (such
as restaurants, retail stores and universities) in the vicinity experience higher arrivals and
departures’ (Alexander, 2012). To analyse if this is the case in Yogyakarta Figure 20 was
constructed. This figure shows the different types of land use and the location of the station.
From the previous section we know the most frequent used arrival/departure station. From
Figure 20 it can be seen that the most frequent stations are located in different land use
types. For the UGM campus it therefore can be concluded that it does not matter in which
land use type the station is located.
Figure 20 - Land use

June 2016 Bachelor thesis Jan Engels – Final report 21
3.5 Conclusions from characteristics After all characteristics from the ‘Sepeda Kampus’ bicycle sharing system are analysed it is
time to evaluate these characteristics. This will be done on the basis of the planning- and
design-guidelines which are developed by ITDP, the guidelines also include performance
metrics which examine the performance of a PBS. These guidelines can be divided into four
groups
Planning guidelines o Minimum system coverage area: 10km² o Station density: 10-16 stations per km² o Bikes/Residents: 10-30 bikes for every 1000 residents (within coverage area) o Docks per bike ratio: 2-2,5 docking spaces for every bike
Bike guidelines o Durable o Attractive o Utilitarian
Station guidelines: o Theft-proof locking mechanisms or security systems o Clear signage and use instructions o Quick and easy electronic bicycle check-in/check-out system
Performance metrics o System efficiency: average number of daily uses: 4-8 daily uses per bike o Market penetration: average daily trips per resident: one daily trip per 20-40
residents ((ITDP), 2013)
When applying these guidelines to the ‘Sepeda Kampus’ system one has to keep in mind
that these guidelines are developed for large scale PBS in big cities not for PBS on a
campus. However these guidelines are used to measure the performance. The ‘Sepeda
Kampus’ meets some of the requirements but not all. The coverage area and the station
density is way lower than suggested in the guidelines. In case of the bikes per residents
ration the system meets the requirements. At UGM about 70.000 people work and study,
with 1010 bicycles this results in about 14 bicycles per 1000 residents. The docks per bike
ratio is unknown at UGM. The bicycles of the system meet all requirements of the bike
guidelines. The station guidelines are nearly all met except the easy access guideline,
currently there are only a few stations which are electronic. Both performance metrics are not
met, the average number of daily uses per bike is about 0,4, this is 10 time lower than the
suggested guideline. The average daily trips per residents are at UGM are about 5 times
lower than the suggested guidelines.
To compare the performance of the ‘Sepeda Kampus’ system with other PBS from across
the globe the tripdata from other systems is required. This data is not available, but ‘The
Bike-share planning guide’ from ITDP provides the following image which shows the
performance of other PBS analysed by ITDP.

June 2016 Bachelor thesis Jan Engels – Final report 22
Figure 21 - Performance comparison between different PBS
The ‘Sepeda Kampus’ system was added to the image and it can be seen that the system is
in the left bottom quarter which means it has a low performance. Only the system from San
Antonio performance worse. The seven systems in the right top quarter meet the ITDP
performance metrics for a successful PBS.
According to the guidelines from ITDP the ‘Sepeda Kampus’ has some characteristics which
helps it to be effective, but especially the performance of the system is very bad. The
performance of the system is the main issue of this research. This research will help to
increase the travel demand of the system.
During this chapter the information about the system was collected and analysed. The
important information that were determined in this chapter are number of stations, location of
stations, elevation of the area, available infrastructure, quality of the road surface, lighting
during night and safety. All this information will be part of the survey in the next step. The
survey will ask participants about their attitude towards different aspects of the system.
This information is also required to answer the research questions. The research questions
that can be answered based on this chapter are the following
What are the characteristics of the bike sharing system at UGM?
o What are the physical characteristics?
What are the facilities of the system?
What is the available infrastructure on the area of UGM, what is its
quality and how is it being used by various modes?
o What are the spatial characteristics?
Where are the sharing stations located?
Which area does the system cover?
What is the topography of the area?
o What are the operational characteristics?
o What are the characteristics of the usage?
June 2016 Bachelor thesis Jan Engels – Final report 23
4. Construction of the survey After the system characteristics are identified the survey must be prepared, the setup of the
survey is the next step in the conceptual model. The survey is the central point of the
research, it must provide information about the users and possible users of the system and
their behaviour. Designing a survey consists of three different parts, the first aspect is the
sample, the second one is the method of data collection and the last one is the individual
questions. All three parts will be described in this chapter
4.1 The sample For the purpose of this research a simple random sample is used, this means a subset from
a population is chosen. The population in this case are all students, faculty members, staffs
and visitors from UGM. The exact size of the population is unknown because it is unclear
how many people visit the UGM area. What you certainly know, is that there were about
61.000 students and about 14.000 faculty members in 2015. A randomly selected subset of
individuals which will represent this population will be chosen. The survey will be a cross-
sectional survey which means that it is executed only once. Follow-up research may use the
results but this survey is not designed for longitudinal purposes.
4.2 The method The article ‘Collecting survey data’ (Research, 2016) presents the different advantages and
disadvantages of various survey collecting methods, these remarks were taken into account
while choosing the appropriate method for this research. For this research the survey will be
collected using the internet survey technique. It must be ensured that the survey is available
in English and Bahasa Indonesia so that the problem of language barrier is minimized. To
prepare the survey the ‘Google forms’ tool will be used. It allows to construct a survey with
different types of questions and then distribute it to the participants via E-mail. Another
advantage of this software is that all responses are directly transferred into a table-file which
makes it easier to analyse in SPSS. The survey was distributed via social media and the
official UGM-mail service, the UGM-mail service is the official E-mail system of UGM and
with this method about 70.000 persons received the survey.
4.3 The questions The questions of the survey need to help to answer the research questions, they must
provide information about the characteristics of the users, their behaviour and their opinion
on certain aspects of the system. To formulate the questions for this research different
scientific articles about the bicycle use on campuses across the world were analysed. The
articles which conducted a survey along students, faculty members and staff got special
attention. The researches were conducted at the following campuses:
Boise State University (USA)
University of Michigan – Flint (USA)
University of Idaho (USA)
University of Graz (Austria)
Universiti Teknologi MARA (Malaysia)
Autonomous University of Barcelona (Spain)
University of Sheffield (United Kingdom)

June 2016 Bachelor thesis Jan Engels – Final report 24
From these seven different researches it can be obtained that there are some topics which
each survey covers. Based on these researches the following three categories can be
distinguished:
1. General information – gender, age, occupation and car/motorbike ownership.
2. Cycling behaviour – how often people cycle using the ‘Sepeda Kampus’, how often
people cycle without using the ‘Sepeda Kampus’, and for which purpose they use it
3. Attitude towards cycling – how much do certain aspects affect their bicycle use
The survey that is going to be constructed for this research will cover these three different
topics. It will also cover a fourth option, this fourth option are questions about if their cycling
behaviour would change if different aspects of the bicycle sharing system would change.
This category is added to the survey to identify how the cycling travel demand could be
increased.
Before the questions start it is helpful to give a short description of the purpose of the survey
to help the participants to set the survey into context. This information must also be available
in Bahasa Indonesia. After the short introduction the participants will have to decide in which
language they would like to answer the questions. Based on this decision the questions will
appear to the participants in different languages.
4.3.1 General information The questions that are going to be asked in this section must provide information which will
help to group the participants. The first question of the research will be about the gender and
there will be two possible answers, male and female. The question concerning the age will
be an open question and this means the participants can give their own response. The next
general information that is going to be gathered is to which category of user the people
belong. For our analysis of the survey it is also important to know where the people
work/study. For this the following open question is added: ‘At which faculty do you
work/study?’. This is another an open question. The last general information is about if
people own a car, bicycle or a motorbike. The possible answers to all of these and the
following questions can be found in appendix C.
4.3.2 Cycling behaviour This section of questions will provide insights in the cycle behaviour of the users and
possible users of the bicycle sharing system. The first question is about how often people
use the bicycle sharing system. The participants will have to choose from a certain
frequency.
If people answered ‘I have never used the system’ in the previous question they will not have
to answer the following questions, the following three questions are special for people who
already use the system. To identify the purpose why people use the bicycle sharing system
the following question is asked: ‘For which purpose do You use the Sepeda Kampus?’
The next two question special for the users are: ‘What is your most used departure station?’
and ‘What is your most used arrival station?’. Both question can be answered by selecting
one of the sixteen stations. These two questions mark also the end of the section just for
users.
The next question, which will be for users and possible users again, will ask how often
people cycle without using the system. This question will indicate if there is a difference in
usage and attitude of people who cycle more often/ on a regular basis and people who do
not cycle at all. The question that will be asked is: ‘How often do you cycle without using the
‘Sepeda Kampus’ system’.

June 2016 Bachelor thesis Jan Engels – Final report 25
4.3.3 Attitude towards cycling To analyse the attitude towards cycling the bicycle motivators and barriers stated by
Rybarczyk and Gallagher and the aspects described by Titze et al are used. These two
researches have things in common, they both ask questions concerning the safety during
cycling, the travel distance, lighting at night, possibilities to park the bicycles, the social
support and the weather. Another thing that they have in common is that they both use a 4
point scaling system. This 4 point scaling system is used so that a direction can be obtained,
this means it can either be seen if the participant agrees or disagrees with an aspect. To
analyse the attitude of the participants towards cycling the things the survey have in common
are summarized to the following statements
The on-road safety on the campus is good
There are sufficient bicycle paths
The bicycle paths are well signed
There is sufficient lighting in the evening
There are enough stations to return the bicycle
The distance between stations is too long
The weather influences my bicycle use
It is attractive to cycle across the UGM campus
Seeing more bicyclists makes me want to cycle more
I am not interested in cycling because it is unpleasant
The question that is going to be asked is: ‘How much do you agree with the following
statements?’. The possible answers are strongly agree, agree, disagree and strongly
disagree.
4.3.4 Change in behaviour To analyse the possible change in bicycle behaviour a stated preference survey is used. In
this type of survey the choice of individual participants is made under experimental
conditions. The purpose of stated preference studies is to assess how respondents’ choice
vary in different hypothetical situations (Arif Wismadi, Prima Romadhona, Januar Praha,
2014). In a stated preference survey you can ask, “If you faced this particular situation, what
would you do?” (Sanko, 2001). For the stated conditions the respondent is faced with a
choice between a finite numbers of mutually exclusive alternatives (Stephane Hess, John M.
Rose, 2009). A stated preference survey instead of a revealed preference survey is used
because it should be analysed if people would use the bicycle sharing system more if things
that are not available yet would be present. With a revealed preference survey it is only
possible to analyse the current preference and not the future preference, which is why a
stated preference survey is used for this research.
At PUSTRAL people are already working on how to improve the ‘Sepeda Kampus’, for the
future they distinguish between six different groups of policies that will try to introduce to the
bicycle sharing system. These six groups of policies are:
1. Infrastructure policies
2. Operating policies
3. Supporting policies
4. Service policies
5. Regulation policies
6. Information policies

June 2016 Bachelor thesis Jan Engels – Final report 26
As earlier already mentioned this research will not focus on the operational aspects of the
system. This research will therefore focus on the following three types of policies:
infrastructure, supporting and service policies. These policies are also chosen because
PUSTRAL wanted to collect data about these specific policies. Within these policies there will
be actions that will try to improve the current system. The actions for each policy are:
Infrastructure policies
o A very safe dedicated lane only for bicycles
o Clearer marking
Supporting policies
o More stations
o Detailed description of the route to the other stations
Service policies
o Easier borrowing procedure
o Longer opening times
With these three categories it is possible to create seven different situations, the possible
combinations are:
1. Only infrastructure policies
2. Only supporting policies
3. Only service policies
4. Infrastructure and supporting policies
5. Infrastructure and service policies
6. Supporting and service policies
7. Infrastructure, supporting and service policies
The survey needs to present the participants a clear description of each policy so that the
participants know what policy will lead to which actions. The final survey with all questions,
answers and descriptions can be found in appendix C.
All the information of the stated preference section, this means names of the policies and
actions within the policies, were taken directly from the developments of PUSTRAL. The
suitability however of certain actions to certain policies can be questioned, for example ‘More
stations’ could also be an action within the infrastructure policies. ‘Detailed description of the
route to the other stations’ could also be assumed to be part of the service policy.
Nonetheless nothing was changed so that the results from this research can easily be sued
within PUSTRAL for further research.

June 2016 Bachelor thesis Jan Engels – Final report 27
5. Analysis This chapter will describe how the data that were collected with the surveys is going to be
analysed. There must be different steps executed to come to conclusions based on the data.
The steps are preparation of the data, transformation of the data, and analysis of the data
after the last step the results from this research will be compared with findings from other
similar researches. For the analysis of the data different types of statistics will be used. The
first type is descriptive statistics, with these descriptive statistics an initial description of the
data will be given. The other type of statistics are inferential statistics, this type is used for the
main conclusions from the data. The properties of the underlying distributions will be derived
by the analysis of the data. This type also helps to test hypothesis which result in conclusions
for the whole population based on the sample
5.1 Preparation of the data Because an online survey was used the answers of the respondents were immediately
imported into an excel file. In this file the answers to the same questions were presented in
different columns based on the language the participants had chosen. So the responses in
Bahasa had to be copied into the columns of the English responses. After the excel file was
entered into SPSS some adjustments of the data must be done. There are two different
types of question open and closed questions. In the case of closed questions the participants
can only select from the given answers, while in case of open questions people can fill in
their own answer. Both types of questions are analysed and transformed in the same way.
The given answers must be transferred into numerical values, this is necessary so that SPSS
can work with the data. The answers and accompanying numerical values can be found in
appendix D –‘Table 14’. Most of the answers are given by the survey but the questions ‘At
which faculty do you work/study?’ and ‘For which purpose do you mainly use the 'Sepeda
Kampus' system?’ have the possibility for participants to give their own answer. From the
different answers to the ‘work/study’ open question 26 different categories were formed,
these 26 categories where participants work or study are based on their responses. If
locations are close to each other like library and central office they get the same numerical
value. For the question for which purpose the participants use the system the open answer
option is included in case the participants do not use the system for one of the stated
purposes. Based on the answers to this open questions two categories are added, one is the
purpose of sport and the other is that people use it for more than one of the stated purposes.

June 2016 Bachelor thesis Jan Engels – Final report 28
5.2 Descriptive statistics This section is used to present some descriptive statistics of the results. These descriptive
statistics give an overview of the observations. The data was collected between the 29th
February 2016 and the 12th April 2016, in this period 2045 responses were collected. Of the
2045 responses 109 cases were excluded from the analysis because the participants did not
fill in all general information. After these cases were excluded 1936 valid cases are left for
the analysis. 40,8% of the participants are female and 50,9% are male. Based on their
answers it is possible to divide the respondents into age groups. The first three categories
are based on the study year, the other five categories are based on categories that are used
by similar researches. The following table shows the different age groups
Table 3 - Different portions per age group
The biggest group which answered the questions are the students, which could be expected
because the students are also the biggest group at UGM. 23,3% of the people and therefore
the highest amount work or study at the engineering faculty. About two fifth of the
respondents own only a motorbike followed by 16,2% which own a bicycle and a motorbike.
Figure 22 and Figure 23 visually represent these two results.
Figure 22 - Portion of different type of user Figure 23 - Portion of different vehicle ownership
Until now only the general information collected by the survey has been described, for this
reason the next descriptive statistics will describe the other three sections used in the survey,
the first is the cycling behaviour. Based on the answers to the question how often people use
the ‘Sepeda Kampus’ it is possible to determine two groups. The first group are people who
answered ‘Never’ they are the so called ‘Possible users’ of the system. The second group
are the people who already have used the system and therefore gave an answer between
Age Portion of the respondents
17 ≤ 18 (1st year) 8,4%
19 ≤ 20 (2nd year) 22,5%
21 ≤ 22 (3rd year) 17,6%
23 ≤ 25 15,5%
26 ≤ 30 11,3%
31 ≤ 40 13,1%
41 ≤ 50 8,6%
> 50 3,2%

June 2016 Bachelor thesis Jan Engels – Final report 29
‘Once a month’ and ‘Daily’. Of the total amount of valid responses 36,3% can be defined as
‘Possible users’ and 63,7% can be defined as ‘Users’. That was not expected because it was
assumed that the ‘Possible users’ group would be bigger than the ‘User’ group. If this values
are extrapolated and using that the average user cycles once a week, you would have about
2.300.000 bicycle movements per year and this is 22 times higher than what actually was
measured in 2015 (101.718 movements). So it can be assumed that the distribution between
possible users and users is not representative for the whole UGM population. This could be
explained by the fact that users are more interested in this research than potentially users.
The next thing in cycling behaviour are the arrival and departure stations, Figure 33 in
appendix D shows the portion of trips leaving and arriving from each station. From Figure 33
it can be seen that there are on the one hand stations which have more arriving than
departing trips and on the other hand there are stations which have more departing than
arriving trips. The huge difference at station number 2 ‘Gelanggang’ can be explained by the
fact that there is a bus station and parking area close to ‘Sepeda Kampus’ station. At the end
of the day, that is how the people from PUSTRAL explained it, people use the ‘Sepeda
Kampus’ to go to ‘Gelanggang’ and then go home. The difference in portions of arriving and
departing at station number 6 ‘Teknik’ can be explained by looking again at the elevation.
The engineering faculty is located higher than the campus which makes it unattractive to
cycle there but attractive to leave from there because people can easily cycle downhill.
The next descriptive statistics will focus on the section of the survey which presented various
statements to the participants. Again we will distinguish between two groups, the first group
are respondents who agree with the statement and the second group are participants who
disagree with the statement. From the following table which shows the ‘agree’ (‘Strongly
agree’ & ‘Agree) and ‘disagree’ (‘Strongly disagree’ & ‘Disagree’) portion per statement it can
be seen that there is normally a 50/50 distribution between agree and disagree except for
five cases.
Table 4 - 'Agree' and 'Disagree' portion per statement
To explain these differences it is necessary to look at the way the statements were asked. In
the case of the ‘Sufficient lighting’ the high portion of ‘Disagree’ means that most people think
that there is not sufficient lighting during the night. In the case of ‘Weather’ the high portion of
‘Agree’ means that the weather influences the bicycle use of most people. The high portion
of ‘Agree’ respectively ‘Disagree in the other three statements means that most people think
that it is attractive to cycle across the campus and that if they would see more cyclists they
would also cycle, also the most people think that cycling is not unpleasant. The outcome
from the ‘It is attractive to cycle across the UGM campus’ statement is also interesting
regarding the elevation of the campus. In section ‘Aggregate characteristics’ the elevation
was examined and concluded that there are small to big elevations all across the campus.
Statement Agree Disagree
The on road safety on the campus is good 50,20% 49,80%
There are sufficient bicycle paths 43,03% 56,97%
The bicycle paths are well signed 47,69% 52,31%
There is sufficient lighting in the evening 30,94% 69,06%
There are enough stations to return the bicycle 46,86% 53,14%
The distance between stations is too long 55,03% 44,97%
The weather influences my bicycle use 85,41% 14,59%
It is attractive to cycle across the UGM campus 76,29% 23,71%
Seeing more bicyclists makes me want to cycle more 82,45% 17,55%
I am not interested in cycling because it is unpleasant 9,97% 90,03%

June 2016 Bachelor thesis Jan Engels – Final report 30
However looking at the outcomes from the statement it can be said that these elevations
does not make the campus unattractive to cycle.
The last section of the survey presented different policies to the respondents, they should
then decide how likely it is that they will use the ‘Sepeda Kampus’ after the introduction of the
policies. Again two different groups based on the responses were formed, the one group the
will use the system and the one that will not use the system. The portion of people who will
use the system after the introduction is in all cases, single policies and combinations of
policies, higher than 80%.
5.2.1 Characteristics of the main user The main user is a male student which is about 20 years old, he studies at the engineering
faculty and owns only a scooter. He uses the ‘Sepeda Kampus’ system about once a month
or a bit more frequent, he uses the system to travel across the campus between UGM
buildings. The bicycle for his trip is picked up and returned at the ‘Perpustakaan’ station
5.3 Inferential statistics There are various methods how to come to conclusions that will help to answer the research
questions. In this section the terms regression and correlation are frequently used, for this
reason a short description of these terms is given. ‘Regression and correlation measure the
degree of relationship between two or more variables in two different but related ways.’
(Pidwirny, 2006). The difference between these two things is that correlation measures the
association between two or more variables. In regression two or more independent variables
are used to predict the value of one dependent variable. To calculate correlation coefficient
the data analysis option of SPSS is used. This tool calculates the correlation coefficient
between variables. The possible outcomes can vary between -1,00 and 1,00. The closer the
correlation coefficient gets to -1,00 or 1,00 the stronger is the linear (negative or positive)
relation between two variables. A correlation coefficient close to 0,00 indicates that there is
no relation between the variables.
To answer the research questions which will help to come to the main conclusion from the
research, different hypothesises are constructed. These hypothesises are then tested and
based on their outcomes it will be possible to answer the research questions. For this reason
it is important to construct hypothesises that are crucial to the research. To do this two things
have to be taken into account, first the comparison between users and possible users and
the second the research questions.
From the conceptual model in Figure 1 it can be seen that this research will compare the
possible users and the users of the ‘Sepeda Kampus’ system. It is expected that these two
groups answer statistically significant to various question. An exception from this is the
comparison between the social economic characteristics of the two groups, it is expected
that these characteristics are not statistically significant between the groups. From Figure 1 it
can also be seen that the factors of importance in cycling will be compared. In this
comparison it is expected that the users name other factors than the possible users.

June 2016 Bachelor thesis Jan Engels – Final report 31
5.3.1 Comparison user with possible user – Social economic characteristics In this section the following hypothesis will be tested:
‘The socio-economic characteristics of users and possible users are not statistically
significant different’.
In total there are 1936 valid responses, based on the answers 702 (36,3%) can be defined
as possible users and 1234 (63,7%) as users. The survey consists of questions about
gender, age, type of user, place of work (faculty) and vehicle ownership. All these elements
are socio-economic characteristics. Table 15 in appendix D gives an overview of the social
economic characteristics of users and possible users. From the visual inspection of the table
no big differences between users and possible users can be obtained. To test if there is no
statistically significant difference between users and possible users a statistical test will be
executed. The statistical test that is going to be used is the independent t-test, this test
‘compares the means of two independent groups in order to determine whether there is
statistical evidence that the associated population means are significantly different‘
(University K. S., 2016). The results from the t-test can be seen in Table 22 in appendix D.
From the comparison of gender, age categories and faculty (place of work) it can be
concluded that there are statistically significant differences between users and possible users
of the system. The ‘User’-group have a higher female portion and is on average 2 years
younger than the ‘Possible user’-group. The statistically significant difference in average age
can be explained by the fact that younger people are more active and therefore cycle more
while possible users are less active and therefore not attracted to cycling. A reasonable
explanation for the statistically significant difference in place of work and gender cannot be
found. So the hypothesis can be rejected based on the results because three of the five
categories are statistically significant different which leads to the conclusion that for the most
part the users and possible users of the ‘Sepeda Kampus’ have different social economic
characteristics.
5.3.2 Comparison user with possible user – Statements on characteristics and factors Again from the conceptual model in Figure 1 it can be seen that the following comparison
between users and possible users is based on the ‘Attitude towards cycling’ section of the
survey. The people in the ‘Possible user’ category may have not experienced the
characteristics during cycling with the ‘Sepeda Kampus’ but they still have an opinion on the
characteristics from their movements on the campus. It is expected that the possible users
value the statement lower than the users of the system, this means the responses from the
possible users are more into the negative direction. Table 5 gives a general impression of
how many participants agree or disagree with each statements. In this table the responses
are summed up to two categories, in Table 16 in appendix D the frequency of each answer
per statement per user category can be seen.
Table 5 - 'Agree-' or 'Disagree-portion' per statement per user category
Possible user User Possible user User
Agree 48,84% 50,98% Agree 62,46% 50,80%
Disagree 51,16% 49,02% Disagree 37,54% 49,20%
Agree 38,54% 45,61% Agree 85,38% 85,43%
Disagree 61,46% 54,39% Disagree 14,62% 14,57%
Agree 42,79% 50,49% Agree 70,47% 79,61%
Disagree 57,21% 49,51% Disagree 29,53% 20,39%
Agree 33,07% 29,73% Agree 81,40% 83,05%
Disagree 66,93% 70,27% Disagree 18,60% 16,95%
Agree 45,74% 47,50% Agree 14,55% 7,35%
Disagree 54,26% 52,50% Disagree 85,45% 92,65%
Weather influences
Attractive to cycle
Seeing more bicyclists
Cycling is unpleasant
Statements Statements
On-road safety
Sufficient bicycle paths
Well signed paths
Sufficient lighting
Enough stations
Distance between station
June 2016 Bachelor thesis Jan Engels – Final report 32
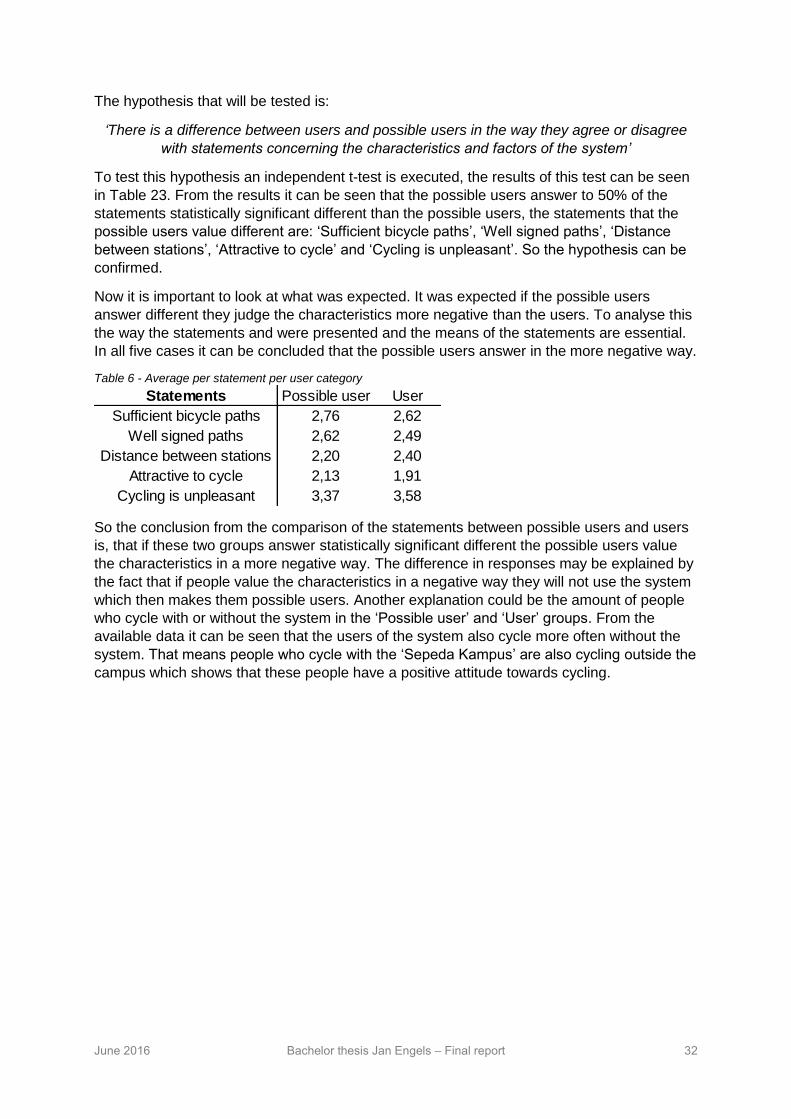
The hypothesis that will be tested is:
‘There is a difference between users and possible users in the way they agree or disagree
with statements concerning the characteristics and factors of the system’
To test this hypothesis an independent t-test is executed, the results of this test can be seen
in Table 23. From the results it can be seen that the possible users answer to 50% of the
statements statistically significant different than the possible users, the statements that the
possible users value different are: ‘Sufficient bicycle paths’, ‘Well signed paths’, ‘Distance
between stations’, ‘Attractive to cycle’ and ‘Cycling is unpleasant’. So the hypothesis can be
confirmed.
Now it is important to look at what was expected. It was expected if the possible users
answer different they judge the characteristics more negative than the users. To analyse this
the way the statements and were presented and the means of the statements are essential.
In all five cases it can be concluded that the possible users answer in the more negative way.
Table 6 - Average per statement per user category
So the conclusion from the comparison of the statements between possible users and users
is, that if these two groups answer statistically significant different the possible users value
the characteristics in a more negative way. The difference in responses may be explained by
the fact that if people value the characteristics in a negative way they will not use the system
which then makes them possible users. Another explanation could be the amount of people
who cycle with or without the system in the ‘Possible user’ and ‘User’ groups. From the
available data it can be seen that the users of the system also cycle more often without the
system. That means people who cycle with the ‘Sepeda Kampus’ are also cycling outside the
campus which shows that these people have a positive attitude towards cycling.
Statements Possible user User
Sufficient bicycle paths 2,76 2,62
Well signed paths 2,62 2,49
Distance between stations 2,20 2,40
Attractive to cycle 2,13 1,91
Cycling is unpleasant 3,37 3,58

June 2016 Bachelor thesis Jan Engels – Final report 33
5.3.3 Comparison user with possible user – Biggest barrier in cycling In the previous section it was analysed to which statements the two groups answer different,
this section will focus on the biggest, so called, barrier why people do not cycle. The biggest
barrier is the characteristic that is valued in the most negative way. To identify the biggest
barrier some adjustments in the data have to be done, the numerical values of the ‘Distance
between stations’, ‘Weather’ and ‘Cycling is unpleasant’ must be inverted. Also the
statements are split up into subjective feelings of the participants and objective factors that
have to deal with the system. The objective characteristics are very interesting because they
influence the bicycle use and can be easier influenced than the subjective feelings. The
following two tables show the results.
Table 7 - Objective characteristics
Table 8 - Subjective feelings
We see that the insufficient lighting during night the biggest barrier is why people do not use
the system. The second thing of the objective characteristics where the participants are not
happy about are the amount of bicycle paths respectively the distance between the stations.
That the possible users are not happy about the distance between the stations could be
expected because many other researchers identified the distance people have to cycle as an
important factor in choosing the bicycle as mode of transportation.
Regarding the subjective feelings of the participants two things need to be mentioned. The
first thing to mention is that it was expected that the safety is the biggest barrier because all
other researches on PBS and bicycle use identified safety as the biggest barrier. The reason
why the on-road safety in Yogyakarta is less important to the participants might be explained
by the in general more unsafe traffic. The traffic in Yogyakarta is like in many other Asian
cities dominated by motorbikes and very chaotic which leads to unsafe situation. The road
users are therefore used to unsafe situation on the road. The second thing that need to be
mentioned is the possible reason why people identified the weather as the biggest barrier.
The annual average temperature in Yogyakarta is 26,4°C with an average precipitation of
2157mm, this high temperature in combination with the high humidity makes bicycle trips
very exhausting. Another thing that can be concluded from the analysis of the biggest barrier
is that people find cycling pleasant and that if they would see more cyclists they would also
cycle.
According to the ITDP measures the station density is to low, it is interesting to look what the
participants think about the station density. The survey included two question that deal with
the station density, one regarding the amount of stations and one regarding the distance
between stations. The amount of stations and the distance between stations are directly
linked with each other. More than 50% of both groups, possible users and users, disagree
User Mean Mean Possible user
Sufficient lighting 2,91 2,86 Sufficient lighting
Sufficient bicycle paths 2,62 2,80 Distance between stations
Enough stations 2,61 2,76 Sufficient bicycle paths
Distance between stations 2,60 2,62 Enough stations
Well signed paths 2,49 2,62 Well signed paths
User Mean Mean Possible user
Weather 3,34 3,39 Weather
On-road safety 2,49 2,56 On-road safety
Attractive to cycle 1,91 2,13 Attractive to cycle
Seeing more bicyclists 1,75 1,77 Seeing more bicyclists
Cycling is unpleasant 1,42 1,63 Cycling is unpleasant

June 2016 Bachelor thesis Jan Engels – Final report 34
with the fact that there are enough stations to return the bicycles. Also both groups say that
the distance between the stations is too long. The responses from the participants match the
outcomes of the ITDP guidelines that the amount of stations is too low.
5.3.4 Summary statements on characteristics The previous sections focussed on the analysis of the ‘Attitude towards cycling’ section of the
survey and in special the comparison of the results of possible users and users of the
‘Sepeda Kampus’. An important conclusion is the answer to one of the research questions,
by looking at the frequency of usage and the objective characteristics it can be said that
there is a relation between three characteristics of the system and the travel demand.
Another conclusion that can be drawn is that the biggest barrier overall the weather is why
people do not use the ‘Sepeda Kampus’ system. If we look at the objective factors which
influence the bicycle use both identify the insufficient lighting during the evening as major
barrier, the other characteristics are valued different by the possible user and the user of the
‘Sepeda Kampus’. From the first comparison of statements it can be concluded if the two
groups answer statistically significant different the possible user group answer always in the
more negative way than the users.
All this results will be used at the end of this report in the conclusion section to answer the
main research question and make recommendations based on the findings.
5.3.5 Analysis introduction of policies The preceding sections focussed on the ‘Attitude towards cycling’-part, now the focus will be
on the last section of the survey. The analysis of the last section will focus on possible
differences between the introductions of the policies. For this reason the policies are
compared with each other, to examine possible differences a paired sample t-test is used.
This statistical test is used because ‘the paired samples t-test compares two means that are
from the same individual, object, or related units’ (University K. , 2016). A distinguishing
between possible users and users of the system will be made. This differentiating is
important to obtain possible differences in preferences of the two different groups. Also this
distinction helps to give a more precise advice for the improvement of the ‘Sepeda Kampus’
system.
In both cases, possible users and users, first a comparison between the single policies is
done, after that combinations of policies are compared. In the end all single policies and
combination of policies are compared with the introduction of all three policies. With these t-
tests it can be seen which single policy and combination of policies is most favourable. It is
expected that the introduction of all three policies is the most favourable, this is why the
introduction of all three policies is compared with all possible policies and combinations of
policies.
Before the analysis and interpretation of the results it is helpful to recall the numerical values
that were assigned to the possible answers. Also Table 17 until Table 21 summarize the
results of the stated preference section of the survey.
Table 9 - Possible answers to the introduction of policies
Possible answer Numerical values
Certainly I will use the ‘Sepeda Kampus’ system 1
Probably I will use the ‘Sepeda Kampus’ system 2
Doubtful 3
Probably I will not use the ‘Sepeda Kampus’ system 4
Certainly I will not use the ‘Sepeda Kampus’ system 5

June 2016 Bachelor thesis Jan Engels – Final report 35
5.3.5.1 Comparison between policies – Possible users The results of the paired sample t-test can be found in Table 24, here only the striking results
will be discussed. From the twelve different tests that were executed it can be seen that there
is only one comparison that has a p-value higher than 0,05. The possible users answer
statistically significant different to the introduction of infrastructure & service and supporting &
service. To interpret this result a closer at the two means has to be taken. The infrastructure
& service policy has a lower mean, which means more people will use the system after the
introduction of this policy compared to the introduction of the supporting & service policy.
This result is remarkable because both combinations include the service policy and by
combining it with either the infrastructure or supporting policy one becomes more attractive
than the other. That the infrastructure & service policy is favourable compared to the
supporting & service policy was not expected because if we look at the statements again the
possible users value the distance between stations more negative than the sufficient bicycle
paths. So it could have been expected that the possible users want to reduce the distance
between the stations, which is part of the supporting policy. Nevertheless the possible users
prefer a combination of the infrastructure and service policy, maybe because the
infrastructure policy also increases the on-road safety which is also an issue for the possible
users.
In all other eleven comparison there are no statistically significant differences between the
policies. In this eleven cases it therefore does not matter which policy will be introduced
because they are evenly effective. This is remarkable because it can be concluded that the
single policies are just as effective as the introduction of all three policies.
The last thing that need to be mentioned are the high values of the correlation, these high
values show that there are strong linear correlations. This strong linear correlation means if
the participant answered that he will not use the system in one question it is very likely that
he will also give the same answer in the following question. This leads to the conclusion,
people who say that they will not use the system will never use the system regardless the
policies.
5.3.5.2 Comparison between policies – Users The previous section focussed on the answers of the possible users, this section will analyse
the responses of the users of the system. Again only the striking results will be discussed,
the detailed results can be find in Table 25. While interpreting the results one has to keep in
mind that the users already use the system, so if one policy is favourable this means the
people will use the ‘Sepeda Kampus’ more frequently than now.
Of the twelve comparison only two have a p-value higher than 0,05. The responses to the
introduction of the infrastructure policy were statistically significant different to the
introduction of the supporting policy. The supporting policy has a lower mean which means
on average more people will use the system more often after the introduction of this policy.
The result that the infrastructure policy is more favourable than the supporting could have
been expected for the users. For bicyclists an own dedicated lane is very attractive because
it increases the safety and the comfort during the trip. The supporting policy is less attractive
for the users of the system because they are used to cycle and the distance between the
stations (number of stations) is not a big issue for them.
June 2016 Bachelor thesis Jan Engels – Final report 36
The other comparison where the respondents answered statistically significant different is the
comparison between the infrastructure & supporting and the infrastructure & service policy.
The infrastructure & supporting policy has a lower mean, 1,571, compared to the
infrastructure & service policy, 1,572. This means after the introduction of the infrastructure &
supporting policy more people will use the system more frequent compared with the
infrastructure & service policy. The remarkable at this question is that the two question have
a mean which is nearly the same but they are still statistically significant different, this can be
explained by the high standard deviation of both questions.
For the users group it is also discovered that the introduction of all three policies is just as
effective as the introduction of any single policy.
5.3.6 Summary statements on characteristics After the analysis of the last section of the survey various things can be concluded. If one
only looks at the mean the introduction of all three policies would be most effective for users
and possible users. The statistical tests however show that the answers to the single policies
are statistically not significant different to responses to all three policies. The service policy
has for both groups, users and possible users, the lowest mean which means after the
introduction of this policy the most people will use the system or use the system more
frequently.
The results from the statistical tests show that the responses to the introduction of the
policies are in general all the same this means that there is not one single policy or
combination of policies which is the most effective. So when choosing which policy or
combination should be introduced other factors like initial investments and annual costs have
to be taken into account.

June 2016 Bachelor thesis Jan Engels – Final report 37
6. Critical review From Figure 1 it can be seen that all elements from the grey area lead to the findings from
UGM. The last step of this conceptual model is to compare these findings with findings from
other researches about the bicycle behaviour at university campuses. To compare systems
first a closer look at other systems must be taken, for this reason the next section will
describe five different researches that will be used for the comparison.
6.1 Findings from other systems In the chapter ‘Construction of the survey’ the researches that are going to be used for the
comparison are already introduced. Unfortunately there are no researches which focus on a
bicycle sharing system just for a campus. There are plenty of researches about bicycle
sharing systems all across the globe. The problem is that these systems are all bigger, more
bicycles, users and bigger area of influence, than the system for the UGM campus, an
appropriate comparison is therefore not possible. Therefore researches about the bicycle
usage and cycling behaviour on campuses across the globe are used. The following table
will give an overview of the campuses that are going to be used for the review.
Table 10 - University campuses used for review
University Area Students
Gadjah Mada University 201,6 ha 61.000
Boise State University 71 ha 22.259
University of Michigan – Flint 530 ha 8289
University of Idaho 640 ha 11.543
University of Graz - 31.580
Autonomous University of Barcelona 226 ha 56.228
Madrid University Campus 345 ha 112.871
From this table it can be seen that there are university campuses which have a bigger area
than the UGM but less students than UGM, Michigan and Idaho. The campus of the
Autonomous University of Barcelona is the one which has similar characteristics with the
UGM campus. For each research a short fact sheet is made to give an impression of the
results. The exact outcomes will be used and described in the ‘Comparison with the findings
from UGM’ section.
Boise State University:
68% female, 32% male
Most frequent purpose of cycling: transportation (62%) and recreation (42%)
Students who cycle for transportation cycle regardless the distance
Students who cycle are younger and live closer to the campus
Distance matters to cyclists
University of Michigan:
61% female, 39% male
Outcomes from students do not agree with the outcomes from faculty members
Education, safety and higher automobile costs may cause faculty members to cycle
More visible cycling culture may cause students to cycle more
University of Idaho:
Seasonable variations in commuting choice, in warmer months non-motorized traffic increases
Difference in commuting choice between male and female
Female students are less receptive to non-motorized transportation
Female indicate topography and safety a bigger issue than male participants

June 2016 Bachelor thesis Jan Engels – Final report 38
University of Graz:
44,6% female, 55,4% male
Students who consider the traffic safety on their way to the university as high are 45% less likely to cycle regularly than those who rate the traffic safety low
People who associate cycling with pleasure are twice as likely to cycle regularly
If friends cycle to university other students are more likely to cycle to university as well
Autonomous University of Barcelona (UAB):
58,4% female, 41,6% male
Different transport patterns between students and staff due to socio-demographic characteristics
Unsatisfied demand for non-motorized transportation modes due to inadequate infrastructure
On the Madrid University campus four different universities are located, Fernández-Heredia,
Monzón and Jara-Díaz tried to analyse the cyclist’s perception. The Madrid University
campus planned to build a 4th generation bicycle sharing system. Until now there is no
further research about this bicycle sharing system in particular so the research about the
bicycle use at the campus must be used. ‘The main conclusion is that convenience (flexible,
efficient) and exogenous restrictions (danger, vandalism, facilities) are the most important
elements to understand the attitudes towards the bicycle.’ (Álvaro Fernández-Heredia,
Andrés Monzón, Sergio Jara-Díaz, 2014)
6.2 Comparison with the findings from UGM When comparing the results from the other researches with the findings from UGM one has
always to keep in mind that the ‘Sepeda Kampus’ is a bicycle sharing system especially
designed for a campus. The other researches focussed on cycling behaviour in general so
when comparing the results one has to be careful.
The first comparison is between the Boise State University and UGM. A thing one will notice
is the difference in gender distribution at UGM 60,9% of the respondents were male while at
the Boise State University only 32% were male. This differences can possible be explained
by a different gender distribution across the two universities. The next thing analysed in
Boise is for which purpose the people use bicycles, the most given answer in Boise was for
transportation followed by recreation. The problem with these results is that it can be
assumed that these answers are collected in a different way than the research at UGM used.
This can be assumed because the two portions (transportation and recreation) of usage add
up to 102%. The most frequent purpose of usage at UGM is to travel across the campus
between UGM buildings. The difference between the most frequent purposes of usage can
be explained by the fact that the system at UGM is a sharing system. This means it is
specially designed to travel across the campus and at Boise State University the research
analysed the general bicycle behaviour. A thing that was discovered in Boise and Yogyakarta
is the difference in age between people who cycle and those who do not cycle.
Like the Boise State University, the University of Michigan has a very different gender
distribution than the University Gadjah Mada, again this can possible be explained by a
different gender distribution across the whole university. The research in Flint found out that
the students answered different than the staff. At UGM this was also found except for five of
the sixteen compared outcomes. The statements where students and staff of UGM do not
agree are ‘The distance between stations is too long’, ‘The bicycle paths are well signed’
‘There are enough stations to return the bike’, the introduction of the infrastructure policy and
the introduction of the service policy. To analyse why there is a difference between the

June 2016 Bachelor thesis Jan Engels – Final report 39
results from Yogyakarta and Flint the results from Flint are needed, without them it is difficult
to say how and why there are differences. The fact that students would cycle more if they
see an active cycle culture was discovered in both researches in Flint and at UGM. This
similarity in results can be explained by the fact if people see more cyclists the public
acceptance to cycle will increase and therefore people are thinking more about using
bicycles for transportation, this fact can be obtained in different countries and or cities.
The influence of the weather was discovered in Idaho and Yogyakarta. For Yogyakarta it is
not possible to distinguish between the four commonly known seasons, in Indonesia they
distinguish between rain and dry season. In total 85% (‘Strongly agree’ and ‘Agree’) of the
respondents said that the weather influences their bicycle use. In both cases, Idaho and
UGM, the results can be explained by the fact that during cycling the people are directly
exposed to the weather. For the system at UGM this means that people have to cycle within
a climate with high temperatures which will lead to that they will sweat what most people find
unpleasant. In Idaho it might not be the heat but the rain, it has the same effect, people get
wet and this is unpleasant. The difference in safety perception between female and male that
was found at the University of Idaho was not discovered for the UGM system. Women and
men gave no statistically significant different answer to the statement ‘The on-road safety on
the campus is good’. The difference between men and women in cycling was discovered in
Idaho and also for ‘cycling without the system’ for this research, however there is no
difference in usage of the system between the gender. How this is possible is difficult to say,
this result was presented to people of PUSTRAL but they also did not have answer to the
differences.
The different frequency of cycling, which was discovered by the research at the University of
Graz, based on the safety perception was not discovered by the research on the ‘Sepeda
Kampus’ there is no statistically significant difference in cycling between the people who
agree or disagree with the ‘safety-statement’. The fact that a higher safety perception would
lead to more cycling that was, according to the research from Graz, find at many other
researches is also discovered by the research in Yogyakarta. The result that people who find
cycling pleasant cycle more can be find in both researches, University of Graz and UGM.
Like the research from UAB the research at UGM found differences in the frequency of
cycling between students and staff of the university. The research from UAB argued that it is
due to different socio economic factors, this can be confirmed by the research from UGM.
The age and ownership of staff and students are statistically significant different. The
difference in the frequency of cycling may be caused by the reason that staff from the
university owns more money which allows them to drive a car so that they do not have to
cycle while students have to walk or cycle. For the comparison between the findings from
UGM and the results from Madrid it is helpful to look at the ‘Conceptual model of factors
affecting bicycle use’ this model can be found in Figure 24 .
In case of the UGM research some of the relations can be found while other cannot be
found. That some relations cannot be found might be due to the reason that the research that
was executed at UGM did not cover all aspects shown in the conceptual model. The biggest
barrier that was identified by the research in Madrid was the safety issue, while in
Yogyakarta the biggest barrier the weather is. This difference can be explained by the
different climate in the two cities, the high temperature and high humidity in Yogyakarta is a
reason not to cycle. A finding from Madrid that can be confirmed by the research from UGM
is the relationship between frequency of cycling and the positive attitude towards cycling.
Another conclusion, to promote cycling in Madrid, is that efficiency and ecological aspects
are most important for people to cycle more. At UGM it was discovered if only one policy

June 2016 Bachelor thesis Jan Engels – Final report 40
could be introduced the service policy is the most favourable, this policy includes the
efficiency aspect.
Figure 24 - Conceptual model of factors affecting bicycle use
6.3 Summary comparison with other system From the comparison with other systems it becomes clear that there are some researches
about other systems where the research from UGM agrees with but there are also results
that are different between the systems and researches. The research that was executed at
UGM has a higher male portion than female portion, this is different from all other researches
that was used for the comparison which have a higher female portion than male portion. A
thing that all researches and the one at UGM discovered is that if the safety perception
increases the frequency of cycling increases. Most of the other researches indicted the
safety issue as the most influential from the research at UGM it can be concluded that other
factors are more important to the decision to cycle or not than on-road safety. Another thing
that become clear is if one thing is compared with two different systems it can lead to
different results. For an example at UAB a difference in outcomes between students and staff
was observed while at the University of Michigan the opposite was obtained, students and
staff answer the same. The results from UGM tend more into the directions of the results
from Michigan, however in five of the sixteen categories students answer different then staff
from UGM.
June 2016 Bachelor thesis Jan Engels – Final report 41
7. Conclusions Subsequently to the critical review the conclusions will be drawn on the basis of the different
findings and analysis. This chapter will give an answer to all research-questions and sub-
questions. First the sub-questions will be answered followed by the main research question:
Which factors influence the bicycle travel demand of the bike sharing system at Gadjah-
Mada University in Yogyakarta?
This structure is chosen because in this way first the basics of the system and research are
described. After the conclusions are drawn recommendations will be made based on the
conclusions. These recommendations will present specific points which should help the
operator of the system and policy maker of UGM to improve the system so that the bicycle
travel demand can be increased. Some sub-questions and research-questions are already
partially answered in the previous chapters, this chapter will again sum up these results.
The first sub-question that will be answered is:
What are the characteristics of the bike sharing system at UGM?
The system uses 1010 bicycles that can be picked up and returned at 16 different stations.
These stations consist of two types of shelters, one type that is permanently at the station
and the second type that can be moved between different stations to guarantee a sufficient
amount of bicycles at each station. The roads on the UGM campus are either made of
asphalt, cobblestones or concrete, these roads are available for all modes of transportation.
There is a small amount paths within the faculties which can only be used by bicycles or
people who walk. The quality of the infrastructure varies throughout the campus. The sharing
stations are located across the campus, the exact location, GPS-coordinates, can be seen in
appendix B. The area which the system covers is limited by the regulations of the system,
people are only allowed to use the bicycles within the area of the UGM campus, which
means the system covers the UGM campus area. The campus is located between 122,25m
and 143,5m above sea-level and has an average gradient of 1%, the steepest elevation is
5% along 273m. The ‘Sepeda Kampus’ systems can be used from Monday till Saturday, the
various opening times are describe in the chapter ‘How to use the system’. Before one can
leave the sharing stations the user has to be registered by an officer of the station. Students,
academic staff, non-academic staff and visitors of the Gadjah Mada University can use the
system, the biggest group which uses the system are the students.
The following sub-question that will be answered is:
How are the characteristics from UGM similar or different to characteristics from comparable
systems?
The difficulty in this question lies in the fact that there are no researches available that
directly deal with a bicycle sharing system especially designed for a campus. There are on
the one hand articles about researches that investigate sustainable transportation methods
for campuses, these researches frequently advice to start a bicycle sharing system. On the
other hand there are many researches about bicycle sharing systems all across the globe,
the problem with these researches is that the systems are bigger than the system used at
UGM and an adequate comparison is therefore not possible. So unfortunately this sub-
research question cannot be answered. However researches about the bicycle behaviour at
various universities were analysed to construct the survey and to compare the findings on
how to increase the travel demand. Unfortunately these researches do not describe the
characteristics of the certain campus.
June 2016 Bachelor thesis Jan Engels – Final report 42
The answer to the sub-question
Is there a relationship between the characteristics of the system and the travel demand?
was find by the data analysis. By comparing the answers to the different statements between
the different frequencies of usage it was discovered that the more positive people are about
the statements the more they use the ‘Sepeda Kampus’ system. The statements covered
different characteristics like road quality, weather and the amount of stations. There were
also statements concerning different factors like safety, seeing more cyclists and how
pleasant cycling is. The more positive people are about these factors the more they use the
system.
The last of the sub-questions that will be answered is:
Which factors are based on the findings important to increase the travel demand?
To answer this question two things must be taken into account, the first thing are the
answers to the stated improvements and the second thing are the responses to the
statements. The observations from the statements are important because the biggest
barriers can be obtained. The barriers are the characteristics with which the people were the
least happy. Based on the statements the biggest barrier is the weather why people do not
cycle followed by the absence of street lighting and the distance between stations which is
too big. According to the answers to the stated improvement policies most people would
certainly use the ‘Sepeda Kampus’ if all three policies would be introduced. This means if all
factors, infrastructure, support and service of the system, will be introduced this will help the
most to increase the travel demand. If the results from the statements about the factors and
characteristics are connected with the responses on the stated policies it can be concluded
that that the factors that deal with the infrastructure and the facilities are most important to
increase the travel demand.
Summing up all the answers to the sub-questions and the other previous chapters it is now
possible to come to an answer to the main research question.
Which factors influence the bicycle travel demand of the bike sharing system at Gadjah-
Mada University in Yogyakarta?
Like mentioned in the answer to the previous sub-question the weather influences the travel
demand very much. But there is not just one factor which influences the travel demand, as
Figure 24 shows the decision to cycle is a complex problem. The findings from this research
however indicate that the weather is the most important factor which influences the bicycle
travel demand. The streetlights during the night, the longer opening times and easier
borrowing procedure (service policy) are also important factors. While the street lighting is
only necessary during a small time of the operation times of the system other influential
factors of the travel demand are the distance between the sharing stations and the signage
of the bicycle paths.
June 2016 Bachelor thesis Jan Engels – Final report 43
7.1 Recommendations This section will answer the last remaining research question:
Which recommendations can be made on the basis of the research findings to increase the
use of the system?
This question was not previous answered because the recommendations should be based
on the conclusions of the research.
Based on the findings of the stated preference section it would be most logic to implement all
three different policies because it has the lowest mean. This might be the best based on the
data but not from a financial point of view. If the resources are limited it might be best to start
with only one policy and then introduce the other policies when more resources are available.
The policy that should be introduced first is the service policy because after the introduction
of this policy the most people, possible users and users, will use the system or use the
system more frequently. In the section ‘Conclusions from characteristics’ on page 21 the
ITDP guidelines were introduced and according to them the ‘Sepeda Kampus’ system does
meet the station guidelines and planning guidelines. The introduction of the service policy
would help to meet the service guidelines because it includes the implementation of an
easier borrowing procedure. The policy that should be introduced after the service policy is
the supporting policy because it would help to meet the planning guidelines. At the moment
the number of stations is not sufficient and the supporting policy will solve this problem by
establishing more stations. At the end the infrastructure policy can be introduced because it
requires the most resources and is the biggest intervention.
A problem that might occur during the implementation of the infrastructure improvements are
the different governments involved in the improvements. There are different types of roads
that run within and across the campus and these roads are organized by different
governments, so if one government agrees with the introduction of the policies that does not
mean the improvements can be introduced on the whole campus. These complications have
to be solved or minimized before the policies effectively can be introduced.
With the current system it is already retraceable who rented which bike so the risk of
vandalism and theft is minimalised, for this reason one might think about an extension of the
area of usage. If people could use the system outside the campus area it might attract more
people because they can cycle to activities outside the campus boundaries.
There are some small other recommendations that are based on the personal experience
during the research and the data, these recommendations are:
Make the station better visible, sometimes it is hard to find them
Harder control and sanction the parking on the bicycle paths
Promote the bicycle sharing system in an active way
Because of the limited resources it was not possible to analyse all factors influencing the
bicycle travel demand. To investigate the influence of the other, by PUSTRAL developed,
improvement policies further research is necessary.

June 2016 Bachelor thesis Jan Engels – Final report 44
8. Discussion In this section the results from the research will be discussed, what may have influenced the
research and what can be improved for further research.
The first thing that may have influenced the results is the time when the survey was
conducted, during the research it was rain season. Every day there was an intensive rain
shower, this might have influenced the answers to the statement concerning the weather. To
make sure that the weather did not influence the results the research need to be executed
during the dry season when there is less or no rain. However the influence of the time is
considered small because the temperatures stay nearly the same in dry and rain season.
Regarding the survey there are also some aspects that can be adjusted in further research.
Questions about how people come to the campus might be included into the survey, this
research did not pay attention to it because it was only interested in the travel demand on the
campus. In follow up research the stated preference section should also include a question
what will happen if nothing would change. This adjustment can be helpful to better obtain the
changes in bicycle usage. Regarding the statements about the characteristics one can think
about if the way the questions were asked are a suited manner for this research. Some
questions are asked in a certain direction which may influence the individual answers.
Psychologists deal with the issue of how to ask certain questions, looking into this issue
would have required too much time and would exceed the scope of this research. The
characteristics from the statements appeared also in the policies of the stated preference
section, but the factors stated by the service policy did not appear in the statement section.
These statements were not included because the analysing the service of the ‘Sepeda
Kampus’ would have exceeded the scope of the research. For further research statements
regarding the service of the system might be included into the survey. Another point of
discussion regarding the survey is the duration of the survey, the number of valid responses
decreases throughout the survey. For further research it can be helpful to simplify the survey
because the used survey, especially the stated preference section, was very complex.
From the data aspect of the research also some things need to be discussed. The 1936
responses only reflect like 3% of the total UGM population. This problem can be seen in the
possible users and users’ distribution which is not representative for the UGM population. To
make the data more reliable and the answers more universally applicable more responses
have to be gathered. Due to the limited amount of time this was not possible.
June 2016 Bachelor thesis Jan Engels – Final report 45
9. References (ITDP), I. f. (2013). The Bike-share Planning Guide. New York: ITDP. Alexander, R. (2012). Station-Level Forecasting of Bikesharing Ridership:Station Network
Effects in Three U.S. Systems. Transport research board, 1-15. Álvaro Fernández-Heredia, Andrés Monzón, Sergio Jara-Díaz. (2014). Understanding
cyclists’ perceptions, keys for a successful. Transportation Research Part A, 1-11. Andrew A. Campbell, Christopher R. Cherry, Megan S. Ryerson, Xinmiao Yang . (2016).
Factors influencing the choice of shared bicycles and shared. Transportation Research, 399-414.
Arif Wismadi, Prima Romadhona, Januar Praha. (2014). Simulation Analysis: Explanation on preference survey. Jakarta: ERIA Research Working Group.
B.S. Cleland D. Walton. (2004). Why don't people walk and cycle? Lower Hutt: Opus International Consultants.
BAAQMD. (2016, May 24). In Focus: The Last Mile and Transit Ridership. Retrieved from Institute for local government: http://www.ca-ilg.org/post/focus-last-mile-and-transit-ridership
Carme Miralles-Guasch, ElenaDomene. (2010). Sustainable transport challenges in a suburban university: The case of the Autonomous University of Barcelona. Transport Policy, 454-463.
Eric M. Delmelle, Elizabeth Cahill Delmelle. (2012). Exploring spatio-temporal commuting patterns in a university environment. Transport Policy, 1-9.
Greg Rybarczyk, Laura Gallagher. (2014). Measuring the potential for bicycling and walking at a metropolitan commuter university. Journal of Transport Geography, 1-10.
Ian Vince McLoughlin, I. Komang Narendra, Leong Hai Koh, Quang Huy Nguyen, Bharath Seshadri, Wei Zeng, Chang Yao. (2012). Campus Mobility for the Future: The Electric Bicycle. Journal of Transportation Technologies, 1-12.
J. Uttleya, R. Lovelace. (2016). Cycling promotion schemes and long-term behavioural change: A case study from the University of Sheffield. Case Studies on Transport Policy.
Jinbao Zhao, Wei Deng, Yan Song. (2014). Ridership and effectivenessof bikesharing: The effects of urban features and system characteristics on daily use and turnover rate of public bikes in China. TransportPolicy, 253-264.
Juneyoung Parka,Mohamed Abdel-Atya,Jaeyoung Leea, Chris Leeb. (2015). Developing crash modification functions to assess safety effects of adding bike lanes for urban arterials with different roadway and socio-economic characteristics. Accident Analysis & Prevention, 179-191.
Kampus, S. S. (2016, February 5). Direktorat Aset - Universitas Gadjah Mada. Retrieved from Sepeda Kampus: http://dppa.ugm.ac.id/wpugm/?page_id=37
Lihong Zhang, Jun Zhang, Zheng-yu Duan, David Bryde. (2014). Sustainable bike-sharing systmes: characteristics and commonalities across cases in urban China. Journal of Cleaner Production, 124-133.
MathWorks. (2016, March 28). Retrieved from Coefficient of Determination (R-Squared): http://nl.mathworks.com/help/stats/coefficient-of-determination-r-squared.html?requestedDomain=www.mathworks.com
Nehzat Jalalkamalia, Fatemeh Mohammad Niay Ghraeib. (2012). The Cycling Potentials of Malaysian Students in UiTM Campus. Procedia - Social and Behavioral Sciences, 941-949.
Oliver O'Brien, James Cheshire, Michael Batty. (2013). Mining bicycle sharing data for generating insights into sustainable transport systms. Journal of Transport Geography.
Pidwirny, M. (2006). Inferential Statistics: Regression and Correlation. Fundamentals of Physical Geography. Retrieved from http://www.physicalgeography.net/fundamentals/3h.html
June 2016 Bachelor thesis Jan Engels – Final report 46
Research, U. S. (2016, February 12). PewResearchCenter. Retrieved from Collecting survey data: http://www.pewresearch.org/methodology/u-s-survey-research/collecting-survey-data/
Sanko, N. (2001). Guidelines for Stated Preference Experiment Design. Paris: School of International Management .
Stephane Hess, John M. Rose. (2009). Some lessons in stated choice survey design. Association for European Transport and contributors.
Sylvia Titze, Willibald J. Stronegger, Susanne Janschitz , Pekka Oja. (2008). Association of built-environment, social-environment and personal factors with bicycling as a mode of transportation among Austrian city dwellers. Preventive Medicine, 252-259.
Sylvia Titze, Willibald J. Stronegger,Susanne Janschitz, Pekka Oja. (2007). Environmental, Social, and Personal Correlates of Cycling for Transportation in a Student Population. Journal of Physical Activity and Health, 66-79.
Thomas Wuerzer, Susan G. Mason. (2015). Cycling willingness: Investigating distance as a dependent variable in cycling behavior among college students. Applied Geography, 95-106.
University, K. (2016, June 01). Paired samples t test. Retrieved from University Libraries: http://libguides.library.kent.edu/SPSS/PairedSamplestTest
University, K. S. (2016, 03 15). Independent Samples t-test. Retrieved from University libraries: http://libguides.library.kent.edu/SPSS/IndependentTTest
Walter Hook, Michael Replogle. (1996). Motorization and non-motorized transport in Asia - Transport system evolution in. Land Use Policy, 69-84.
Yuchen Cui, Sabyasachee Mishra, Timothy F. Welch. (2014). Land use effects on bicycle ridership: a framework for state planning agencies. Journal of Transport Geography, 220-228.
Zezima, K. (2008). With Free Bikes, Challenging Car Culture on Campus. New York Times.

June 2016 Bachelor thesis Jan Engels – Final report 47
10. Attachments
10.1 Appendix A – Research questions and definitions:
10.1.1 Research questions
What are the characteristics of the bike sharing system at UGM?
o What are the physical characteristics?
What are the facilities of the system?
What is the available infrastructure on the area of UGM, what is its
quality and how is it being used by various modes?
o What are the spatial characteristics?
Where are the sharing stations located?
Which area does the system cover?
What is the topography of the area?
o What are the operational characteristics?
o What are the characteristics of the usage?
How are the characteristics from UGM similar or different to characteristics from
comparable systems?
o How can possible differences in characteristics be explained?
Is there a relationship between the characteristics of the system and the travel
demand?
Which factors are based on the findings important to increase the travel demand?
o Do the findings from UGM agree with findings from other researches?
What are the possible differences between findings and how can they
be explained
10.1.2 Definitions: During this report different abbreviations and other terms will be used that are not clear to
everybody. For this reason a short description of the most used abbreviations and terms will
be given.
PBS (Public bicycle sharing system) / bicycle sharing system: PBS is a transport system
which fills up the missing gaps of the public transport with a high amount of flexibility.
GIS: Geographical Information System
UGM: University Gadjah Mada
PUSTRAL: Pusat Studi Transportasi dan Logistik (Center for Transportation and Logistics
Studies)

June 2016 Bachelor thesis Jan Engels – Final report 48
10.2 Appendix B – Characteristics: Table 11 - General information stations
Table 12 - Distance between stations (in meter)
Station nr. Name Latitude Longitude Ideal Maximum Number of bicylces
1 Perpustakaan -7.768843 110.379035 65 115 117
2 Gelanggang -7.77503 110.37614 75 135 169
3 Lembah -7.76983 110.38175 65 115 100
4 Agro Fauna -7.76814 110.38487 30 54 41
5 Taman Biologi -7.767294 110.374483 36 63 40
6 Teknik -7.7657 110.37228 35 63 53
7 Kesehatan -7.77128 110.37502 75 135 32
8 Vokasi -7.774557 110.374620 35 63 74
9 GMC -7.77267 110.3751 10 18 0
10 Bank UGM -7.776 110.37946 15 27 0
11 Farmasi -7.76824 110.37673 20 36 22
12 PAU Pasca sarjana -7.76447 110.37605 20 36 28
13 Hotel UC -7.7732 110.37728 15 27 0
14 Dinas -7.76799 110.37908 60 60 59
15 Klebengan -7.76692 110.38313 - 45 22
16 Bengkel -7.76983 110.38175 - - 184
17 Jl. Tevesia - - - - 69
CapacityGPS
Station 1 2 3 4 5 6 7 8 9 10 11 12 13 14 15 16
1 835 322 1070 580 962 699 959 764 953 318 770 579 120 1080 322
2 835 1074 1851 1222 1604 605 336 415 500 1023 1510 252 950 1477 1074
3 322 1074 777 901 1283 973 1233 1038 812 639 1085 818 435 403
4 1070 1851 777 1582 1811 1737 1997 1802 1589 1289 1218 1595 1006 374 777
5 580 1222 901 1582 382 617 1025 816 1518 323 385 1010 635 1502 901
6 962 1604 1283 1811 382 999 1407 1189 1900 705 622 1392 1087 1447 1283
7 699 605 973 1737 617 999 518 248 901 632 1002 394 754 1376 973
8 959 336 1233 1997 1025 1407 518 319 777 927 1409 430 1014 1633 1233
9 764 415 1038 1802 816 1189 248 319 800 732 1201 235 819 1438 1038
10 953 500 812 1589 1518 1900 901 777 800 1271 1630 593 1067 1215 812
11 318 1023 639 1289 323 705 632 927 732 1271 532 803 373 934 639
12 770 1510 1085 1218 385 622 1002 1409 1201 1630 532 1291 650 844 1085
13 579 252 818 1595 1010 1392 394 430 235 593 803 1291 394 1221 818
14 120 950 435 1006 635 1087 754 1014 819 1067 373 650 394 643 435
15 1080 1477 403 374 1502 1447 1376 1633 1438 1215 934 844 1221 643 403
16 322 1074 777 901 1283 973 1233 1038 812 639 1085 818 435 403
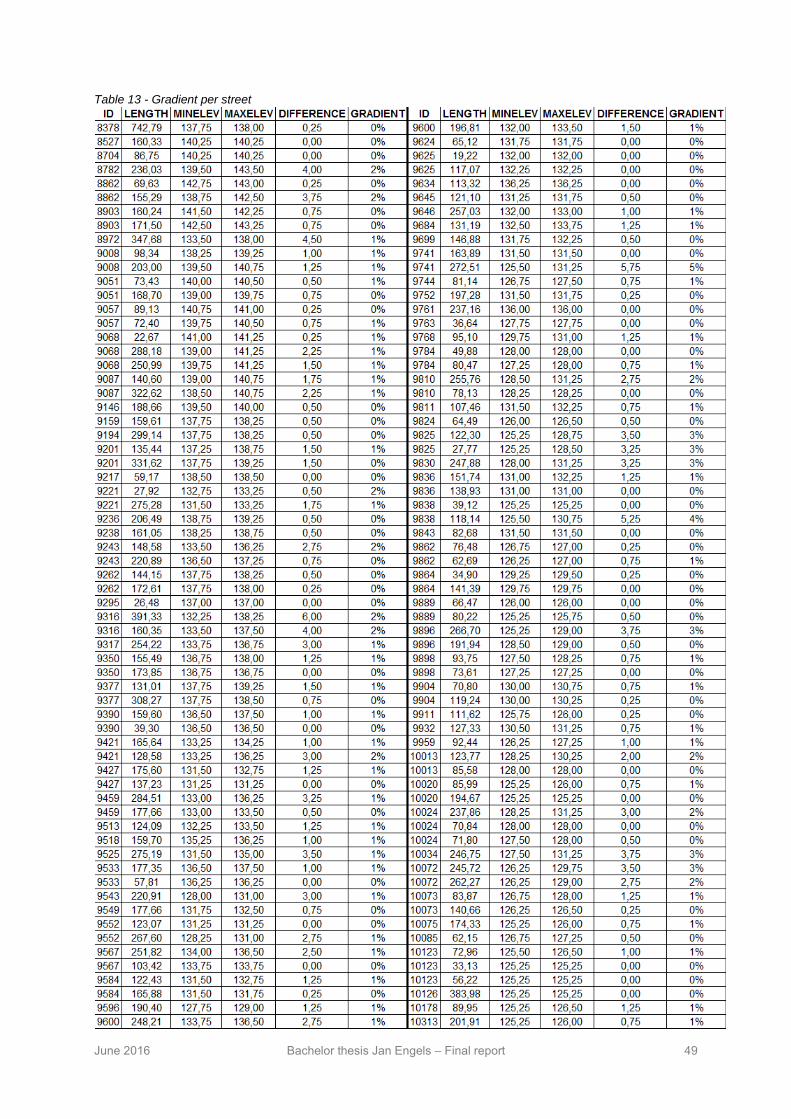
June 2016 Bachelor thesis Jan Engels – Final report 49
Table 13 - Gradient per street

June 2016 Bachelor thesis Jan Engels – Final report 50
10.2.1 Pictures from the fieldtrip
Figure 25 - State 1 - cobblestones (Evenly and flat cobblestones)
Figure 26 - State 2 - cobblestones (Evenly but not flat paved)
Figure 27 - State 3 - cobblestones (Not evenly paved, with obstacles)
Figure 28 - Sunk cobblestones
Figure 29 - State 1 - asphalt (Even and flat paved) Figure 30 - State 2 - asphalt (Even and flat paved,
with obstacles)
Figure 31 - State 3 - asphalt (Rough with holes) Figure 32 - State 1 - concrete (Flat with some holes)

June 2016 Bachelor thesis Jan Engels – Final report 51
10.3 Appendix C – Final survey:
Survey Sepeda Kampus This survey is part of a research on the ‘Sepeda Kampus’ (bicycle sharing system at UGM). The aim of the research is to identify factors that will help to improve the system so that more people will use it.
By filling in this survey you will help to execute this research.
Thank You in advance
General information This information is only used for the purpose of this research and will not be distributed to any other third party.
1. Gender O Male O Female
2. Age _____________________
3. Type of user O I am a student of UGM O I am a faculty member of UGM O I am a non-academic staff of UGM O I am a visitor of UGM
4. At which faculty do you work/study? _____________________
5. Do You own a bicycle, motorbike or car? O Yes I own a bicycle O Yes I own a motorbike O Yes I own a car O Yes I own a bicycle and motorbike O Yes I own a bicycle and car O Yes I own a motorbike and car O Yes I own all three O No
Cycling behaviour general These questions are about how often You use the Sepeda Kampus or a bicycle in general
6. How often do You use the 'Sepeda Kampus' system? O I have never used the system Skip to question 11 O Once a month Skip to question 8 O More than once a month Skip to question 8 O Once a week Skip to question 8 O More than once a week Skip to question 8 O Daily Skip to question 8
Cycling behaviour for 'Sepeda Kampus' users These questions are special for people who already use the 'Sepeda Kampus' system
7. For which purpose do you mainly use the 'Sepeda Kampus' system? O To travel to my location of work O For recreation O To travel across the campus between UGM buildings O To transport goods across the campus O To go to a shop O To meet with friends O Other:
June 2016 Bachelor thesis Jan Engels – Final report 52
8. What is your most used departure station? O Perpustakaan O Gelanggang O Lembah O Agro Fauna O Taman Biologi O Teknik O Kesehatan O Vokasi O GMC O Bank UGM O Farmasi O PAU Pascasarjana O Hotel UC O Dinas O Klebengan O Bengkel
9. What is your most used arrival station? O Perpustakaan O Gelanggang O Lembah O Agro Fauna O Taman Biologi O Teknik O Kesehatan O Vokasi O GMC O Bank UGM O Farmasi O PAU Pascasarjana O Hotel UC O Dinas O Klebengan O Bengkel
Cycling behaviour general 10. How often do You cycle without using the ‘Sepeda Kampus’ system? O I never cycle O Once a month O More than once a month O Once a week O More than once a week O Daily

June 2016 Bachelor thesis Jan Engels – Final report 53
Attitude towards cycling This section is about how much You agree or disagree with one of the following statements. Infrastructure
11. The on road safety on the campus is good 1 2 3 4 O O O O
Strongly agree Strongly disagree 12. There are sufficient bicycle paths
1 2 3 4 O O O O
Strongly agree Strongly disagree 13. The bicycle paths are well signed
1 2 3 4 O O O O
Strongly agree Strongly disagree 14. There is sufficient lighting in the evening
1 2 3 4 O O O O
Strongly agree Strongly disagree 15. There are enough stations to return the bicycle
1 2 3 4 O O O O
Strongly agree Strongly disagree 16. The distance between stations is too long
1 2 3 4 O O O O
Strongly agree Strongly disagree
Attractive environment 17. The weather influences my bicycle use
1 2 3 4 O O O O
Strongly agree Strongly disagree 18. It is attractive to cycle across the UGM campus
1 2 3 4 O O O O
Strongly agree Strongly disagree 19. Seeing more bicyclists makes me want to cycle more
1 2 3 4 O O O O
Strongly agree Strongly disagree
20. I am not interested in cycling because it is unpleasant 1 2 3 4 O O O O
Strongly agree Strongly disagree

June 2016 Bachelor thesis Jan Engels – Final report 54
Change in behaviour Before you answer the following question make sure you read the following things:
Infrastructure policies:
These policies include a clear dedicated lane only for bicycles. This lane is physical separated from the road for cars and motorbikes. Also a clear marking of the bicycle path will be present. This dedicated lane only for bicycles will improve the safety during a bicycle trip.
21. What will happen when only infrastructure policies will be introduced? 1 2 3 4 5 O O O O O
Certainly I will use the ‘Sepeda Kampus’
system
Probably I will use the ‘Sepeda Kampus’
system
Doubtful
Probably I will not use the ‘Sepeda Kampus’
system
Certainly I will not use the ‘Sepeda Kampus’
system Supporting facilities:
These policies include the introduction of more stations where the bicycle can be picked up or returned. This introduction of new stations will result in an average shorter walking distance to a station. Also the station will provide a detailed description of how to get to the other stations on the campus. This will be done by hanging up a big map of the UGM campus.
22. What will happen when only supporting policies will be introduced? 1 2 3 4 5 O O O O O
Certainly I will use the ‘Sepeda Kampus’
system
Probably I will use the ‘Sepeda Kampus’
system
Doubtful
Probably I will not use the ‘Sepeda Kampus’
system
Certainly I will not use the ‘Sepeda Kampus’
system Service facilities:
These policies include that the opening times of the system will be extended so that people can use the system longer. The introduction of an easier borrowing procedure is also part of these policies, the easier procedure will allow people to borrow and returning a bike using their student card.
23. What will happen when only service policies will be introduced? 1 2 3 4 5 O O O O O
Certainly I will use the ‘Sepeda Kampus’
system
Probably I will use the ‘Sepeda Kampus
system
Doubtful
Probably I will not use the ‘Sepeda Kampus’
system
Certainly I will not use the ‘Sepeda Kampus’
system

June 2016 Bachelor thesis Jan Engels – Final report 55
24. What will happen when infrastructure and supporting policies will be introduced? 1 2 3 4 5 O O O O O
Certainly I will use the ‘Sepeda Kampus’
system
Probably I will use the ‘Sepeda Kampus’
system
Doubtful
Probably I will not use the ‘Sepeda Kampus’
system
Certainly I will not use the ‘Sepeda Kampus’
system
25. What will happen when infrastructure and service policies will be introduced? 1 2 3 4 5 O O O O O
Certainly I will use the ‘Sepeda Kampus’
system
Probably I will use the ‘Sepeda Kampus’
system
Doubtful
Probably I will not use the ‘Sepeda Kampus’
system
Certainly I will not use the ‘Sepeda Kampus’
system
26. What will happen when supporting and service policies will be introduced? 1 2 3 4 5 O O O O O
Certainly I will use the ‘Sepeda Kampus’
system
Probably I will use the ‘Sepeda Kampus’
system
Doubtful
Probably I will not use the ‘Sepeda Kampus’
system
Certainly I will not use the ‘Sepeda Kampus’
system
27. What will happen when all three policies will be introduced? 1 2 3 4 5 O O O O O
Certainly I will use the ‘Sepeda Kampus’
system
Probably I will use the ‘Sepeda Kampus
’system
Doubtful
Probably I will not use the ‘Sepeda Kampus’
system
Certainly I will not use the ‘Sepeda Kampus’
system
Thank You for your time and filling in this survey
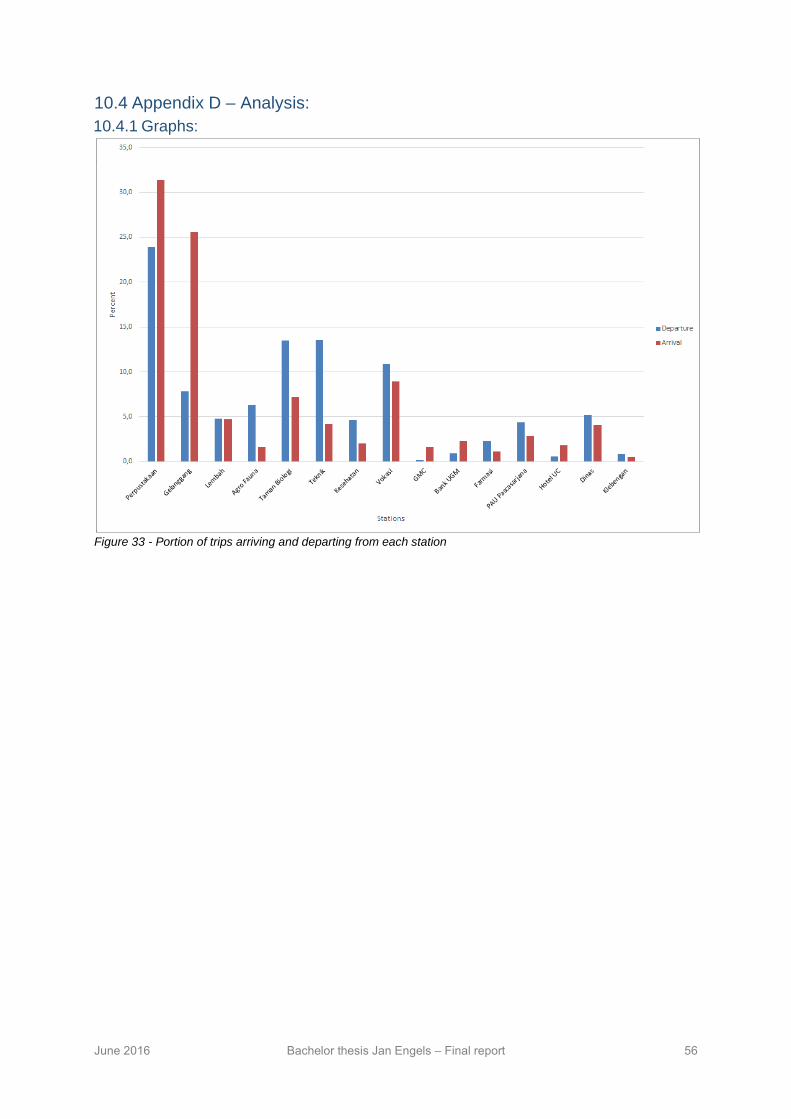
June 2016 Bachelor thesis Jan Engels – Final report 56
10.4 Appendix D – Analysis:
10.4.1 Graphs:
Figure 33 - Portion of trips arriving and departing from each station
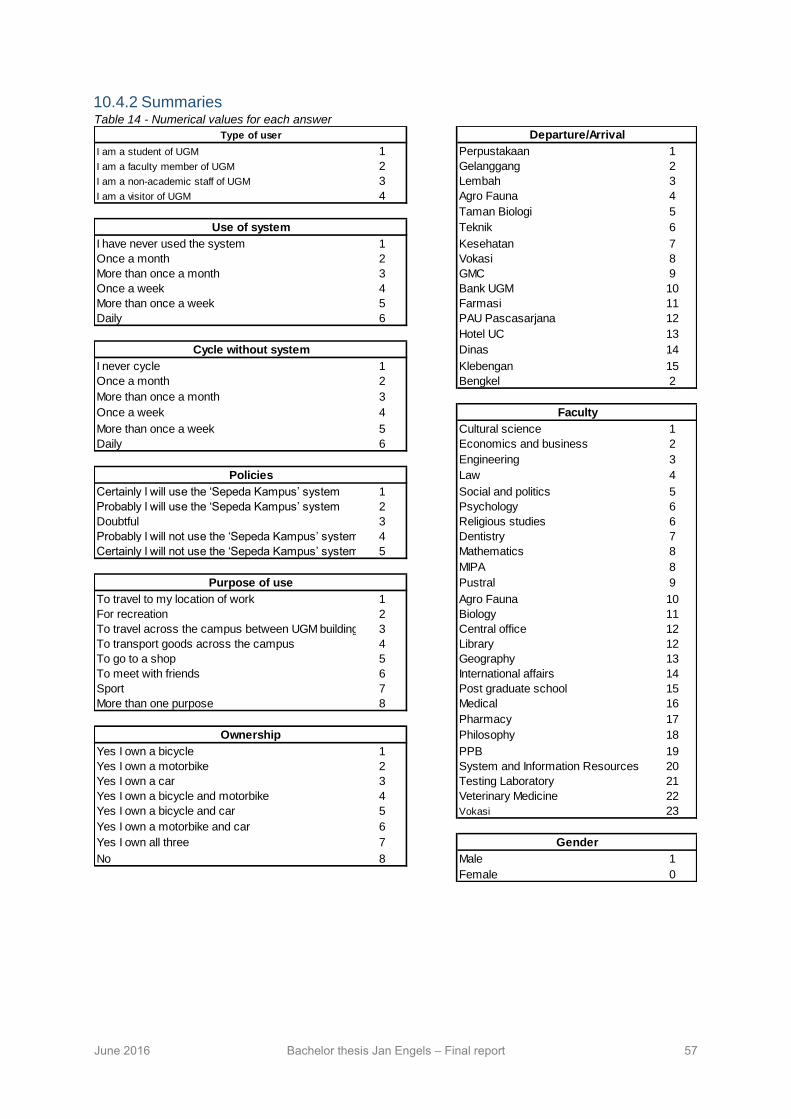
June 2016 Bachelor thesis Jan Engels – Final report 57
10.4.2 Summaries Table 14 - Numerical values for each answer
I am a student of UGM 1 Perpustakaan 1
I am a faculty member of UGM 2 Gelanggang 2
I am a non-academic staff of UGM 3 Lembah 3
I am a visitor of UGM 4 Agro Fauna 4
Taman Biologi 5
Teknik 6
I have never used the system 1 Kesehatan 7
Once a month 2 Vokasi 8
More than once a month 3 GMC 9
Once a week 4 Bank UGM 10
More than once a week 5 Farmasi 11
Daily 6 PAU Pascasarjana 12
Hotel UC 13
Dinas 14
I never cycle 1 Klebengan 15
Once a month 2 Bengkel 2
More than once a month 3
Once a week 4
More than once a week 5 Cultural science 1
Daily 6 Economics and business 2
Engineering 3
Law 4
Certainly I will use the ‘Sepeda Kampus’ system 1 Social and politics 5
Probably I will use the ‘Sepeda Kampus’ system 2 Psychology 6
Doubtful 3 Religious studies 6
Probably I will not use the ‘Sepeda Kampus’ system 4 Dentistry 7
Certainly I will not use the ‘Sepeda Kampus’ system 5 Mathematics 8
MIPA 8
Pustral 9
To travel to my location of work 1 Agro Fauna 10
For recreation 2 Biology 11
To travel across the campus between UGM buildings 3 Central office 12
To transport goods across the campus 4 Library 12
To go to a shop 5 Geography 13
To meet with friends 6 International affairs 14
Sport 7 Post graduate school 15
More than one purpose 8 Medical 16
Pharmacy 17
Philosophy 18
Yes I own a bicycle 1 PPB 19
Yes I own a motorbike 2 System and Information Resources 20
Yes I own a car 3 Testing Laboratory 21
Yes I own a bicycle and motorbike 4 Veterinary Medicine 22
Yes I own a bicycle and car 5 Vokasi 23
Yes I own a motorbike and car 6
Yes I own all three 7
No 8 Male 1
Female 0
Cycle without system
Ownership
Use of system
Gender
Type of user Departure/Arrival
Policies
Purpose of use
Faculty
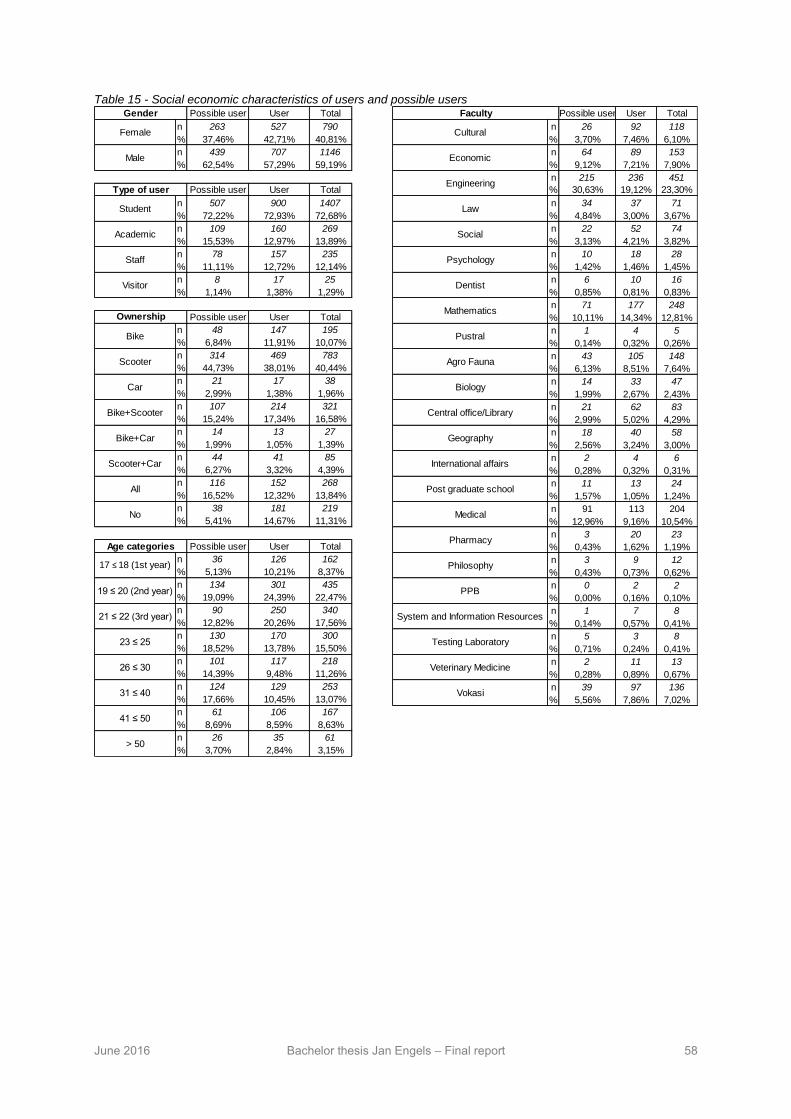
June 2016 Bachelor thesis Jan Engels – Final report 58
Table 15 - Social economic characteristics of users and possible users
Possible user User Total Possible user User Total
n 263 527 790 n 26 92 118
% 37,46% 42,71% 40,81% % 3,70% 7,46% 6,10%
n 439 707 1146 n 64 89 153
% 62,54% 57,29% 59,19% % 9,12% 7,21% 7,90%
n 215 236 451
Possible user User Total % 30,63% 19,12% 23,30%
n 507 900 1407 n 34 37 71
% 72,22% 72,93% 72,68% % 4,84% 3,00% 3,67%
n 109 160 269 n 22 52 74
% 15,53% 12,97% 13,89% % 3,13% 4,21% 3,82%
n 78 157 235 n 10 18 28
% 11,11% 12,72% 12,14% % 1,42% 1,46% 1,45%
n 8 17 25 n 6 10 16
% 1,14% 1,38% 1,29% % 0,85% 0,81% 0,83%
n 71 177 248
Possible user User Total % 10,11% 14,34% 12,81%
n 48 147 195 n 1 4 5
% 6,84% 11,91% 10,07% % 0,14% 0,32% 0,26%
n 314 469 783 n 43 105 148
% 44,73% 38,01% 40,44% % 6,13% 8,51% 7,64%
n 21 17 38 n 14 33 47
% 2,99% 1,38% 1,96% % 1,99% 2,67% 2,43%
n 107 214 321 n 21 62 83
% 15,24% 17,34% 16,58% % 2,99% 5,02% 4,29%
n 14 13 27 n 18 40 58
% 1,99% 1,05% 1,39% % 2,56% 3,24% 3,00%
n 44 41 85 n 2 4 6
% 6,27% 3,32% 4,39% % 0,28% 0,32% 0,31%
n 116 152 268 n 11 13 24
% 16,52% 12,32% 13,84% % 1,57% 1,05% 1,24%
n 38 181 219 n 91 113 204
% 5,41% 14,67% 11,31% % 12,96% 9,16% 10,54%
n 3 20 23
Possible user User Total % 0,43% 1,62% 1,19%
n 36 126 162 n 3 9 12
% 5,13% 10,21% 8,37% % 0,43% 0,73% 0,62%
n 134 301 435 n 0 2 2
% 19,09% 24,39% 22,47% % 0,00% 0,16% 0,10%
n 90 250 340 n 1 7 8
% 12,82% 20,26% 17,56% % 0,14% 0,57% 0,41%
n 130 170 300 n 5 3 8
% 18,52% 13,78% 15,50% % 0,71% 0,24% 0,41%
n 101 117 218 n 2 11 13
% 14,39% 9,48% 11,26% % 0,28% 0,89% 0,67%
n 124 129 253 n 39 97 136
% 17,66% 10,45% 13,07% % 5,56% 7,86% 7,02%
n 61 106 167
% 8,69% 8,59% 8,63%
n 26 35 61
% 3,70% 2,84% 3,15%
26 ≤ 30
31 ≤ 40
Student
Academic
Staff
Visitor
Age categories
Faculty
41 ≤ 50
> 50
Bike
Scooter
Car
Bike+Scooter
Bike+Car
Scooter+Car
All
No
17 ≤ 18 (1st year)
19 ≤ 20 (2nd year)
21 ≤ 22 (3rd year)
23 ≤ 25
Engineering
Economic
Gender
Type of user
Ownership
Female
Male
Mathematics
Dentist
Psychology
Social
Law
Cultural
Vokasi
Veterinary Medicine
Testing Laboratory
System and Information Resources
PPB
Philosophy
Pharmacy
Medical
Post graduate school
International affairs
Geography
Central office/Library
Biology
Agro Fauna
Pustral
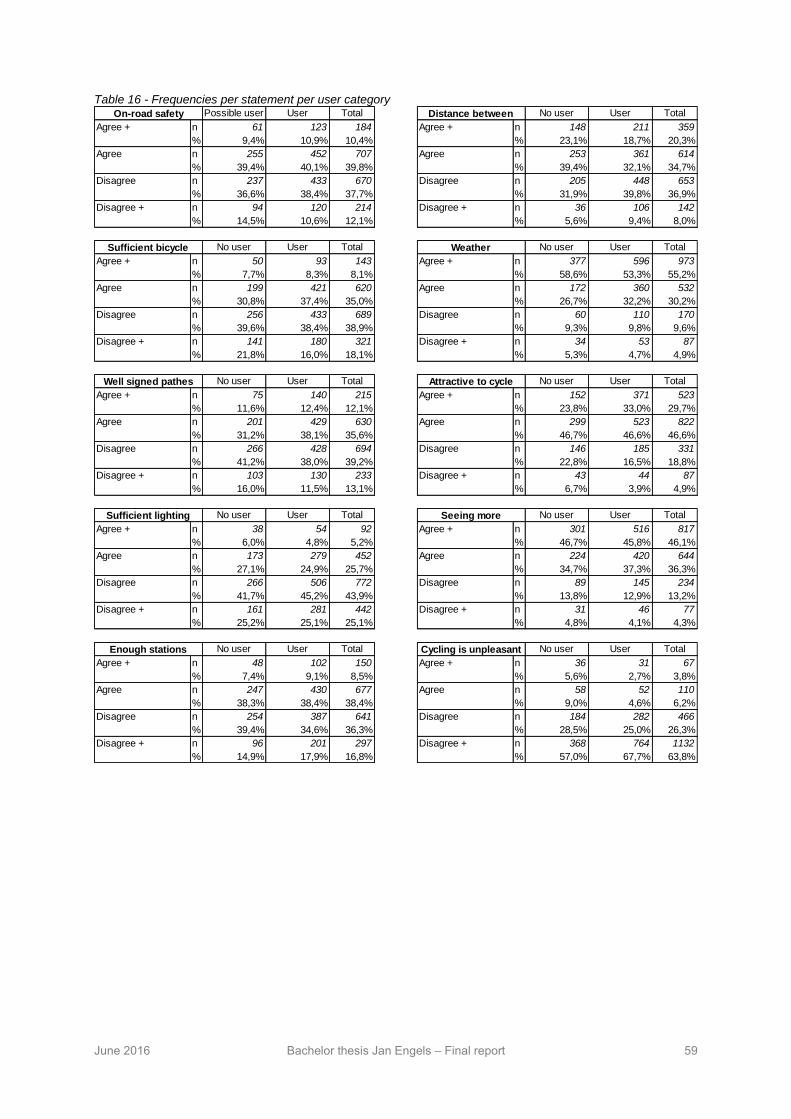
June 2016 Bachelor thesis Jan Engels – Final report 59
Table 16 - Frequencies per statement per user category
Possible user User Total No user User Total
n 61 123 184 n 148 211 359
% 9,4% 10,9% 10,4% % 23,1% 18,7% 20,3%
n 255 452 707 n 253 361 614
% 39,4% 40,1% 39,8% % 39,4% 32,1% 34,7%
n 237 433 670 n 205 448 653
% 36,6% 38,4% 37,7% % 31,9% 39,8% 36,9%
n 94 120 214 n 36 106 142
% 14,5% 10,6% 12,1% % 5,6% 9,4% 8,0%
No user User Total No user User Total
n 50 93 143 n 377 596 973
% 7,7% 8,3% 8,1% % 58,6% 53,3% 55,2%
n 199 421 620 n 172 360 532
% 30,8% 37,4% 35,0% % 26,7% 32,2% 30,2%
n 256 433 689 n 60 110 170
% 39,6% 38,4% 38,9% % 9,3% 9,8% 9,6%
n 141 180 321 n 34 53 87
% 21,8% 16,0% 18,1% % 5,3% 4,7% 4,9%
No user User Total No user User Total
n 75 140 215 n 152 371 523
% 11,6% 12,4% 12,1% % 23,8% 33,0% 29,7%
n 201 429 630 n 299 523 822
% 31,2% 38,1% 35,6% % 46,7% 46,6% 46,6%
n 266 428 694 n 146 185 331
% 41,2% 38,0% 39,2% % 22,8% 16,5% 18,8%
n 103 130 233 n 43 44 87
% 16,0% 11,5% 13,1% % 6,7% 3,9% 4,9%
No user User Total No user User Total
n 38 54 92 n 301 516 817
% 6,0% 4,8% 5,2% % 46,7% 45,8% 46,1%
n 173 279 452 n 224 420 644
% 27,1% 24,9% 25,7% % 34,7% 37,3% 36,3%
n 266 506 772 n 89 145 234
% 41,7% 45,2% 43,9% % 13,8% 12,9% 13,2%
n 161 281 442 n 31 46 77
% 25,2% 25,1% 25,1% % 4,8% 4,1% 4,3%
No user User Total No user User Total
n 48 102 150 n 36 31 67
% 7,4% 9,1% 8,5% % 5,6% 2,7% 3,8%
n 247 430 677 n 58 52 110
% 38,3% 38,4% 38,4% % 9,0% 4,6% 6,2%
n 254 387 641 n 184 282 466
% 39,4% 34,6% 36,3% % 28,5% 25,0% 26,3%
n 96 201 297 n 368 764 1132
% 14,9% 17,9% 16,8% % 57,0% 67,7% 63,8%
On-road safety
Sufficient bicycle
Well signed pathes
Agree +
Agree
Disagree
Disagree +
Cycling is unpleasant
Agree +
Agree
Disagree
Disagree +
Seeing more
Agree +
Agree
Disagree
Disagree +
Attractive to cycle
Agree +
Agree
Disagree
Disagree +
Weather
Agree +
Agree
Disagree
Disagree +
Distance between
Agree +
Agree
Disagree
Disagree +
Enough stations
Agree +
Agree
Disagree
Disagree +
Sufficient lighting
Agree +
Agree
Disagree
Disagree +
Agree +
Agree
Disagree
Disagree +
Agree +
Agree
Disagree
Disagree +

June 2016 Bachelor thesis Jan Engels – Final report 60
Table 17 - Summary policies – Answers
No user User Total No user User Total
n 140 512 652 n 201 615 816
% 20,00% 41,56% 33,75% % 28,96% 50,29% 42,57%
n 400 584 984 n 403 536 939
% 57,14% 47,40% 50,93% % 58,07% 43,83% 48,98%
n 116 111 227 n 62 58 120
% 16,57% 9,01% 11,75% % 8,93% 4,74% 6,26%
n 27 21 48 n 17 10 27
% 3,86% 1,70% 2,48% % 2,45% 0,82% 1,41%
n 17 4 21 n 11 4 15
% 2,43% 0,32% 1,09% % 1,59% 0,33% 0,78%
n 700 1232 1932 n 694 1223 1917
% 100,00% 100,00% 100,00% % 100,00% 100,00% 100,00%
No user User Total No user User Total
n 156 549 705 n 184 597 781
% 22,38% 45,15% 36,85% % 27,54% 49,67% 41,76%
n 393 529 922 n 390 537 927
% 56,38% 43,50% 48,20% % 58,38% 44,68% 49,57%
n 116 103 219 n 63 57 120
% 16,64% 8,47% 11,45% % 9,43% 4,74% 6,42%
n 18 27 45 n 20 8 28
% 2,58% 2,22% 2,35% % 2,99% 0,67% 1,50%
n 14 8 22 n 11 3 14
% 2,01% 0,66% 1,15% % 1,65% 0,25% 0,75%
n 697 1216 1913 n 668 1202 1870
% 100,00% 100,00% 100,00% % 100,00% 100,00% 100,00%
No user User Total No user User Total
n 190 616 806 n 171 572 743
% 27,30% 50,78% 42,22% % 25,04% 47,23% 39,23%
n 369 493 862 n 404 551 955
% 53,02% 40,64% 45,15% % 59,15% 45,50% 50,42%
n 96 72 168 n 80 75 155
% 13,79% 5,94% 8,80% % 11,71% 6,19% 8,18%
n 27 27 54 n 17 11 28
% 3,88% 2,23% 2,83% % 2,49% 0,91% 1,48%
n 14 5 19 n 11 2 13
% 2,01% 0,41% 1,00% % 1,61% 0,17% 0,69%
n 696 1213 1909 n 683 1211 1894
% 100,00% 100,00% 100,00% % 100,00% 100,00% 100,00%
No user User Total
n 237 692 929
% 34,30% 57,28% 48,92%
n 370 448 818
% 53,55% 37,09% 43,08%
n 57 58 115
% 8,25% 4,80% 6,06%
n 17 9 26
% 2,46% 0,75% 1,37%
n 10 1 11
% 1,45% 0,08% 0,58%
n 691 1208 1899
% 100,00% 100,00% 100,00%Total
Certainly use
Probably use
Doubtful
Probably not
Certainly not
Total
All three
Certainly use
Probably use
Doubtful
Probably not
Certainly not
Total
Supp&Serv
Certainly use
Probably use
Doubtful
Probably not
Certainly not
Total
Infra&Serv
Certainly use
Probably use
Doubtful
Probably not
Certainly not
Total
Infra&Supp
Certainly use
Probably use
Doubtful
Probably not
Certainly not
Total
Serv
Certainly use
Probably use
Doubtful
Probably not
Certainly not
Total
Supp
Infra
Certainly use
Probably use
Doubtful
Probably not
Certainly not

June 2016 Bachelor thesis Jan Engels – Final report 61
Table 18 - Summary policies (Possible users)
Table 19 - Summary policies (Users)
Table 20 - Correlation between policy combinations (Possible users)
Table 21 - Correlation between policy combinations (Users)
Paired Samples Statistics Mean N Std. Deviation Std. Error Mean
Infrastructure 2,12 696 ,853 ,032
Supporting 2,05 696 ,821 ,031
Service 2,00 694 ,865 ,033
Infrastructure and supporting 1,89 662 ,776 ,030
Infrastructure and service 1,93 662 ,798 ,031
Supporting and service 1,96 678 ,782 ,030
All three 1,83 690 ,792 ,030
Paired Samples Statistics Mean N Std. Deviation Std. Error Mean
Infrastructure 1,72 1214 ,726 ,021
Supporting 1,70 1214 ,770 ,022
Service 1,61 1197 ,738 ,021
Infrastructure and supporting 1,57 1195 ,656 ,019
Infrastructure and service 1,57 1195 ,640 ,019
Supporting and service 1,61 1187 ,662 ,019
All three 1,49 1191 ,635 ,018
Paired Samples Correlations N Correlation Sig.
Infrastructure & Supporting 696 ,688 ,000
Infrastructure & Service 694 ,564 ,000
Supporting & Service 692 ,712 ,000
Infrastructure and supporting & Infrastructure and service 662 ,901 ,000
Infrastructure and supporting & Supporting and service 678 ,851 ,000
Infrastructure and service & Supporting and service 658 ,847 ,000
Infrastructure & All three 690 ,635 ,000
Supporting & All three 687 ,619 ,000
Service & All three 685 ,600 ,000
Infrastructure and supporting & All three 683 ,842 ,000
Infrastructure and service & All three 664 ,831 ,000
Supporting and service & All three 680 ,809 ,000
Paired Samples Correlations N Correlation Sig.
Infrastructure & Supporting 1214 ,483 ,000
Infrastructure & Service 1211 ,468 ,000
Supporting & Service 1197 ,690 ,000
Infrastructure and supporting & Infrastructure and service 1195 ,838 ,000
Infrastructure and supporting & Supporting and service 1203 ,735 ,000
Infrastructure and service & Supporting and service 1187 ,816 ,000
Infrastructure & All three 1206 ,482 ,000
Supporting & All three 1191 ,440 ,000
Service & All three 1189 ,433 ,000
Infrastructure and supporting & All three 1200 ,760 ,000
Infrastructure and service & All three 1181 ,763 ,000
Supporting and service & All three 1191 ,721 ,000
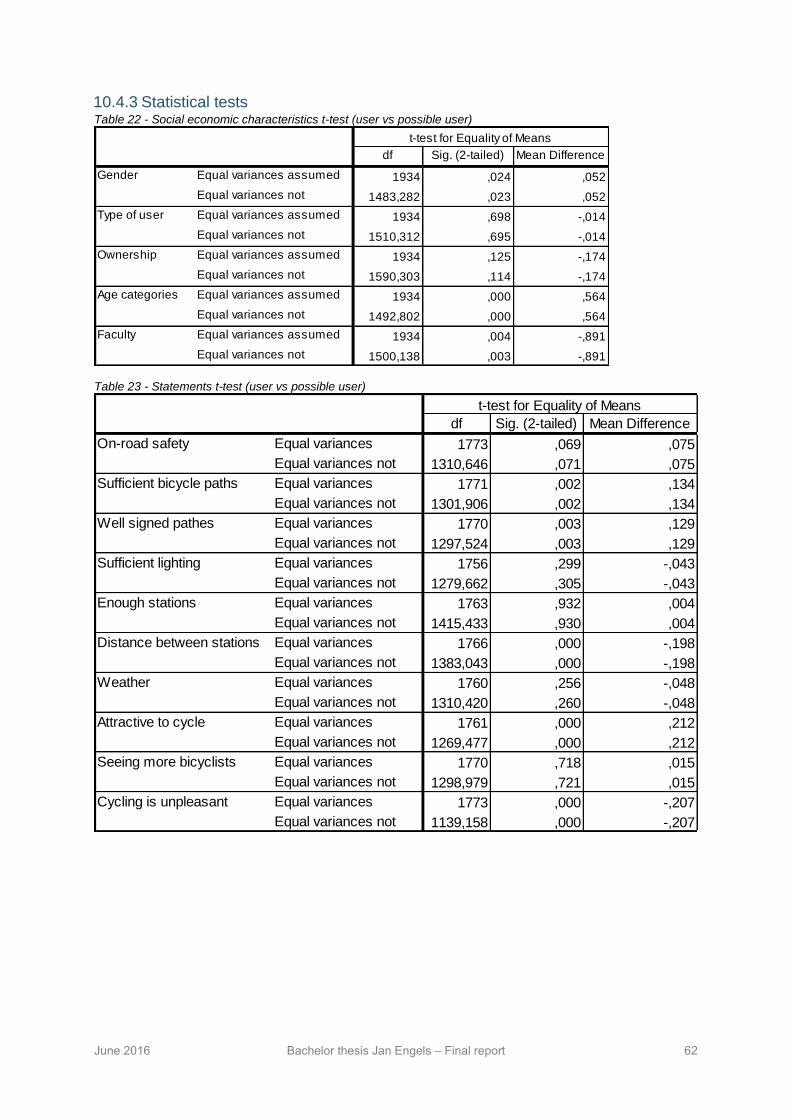
June 2016 Bachelor thesis Jan Engels – Final report 62
10.4.3 Statistical tests Table 22 - Social economic characteristics t-test (user vs possible user)
Table 23 - Statements t-test (user vs possible user)
df Sig. (2-tailed) Mean Difference
Equal variances assumed 1934 ,024 ,052
Equal variances not
assumed1483,282 ,023 ,052
Equal variances assumed 1934 ,698 -,014
Equal variances not
assumed1510,312 ,695 -,014
Equal variances assumed 1934 ,125 -,174
Equal variances not
assumed1590,303 ,114 -,174
Equal variances assumed 1934 ,000 ,564
Equal variances not
assumed1492,802 ,000 ,564
Equal variances assumed 1934 ,004 -,891
Equal variances not
assumed1500,138 ,003 -,891
Gender
Type of user
Ownership
Age categories
Faculty
t-test for Equality of Means
df Sig. (2-tailed) Mean Difference
Equal variances
assumed
1773 ,069 ,075
Equal variances not
assumed
1310,646 ,071 ,075
Equal variances
assumed
1771 ,002 ,134
Equal variances not
assumed
1301,906 ,002 ,134
Equal variances
assumed
1770 ,003 ,129
Equal variances not
assumed
1297,524 ,003 ,129
Equal variances
assumed
1756 ,299 -,043
Equal variances not
assumed
1279,662 ,305 -,043
Equal variances
assumed
1763 ,932 ,004
Equal variances not
assumed
1415,433 ,930 ,004
Equal variances
assumed
1766 ,000 -,198
Equal variances not
assumed
1383,043 ,000 -,198
Equal variances
assumed
1760 ,256 -,048
Equal variances not
assumed
1310,420 ,260 -,048
Equal variances
assumed
1761 ,000 ,212
Equal variances not
assumed
1269,477 ,000 ,212
Equal variances
assumed
1770 ,718 ,015
Equal variances not
assumed
1298,979 ,721 ,015
Equal variances
assumed
1773 ,000 -,207
Equal variances not
assumed
1139,158 ,000 -,207
Distance between stations
Weather
Attractive to cycle
Seeing more bicyclists
Cycling is unpleasant
On-road safety
Sufficient bicycle paths
Well signed pathes
Sufficient lighting
Enough stations
t-test for Equality of Means

June 2016 Bachelor thesis Jan Engels – Final report 63
Table 24 - Paired sample t-test (Possible users)
Table 25 - Paired sample t-test (Users)
Lower Upper
Infrastructure - Supporting ,062 ,662 ,025 ,013 ,111 2,463 695 ,014
Infrastructure - Service ,110 ,802 ,030 ,050 ,169 3,597 693 ,000
Supporting - Service ,052 ,641 ,024 ,004 ,100 2,134 691 ,033
Infrastructure and supporting - Infrastructure and service -,036 ,350 ,014 -,063 -,010 -2,663 661 ,008
Infrastructure and supporting - Supporting and service -,059 ,427 ,016 -,091 -,027 -3,595 677 ,000
Infrastructure and service - Supporting and service -,026 ,435 ,017 -,059 ,007 -1,522 657 ,128
Infrastructure - All three ,286 ,705 ,027 ,233 ,338 10,633 689 ,000
Supporting - All three ,226 ,704 ,027 ,173 ,278 8,400 686 ,000
Service - All three ,177 ,745 ,028 ,121 ,233 6,206 684 ,000
Infrastructure and supporting - All three ,069 ,443 ,017 ,036 ,102 4,061 682 ,000
Infrastructure and service - All three ,107 ,459 ,018 ,072 ,142 6,009 663 ,000
Supporting and service - All three ,134 ,487 ,019 ,097 ,170 7,170 679 ,000
Paired Samples Test
Paired Differences
t df Sig. (2-tailed)Mean
Std.
Deviation
Std. Error
Mean
CI
Lower Upper
Infrastructure - Supporting ,020 ,762 ,022 -,037 ,076 0,904 1213 ,366
Infrastructure - Service ,108 ,755 ,022 ,052 ,164 4,989 1210 ,000
Supporting - Service ,084 ,594 ,017 ,039 ,128 4,868 1196 ,000
Infrastructure and supporting - Infrastructure and service -,003 ,369 ,011 -,030 ,025 -0,235 1194 ,814
Infrastructure and supporting - Supporting and service -,039 ,478 ,014 -,075 -,003 -2,832 1202 ,005
Infrastructure and service - Supporting and service -,040 ,395 ,011 -,069 -,010 -3,453 1186 ,001
Infrastructure - All three ,227 ,696 ,020 ,175 ,279 11,336 1205 ,000
Supporting - All three ,206 ,754 ,022 ,149 ,262 9,415 1190 ,000
Service - All three ,123 ,736 ,021 ,068 ,178 5,750 1188 ,000
Infrastructure and supporting - All three ,077 ,446 ,013 ,043 ,110 5,949 1199 ,000
Infrastructure and service - All three ,082 ,439 ,013 ,049 ,115 6,435 1180 ,000
Supporting and service - All three ,120 ,485 ,014 ,084 ,156 8,545 1190 ,000
Paired Samples Test
Paired Differences
t df Sig. (2-tailed)Mean
Std.
Deviation
Std. Error
Mean
CI