dpl 2010-2-2-370-392
TRANSCRIPT
Available online at www.scholarsresearchlibrary.com
Scholars Research Library
Der Pharmacia Lettre, 2010, 2(2): 370-392
(http://scholarsresearchlibrary.com/archive.html)
USA CODEN: DPLEB4
370
Scholar Research Library
A study over effects of process parameters on quality attributes of a tablet by applying “quality by design”
Mayank Nagar1, Sanjay K Singhai1, V. S. Chopra#1, Indu Bala2, Piyush Trivedi2
1Ranbaxy Laboratories Limited, Industrial Area 3, Dewas, M.P
2School of Pharmaceutical Sciences, R. G. P. V, Bhopal, M.P ______________________________________________________________________________ Abstract Quality by design is an emerging concept which provides pharmaceutical manufacturer with increased self-regulated flexibility while maintaining tight quality standards and real time release of the product. The concept of QBD was mentioned in the ICH Q8 guidance (3), which states that “quality cannot be tested into products, i.e., quality should be built in by design”. This paper discusses the pharmaceutical quality by design and describes how it can be used to study the effect of process parameters on quality attributes of tablet. Key Words:-quality by design, real time release, process parameters, quality attributes, ICH Q8. _____________________________________________________________________________
INTRODUCTION Over the past three years, the US Food and Drug Administration has introduced the concept of Quality by Design (QbD), intended for improving quality assurance and control in pharmaceutical manufacturing. ICH Q8 (3) defines quality as “The suitability of either a drug substance or drug product for its intended use. This term includes such attributes as the identity, strength, and purity.” ICH Q6A (11) emphasizes the role of specifications stating that “Specifications are critical quality standards that are proposed and justified by the manufacturer and approved by regulatory authorities.” Woodcock (9) defined a high quality drug product as a product free of contamination and reproducibly delivering the therapeutic benefit promised in the label to the consumer. This definition of product quality focuses on the performance of the drug product while the ICH definition focuses on specifications. To achieve a high quality product of predefined specification, QbD is a current terminology used in pharmaceutical industry. Pharmaceutical QbD is a systematic, scientific, risk-based, holistic and proactive approach to pharmaceutical development that begins with predefined objectives and emphases product and
ISSN 0975-5071
V. S. Chopra et al Der Pharmacia Lettre, 2010, 2(2): 370-392
_____________________________________________________________________________
371
Scholar Research Library
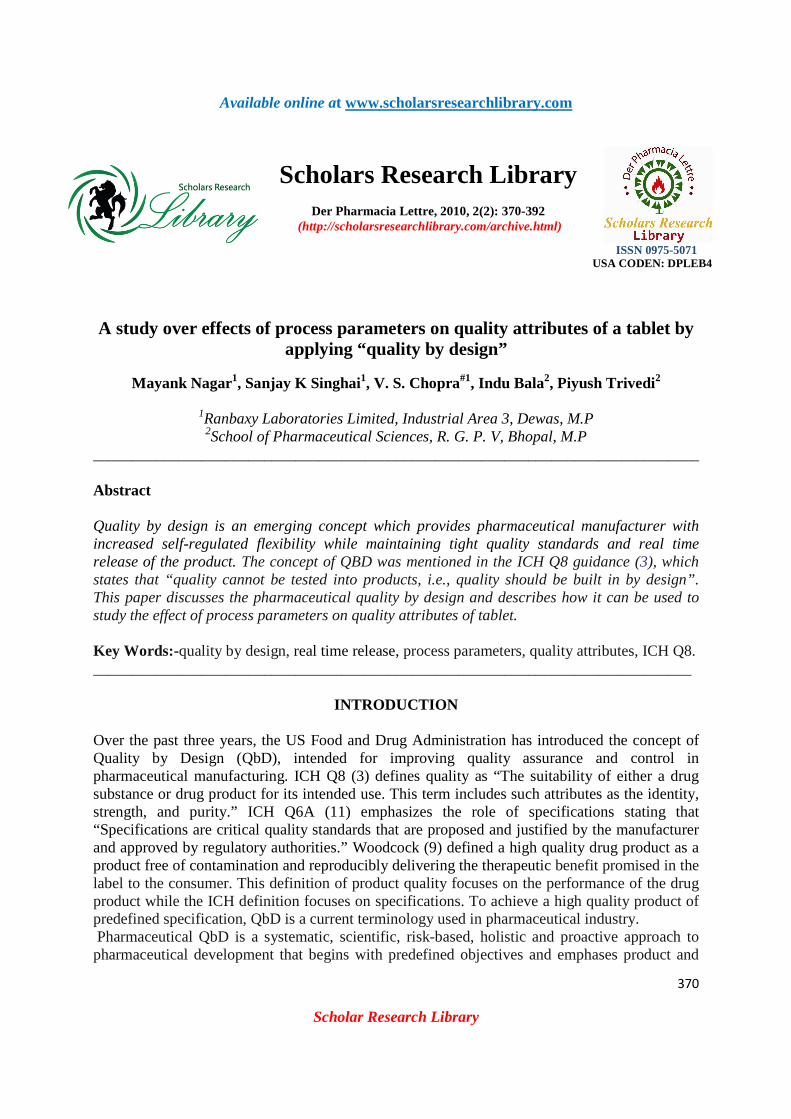
processes understanding and process control. [1] It means designing and developing formulations and manufacturing processes to ensure predefined product quality objectives. QbD identifies characteristics that are critical to quality from the perspective of patients, translates them into the attributes that the drug product should possess, and establishes how the critical process parameters can be varied to consistently produce a drug product with the desired characteristics. In order to do this the relationships between formulation and manufacturing process variables (including drug substance and excipient attributes and process parameters) and product characteristics are established and sources of variability identified. This knowledge is then used to implement a flexible and robust manufacturing process that can adapt and produce a consistent product over time. Figure1 shows the QbD approach of the tableting process.
Fig.1: An example of QbD process
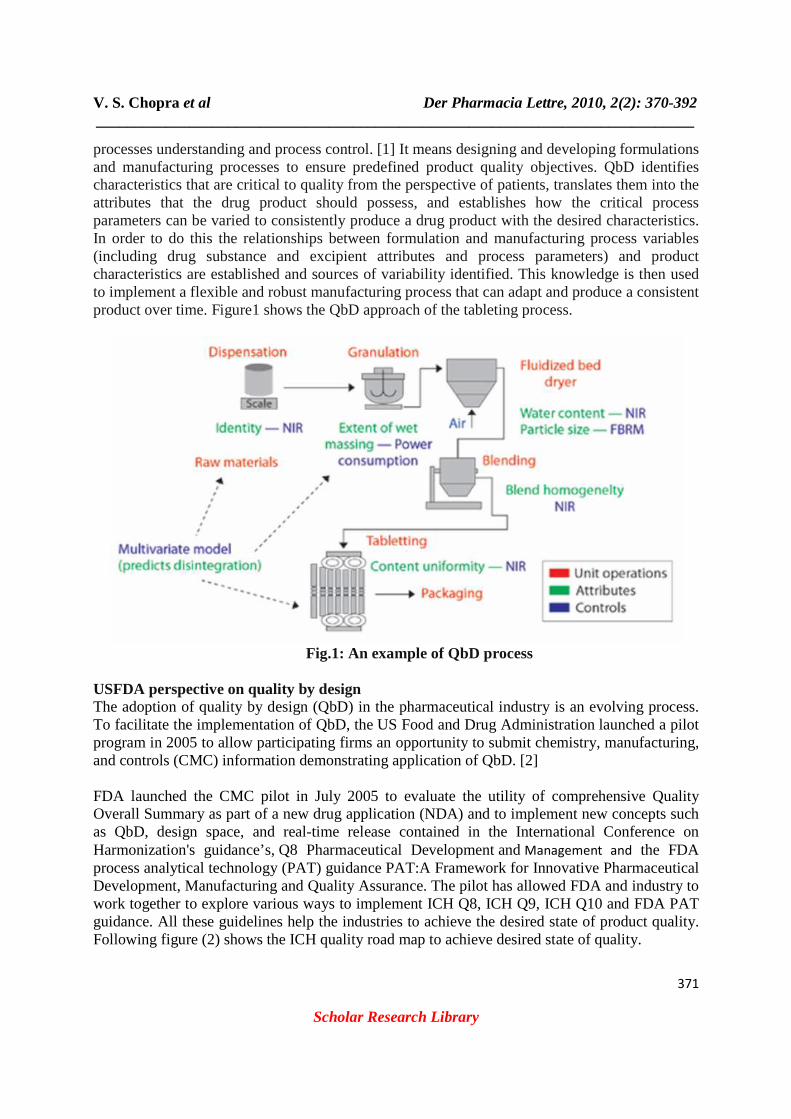
USFDA perspective on quality by design The adoption of quality by design (QbD) in the pharmaceutical industry is an evolving process. To facilitate the implementation of QbD, the US Food and Drug Administration launched a pilot program in 2005 to allow participating firms an opportunity to submit chemistry, manufacturing, and controls (CMC) information demonstrating application of QbD. [2] FDA launched the CMC pilot in July 2005 to evaluate the utility of comprehensive Quality Overall Summary as part of a new drug application (NDA) and to implement new concepts such as QbD, design space, and real-time release contained in the International Conference on Harmonization's guidance’s, Q8 Pharmaceutical Development and Management and the FDA process analytical technology (PAT) guidance PAT:A Framework for Innovative Pharmaceutical Development, Manufacturing and Quality Assurance. The pilot has allowed FDA and industry to work together to explore various ways to implement ICH Q8, ICH Q9, ICH Q10 and FDA PAT guidance. All these guidelines help the industries to achieve the desired state of product quality. Following figure (2) shows the ICH quality road map to achieve desired state of quality.
V. S. Chopra et al Der Pharmacia Lettre, 2010, 2(2): 370-392
_____________________________________________________________________________
372
Scholar Research Library
Fig. 2: ICH quality road map to achieve desired quality of product
It is expected that companies who adopt QbD, together with a quality system as described in the draft International Conference on Harmonization (ICH) Q10 document, “Pharmaceutical Quality Systems,” will achieve this “desired state” of pharmaceutical manufacturing. FDA outlines the following key elements of quality by design:
• Target the product profile • Determine critical quality attributes (CQAs) • Link raw material attributes and process parameters to CQAs and perform risk
assessment • Develop a design space • Design and implement a control strategy • Manage product life cycle, including continual improvement.
The bottom line benefits of QBD and process understanding When fully implemented QBD means that all the critical sources of process variability have been identified, measured and understood so that they can be controlled by the manufacturing process itself. The resulting business benefits are significant:
1. Reduced batch failure rates, reduced final product testing and lower batch release costs 2. Lower operating costs from fewer failures and deviation investigations 3. Increased predictability of manufacturing output and quality 4. Reduced raw material, WIP and finished product inventory costs 5. Faster tech transfer between development and manufacturing 6. Faster regulatory approval of new product applications and process changes 7. Fewer and shorter regulatory inspections of manufacturing sites 8. Real tome release of the product
These benefits translate into significant reductions in working capital requirements, resource costs and time to value. The bottom line gains, in turn, pave the way for additional top line growth. [3] Pharmaceutical quality by testing vs pharmaceutical quality by design
V. S. Chopra et al Der Pharmacia Lettre, 2010, 2(2): 370-392
_____________________________________________________________________________
373
Scholar Research Library
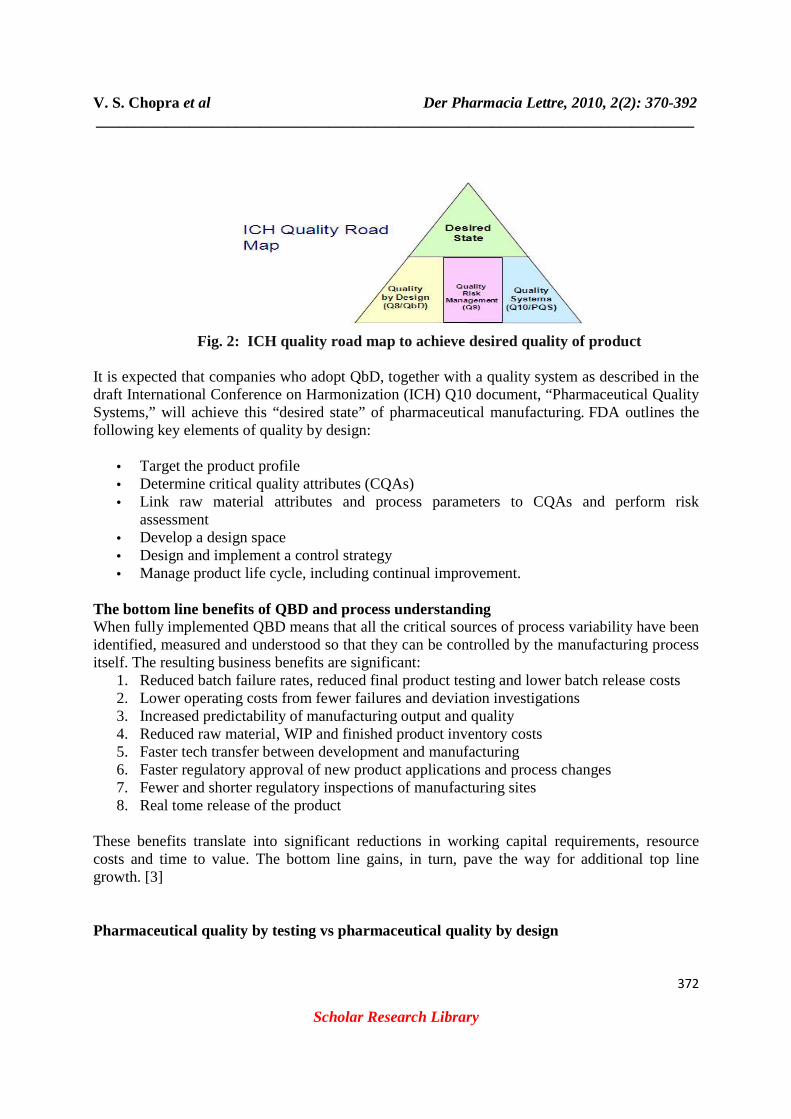
Pharmaceutical quality by testing is a current approach in the pharmaceutical system, product quality is ensured by raw material testing, drug substance manufacturing, a fixed drug product manufacturing process, in-process material testing, and end product testing. The quality of raw materials including drug substance and excipients is monitored by testing. If they meet the manufacturer’s proposed and FDA approved specifications or other standards such as USP for drug substance or excipients, they can be used for the manufacturing of the products. Because of uncertainty as to whether the drug substance specification alone is sufficient to ensure quality, the drug substance manufacturing process is also tightly controlled. A change to the drug substance manufacturing process may require the drug product manufacturer to file supplements with the FDA. Finished drug products are tested for quality by assessing whether they meet the manufacturer’s proposed and FDA approved specifications. If not, they are discarded. Root causes for failure are usually not well understood. The manufacturers risk ongoing losses of the product until the root causes of failure are understood and addressed or FDA approves supplements to revise (e.g., widen) the acceptance criteria to pass the previously failed batches. Typical specifications for an immediate release oral solid dosage form, for example, include assay, uniformity, impurities, moisture, and dissolution. Under the current paradigm, the specification is tight because it is used to assure consistency of manufacturing processes. The stringent specification has resulted in recalls and drug shortages. Following figure (3) shows the tablet compression quality control diagram using QbT.
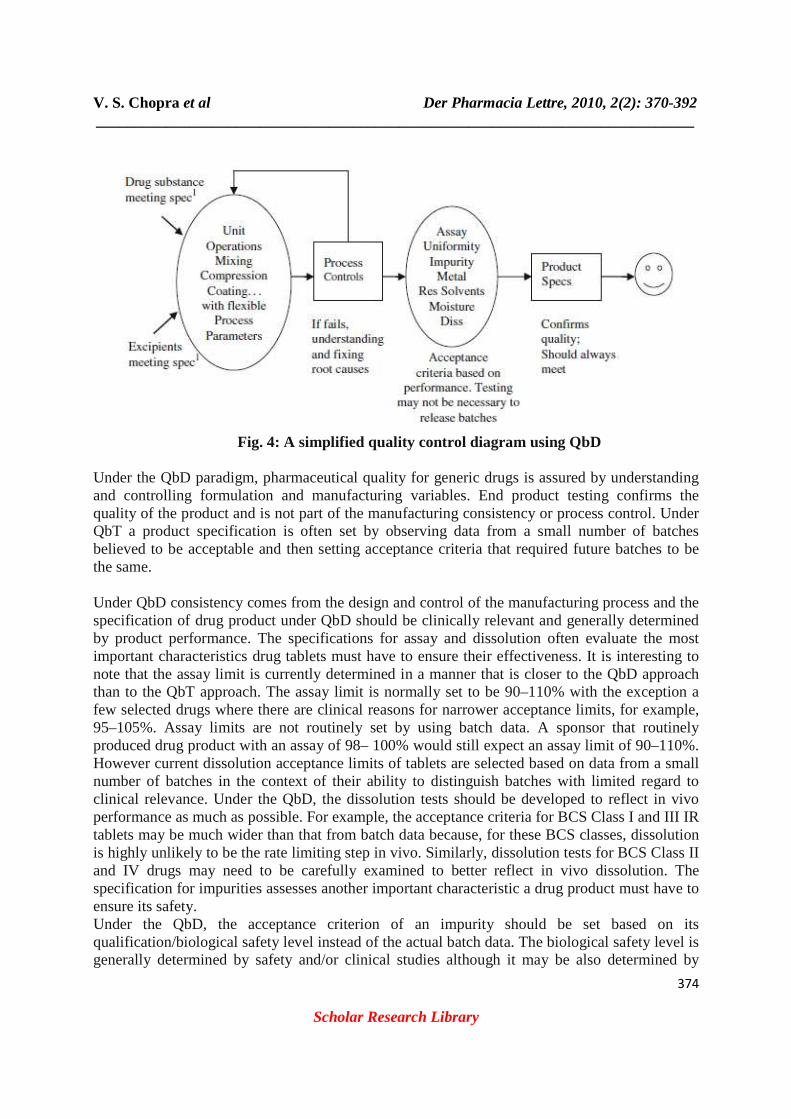
Fig. 3: A simplified quality control diagram using QbT But pharmaceutical QbD is a systematic, scientific, risk-based, holistic and proactive approach to pharmaceutical development that begins with predefined objectives and emphases product and processes understanding and process control. QbD allows the real time release of the product because it has no scope of product failure with respect to quality. Under the QbD, batches may not be actually tested against the specification as the process understanding and/or process control provides sufficient evidences that the batches will meet the specification if tested, which allows the real time release of the batches. Further, the specification under the QbD is solely used for the confirmation of product quality, not manufacturing consistency and process control. Figure (4) shows the tablet compression quality control diagram using QbD.
V. S. Chopra et al Der Pharmacia Lettre, 2010, 2(2): 370-392
_____________________________________________________________________________
374
Scholar Research Library
Fig. 4: A simplified quality control diagram using QbD
Under the QbD paradigm, pharmaceutical quality for generic drugs is assured by understanding and controlling formulation and manufacturing variables. End product testing confirms the quality of the product and is not part of the manufacturing consistency or process control. Under QbT a product specification is often set by observing data from a small number of batches believed to be acceptable and then setting acceptance criteria that required future batches to be the same. Under QbD consistency comes from the design and control of the manufacturing process and the specification of drug product under QbD should be clinically relevant and generally determined by product performance. The specifications for assay and dissolution often evaluate the most important characteristics drug tablets must have to ensure their effectiveness. It is interesting to note that the assay limit is currently determined in a manner that is closer to the QbD approach than to the QbT approach. The assay limit is normally set to be 90–110% with the exception a few selected drugs where there are clinical reasons for narrower acceptance limits, for example, 95–105%. Assay limits are not routinely set by using batch data. A sponsor that routinely produced drug product with an assay of 98– 100% would still expect an assay limit of 90–110%. However current dissolution acceptance limits of tablets are selected based on data from a small number of batches in the context of their ability to distinguish batches with limited regard to clinical relevance. Under the QbD, the dissolution tests should be developed to reflect in vivo performance as much as possible. For example, the acceptance criteria for BCS Class I and III IR tablets may be much wider than that from batch data because, for these BCS classes, dissolution is highly unlikely to be the rate limiting step in vivo. Similarly, dissolution tests for BCS Class II and IV drugs may need to be carefully examined to better reflect in vivo dissolution. The specification for impurities assesses another important characteristic a drug product must have to ensure its safety. Under the QbD, the acceptance criterion of an impurity should be set based on its qualification/biological safety level instead of the actual batch data. The biological safety level is generally determined by safety and/or clinical studies although it may be also determined by
V. S. Chopra et al Der Pharmacia Lettre, 2010, 2(2): 370-392
_____________________________________________________________________________
375
Scholar Research Library
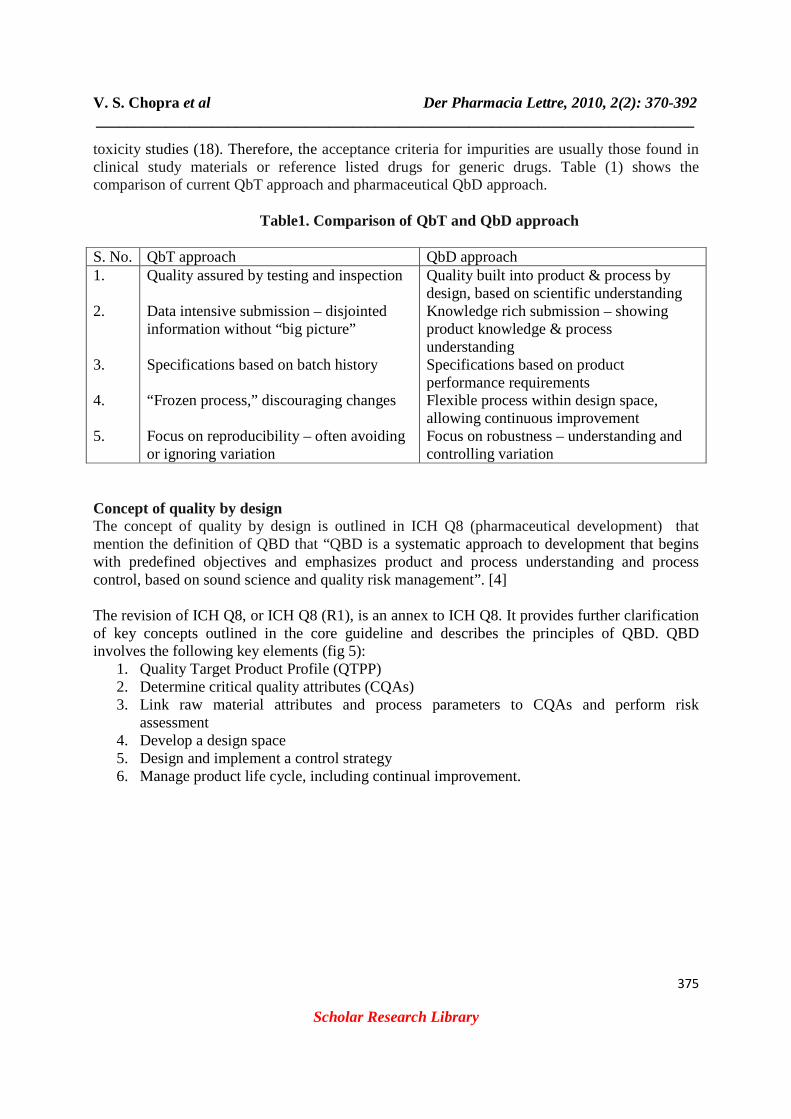
toxicity studies (18). Therefore, the acceptance criteria for impurities are usually those found in clinical study materials or reference listed drugs for generic drugs. Table (1) shows the comparison of current QbT approach and pharmaceutical QbD approach.
Table1. Comparison of QbT and QbD approach
S. No. QbT approach QbD approach 1. 2. 3. 4. 5.
Quality assured by testing and inspection Data intensive submission – disjointed information without “big picture” Specifications based on batch history “Frozen process,” discouraging changes Focus on reproducibility – often avoiding or ignoring variation
Quality built into product & process by design, based on scientific understanding Knowledge rich submission – showing product knowledge & process understanding Specifications based on product performance requirements Flexible process within design space, allowing continuous improvement Focus on robustness – understanding and controlling variation
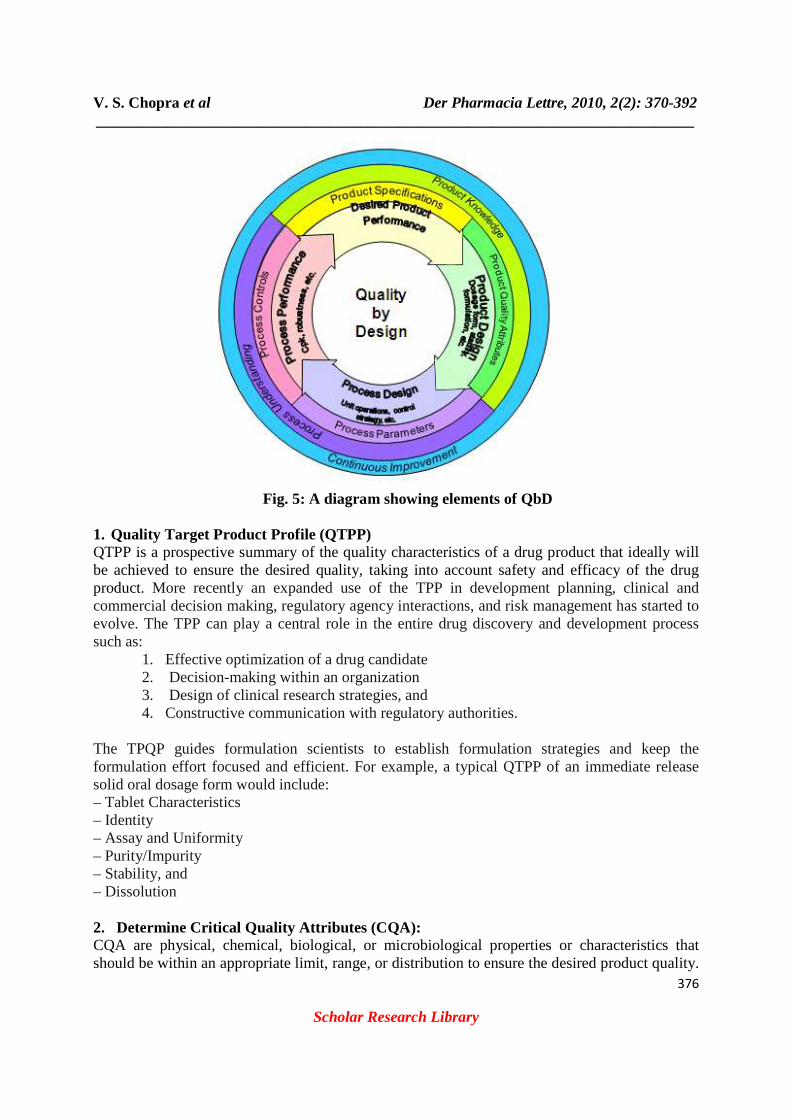
Concept of quality by design The concept of quality by design is outlined in ICH Q8 (pharmaceutical development) that mention the definition of QBD that “QBD is a systematic approach to development that begins with predefined objectives and emphasizes product and process understanding and process control, based on sound science and quality risk management”. [4] The revision of ICH Q8, or ICH Q8 (R1), is an annex to ICH Q8. It provides further clarification of key concepts outlined in the core guideline and describes the principles of QBD. QBD involves the following key elements (fig 5):
1. Quality Target Product Profile (QTPP) 2. Determine critical quality attributes (CQAs) 3. Link raw material attributes and process parameters to CQAs and perform risk
assessment 4. Develop a design space 5. Design and implement a control strategy 6. Manage product life cycle, including continual improvement.
V. S. Chopra et al Der Pharmacia Lettre, 2010, 2(2): 370-392
_____________________________________________________________________________
376
Scholar Research Library
Fig. 5: A diagram showing elements of QbD
1. Quality Target Product Profile (QTPP) QTPP is a prospective summary of the quality characteristics of a drug product that ideally will be achieved to ensure the desired quality, taking into account safety and efficacy of the drug product. More recently an expanded use of the TPP in development planning, clinical and commercial decision making, regulatory agency interactions, and risk management has started to evolve. The TPP can play a central role in the entire drug discovery and development process such as:
1. Effective optimization of a drug candidate 2. Decision-making within an organization 3. Design of clinical research strategies, and 4. Constructive communication with regulatory authorities.
The TPQP guides formulation scientists to establish formulation strategies and keep the formulation effort focused and efficient. For example, a typical QTPP of an immediate release solid oral dosage form would include: – Tablet Characteristics – Identity – Assay and Uniformity – Purity/Impurity – Stability, and – Dissolution 2. Determine Critical Quality Attributes (CQA): CQA are physical, chemical, biological, or microbiological properties or characteristics that should be within an appropriate limit, range, or distribution to ensure the desired product quality.
V. S. Chopra et al Der Pharmacia Lettre, 2010, 2(2): 370-392
_____________________________________________________________________________
377
Scholar Research Library
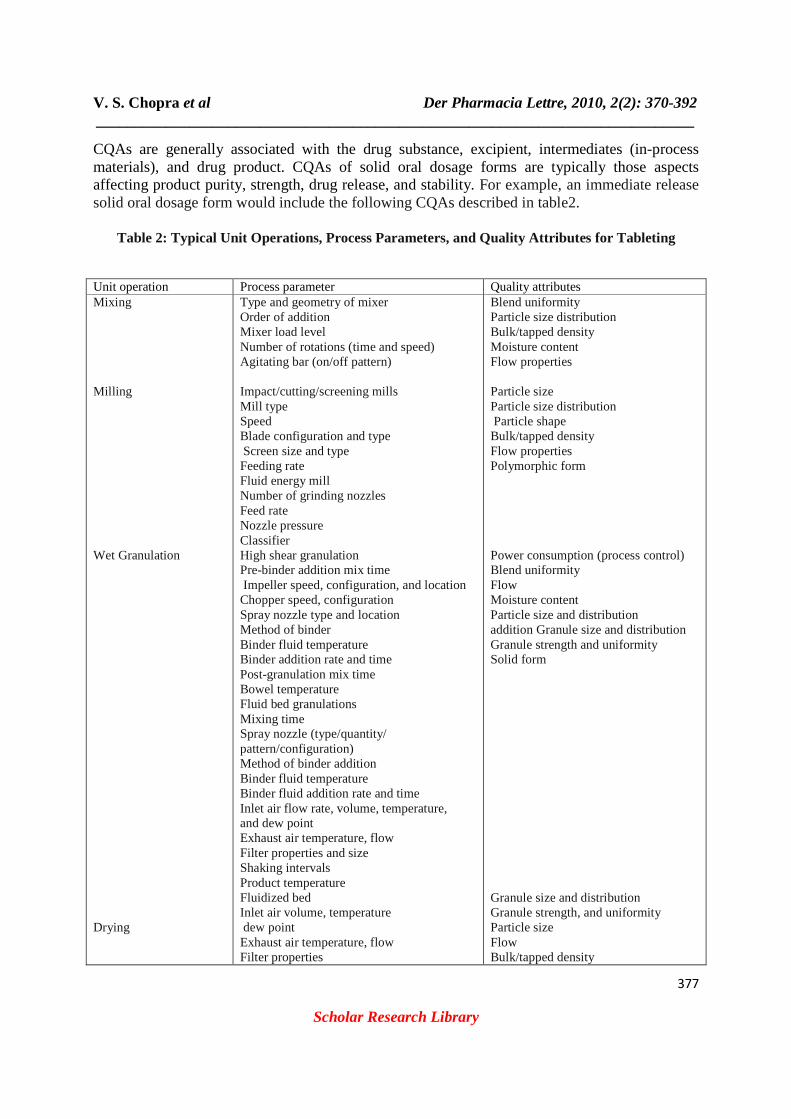
CQAs are generally associated with the drug substance, excipient, intermediates (in-process materials), and drug product. CQAs of solid oral dosage forms are typically those aspects affecting product purity, strength, drug release, and stability. For example, an immediate release solid oral dosage form would include the following CQAs described in table2.
Table 2: Typical Unit Operations, Process Parameters, and Quality Attributes for Tableting
Unit operation Process parameter Quality attributes Mixing Milling Wet Granulation Drying
Type and geometry of mixer Order of addition Mixer load level Number of rotations (time and speed) Agitating bar (on/off pattern) Impact/cutting/screening mills Mill type Speed Blade configuration and type Screen size and type Feeding rate Fluid energy mill Number of grinding nozzles Feed rate Nozzle pressure Classifier High shear granulation Pre-binder addition mix time Impeller speed, configuration, and location Chopper speed, configuration Spray nozzle type and location Method of binder Binder fluid temperature Binder addition rate and time Post-granulation mix time Bowel temperature Fluid bed granulations Mixing time Spray nozzle (type/quantity/ pattern/configuration) Method of binder addition Binder fluid temperature Binder fluid addition rate and time Inlet air flow rate, volume, temperature, and dew point Exhaust air temperature, flow Filter properties and size Shaking intervals Product temperature Fluidized bed Inlet air volume, temperature dew point Exhaust air temperature, flow Filter properties
Blend uniformity Particle size distribution Bulk/tapped density Moisture content Flow properties Particle size Particle size distribution Particle shape Bulk/tapped density Flow properties Polymorphic form Power consumption (process control) Blend uniformity Flow Moisture content Particle size and distribution addition Granule size and distribution Granule strength and uniformity Solid form Granule size and distribution Granule strength, and uniformity Particle size Flow Bulk/tapped density
V. S. Chopra et al Der Pharmacia Lettre, 2010, 2(2): 370-392
_____________________________________________________________________________
378
Scholar Research Library
Roller compaction Compression Coating, Fluid bed, Pan
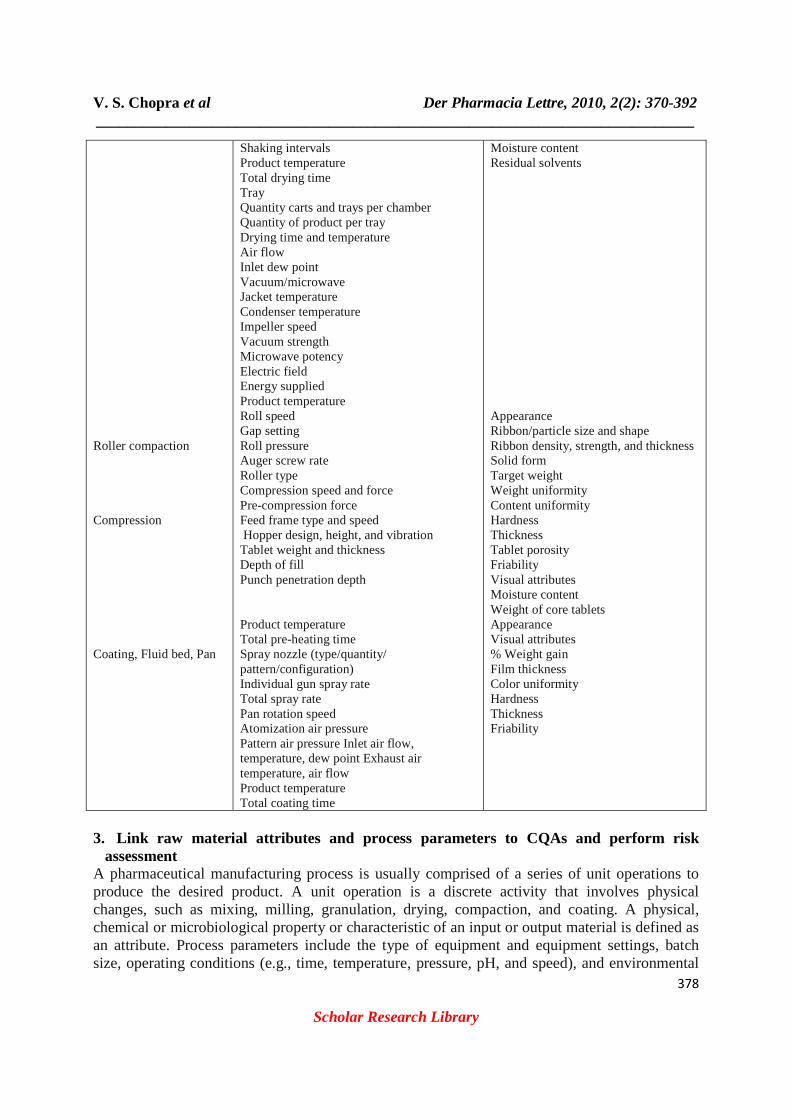
Shaking intervals Product temperature Total drying time Tray Quantity carts and trays per chamber Quantity of product per tray Drying time and temperature Air flow Inlet dew point Vacuum/microwave Jacket temperature Condenser temperature Impeller speed Vacuum strength Microwave potency Electric field Energy supplied Product temperature Roll speed Gap setting Roll pressure Auger screw rate Roller type Compression speed and force Pre-compression force Feed frame type and speed Hopper design, height, and vibration Tablet weight and thickness Depth of fill Punch penetration depth Product temperature Total pre-heating time Spray nozzle (type/quantity/ pattern/configuration) Individual gun spray rate Total spray rate Pan rotation speed Atomization air pressure Pattern air pressure Inlet air flow, temperature, dew point Exhaust air temperature, air flow Product temperature Total coating time
Moisture content Residual solvents Appearance Ribbon/particle size and shape Ribbon density, strength, and thickness Solid form Target weight Weight uniformity Content uniformity Hardness Thickness Tablet porosity Friability Visual attributes Moisture content Weight of core tablets Appearance Visual attributes % Weight gain Film thickness Color uniformity Hardness Thickness Friability
3. Link raw material attributes and process parameters to CQAs and perform risk
assessment A pharmaceutical manufacturing process is usually comprised of a series of unit operations to produce the desired product. A unit operation is a discrete activity that involves physical changes, such as mixing, milling, granulation, drying, compaction, and coating. A physical, chemical or microbiological property or characteristic of an input or output material is defined as an attribute. Process parameters include the type of equipment and equipment settings, batch size, operating conditions (e.g., time, temperature, pressure, pH, and speed), and environmental
V. S. Chopra et al Der Pharmacia Lettre, 2010, 2(2): 370-392
_____________________________________________________________________________
379
Scholar Research Library
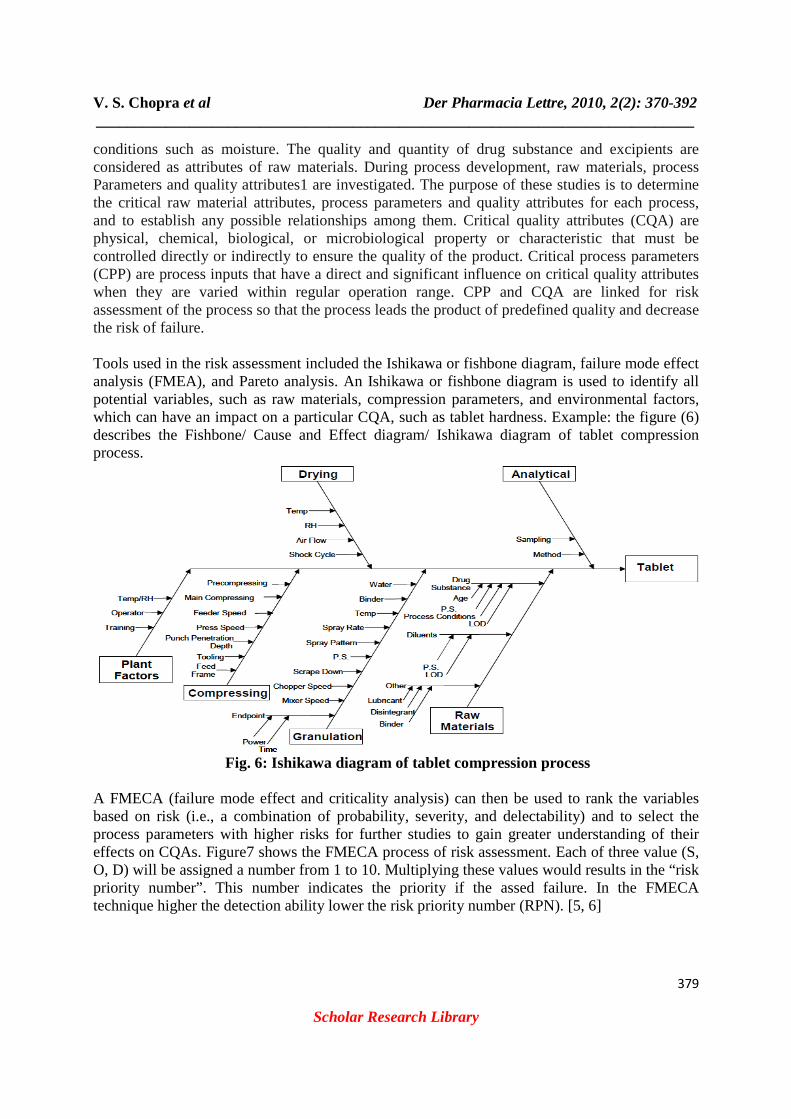
conditions such as moisture. The quality and quantity of drug substance and excipients are considered as attributes of raw materials. During process development, raw materials, process Parameters and quality attributes1 are investigated. The purpose of these studies is to determine the critical raw material attributes, process parameters and quality attributes for each process, and to establish any possible relationships among them. Critical quality attributes (CQA) are physical, chemical, biological, or microbiological property or characteristic that must be controlled directly or indirectly to ensure the quality of the product. Critical process parameters (CPP) are process inputs that have a direct and significant influence on critical quality attributes when they are varied within regular operation range. CPP and CQA are linked for risk assessment of the process so that the process leads the product of predefined quality and decrease the risk of failure. Tools used in the risk assessment included the Ishikawa or fishbone diagram, failure mode effect analysis (FMEA), and Pareto analysis. An Ishikawa or fishbone diagram is used to identify all potential variables, such as raw materials, compression parameters, and environmental factors, which can have an impact on a particular CQA, such as tablet hardness. Example: the figure (6) describes the Fishbone/ Cause and Effect diagram/ Ishikawa diagram of tablet compression process.
Fig. 6: Ishikawa diagram of tablet compression process
A FMECA (failure mode effect and criticality analysis) can then be used to rank the variables based on risk (i.e., a combination of probability, severity, and delectability) and to select the process parameters with higher risks for further studies to gain greater understanding of their effects on CQAs. Figure7 shows the FMECA process of risk assessment. Each of three value (S, O, D) will be assigned a number from 1 to 10. Multiplying these values would results in the “risk priority number”. This number indicates the priority if the assed failure. In the FMECA technique higher the detection ability lower the risk priority number (RPN). [5, 6]

V. S. Chopra et al Der Pharmacia Lettre, 2010, 2(2): 370-392
_____________________________________________________________________________
380
Scholar Research Library
Fig. 7: Chart showing FMECA technique and calculating the RPN/risk number
Example1. We consider a tableting process which has following five steps 1. Milling 2. Dry blending 3. Wet granulation 4. Lubrication 5. Compression
Risk priority no/risk score (S.O.D) of this process is calculated in the following table (3) by both traditional approach and QbD approach.
Table 3: S.O.D calculation of the tableting process
Traditional approach(table 3a)
S. No.
Process steps
equipment
Cause of failure
Potential effect
Effect on entire system
Severity
Occurrence probability
Criticality
Detection
SOD control
1. 2. 3. 4. 5.
Milling Dry blending Wet massing Lubrication Compression
Jet mill High shear High shear V blender Tablet press
Overloading Excipient quality Excipient quality Load Speed
Large particle size Homogenicity Over granulation Flow, dissolution Weight, hardness
Disso. Failure Content uni. Failure Tableting problems Cont. uni., disso. Variations
9 8 8 9 8
5 3 4 8 6
45 24 64 36 48
2 5 8 8 8
90 120 512 288 384
Particle Size Blend homog. Time Time Release test
V. S. Chopra et al Der Pharmacia Lettre, 2010, 2(2): 370-392
_____________________________________________________________________________
381
Scholar Research Library
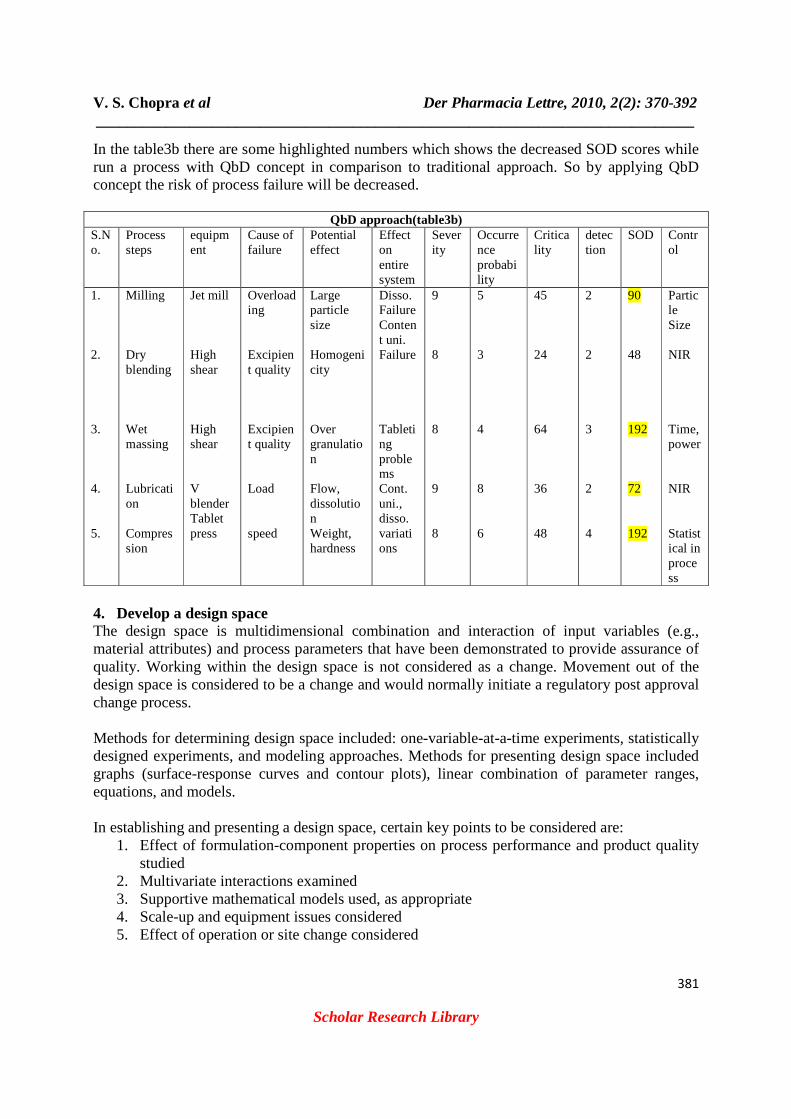
In the table3b there are some highlighted numbers which shows the decreased SOD scores while run a process with QbD concept in comparison to traditional approach. So by applying QbD concept the risk of process failure will be decreased.
QbD approach(table3b)
S.No.
Process steps
equipment
Cause of failure
Potential effect
Effect on entire system
Severity
Occurrence probability
Criticality
detection
SOD Control
1. 2. 3. 4. 5.
Milling Dry blending Wet massing Lubrication Compression
Jet mill High shear High shear V blender Tablet press
Overloading Excipient quality Excipient quality Load speed
Large particle size Homogenicity Over granulation Flow, dissolution Weight, hardness
Disso. Failure Content uni. Failure Tableting problems Cont. uni., disso. variations
9 8 8 9 8
5 3 4 8 6
45 24 64 36 48
2 2 3 2 4
90 48 192 72 192
Particle Size NIR Time, power NIR Statistical in process
4. Develop a design space The design space is multidimensional combination and interaction of input variables (e.g., material attributes) and process parameters that have been demonstrated to provide assurance of quality. Working within the design space is not considered as a change. Movement out of the design space is considered to be a change and would normally initiate a regulatory post approval change process. Methods for determining design space included: one-variable-at-a-time experiments, statistically designed experiments, and modeling approaches. Methods for presenting design space included graphs (surface-response curves and contour plots), linear combination of parameter ranges, equations, and models. In establishing and presenting a design space, certain key points to be considered are:
1. Effect of formulation-component properties on process performance and product quality studied
2. Multivariate interactions examined 3. Supportive mathematical models used, as appropriate 4. Scale-up and equipment issues considered 5. Effect of operation or site change considered
V. S. Chopra et al Der Pharmacia Lettre, 2010, 2(2): 370-392
_____________________________________________________________________________
382
Scholar Research Library
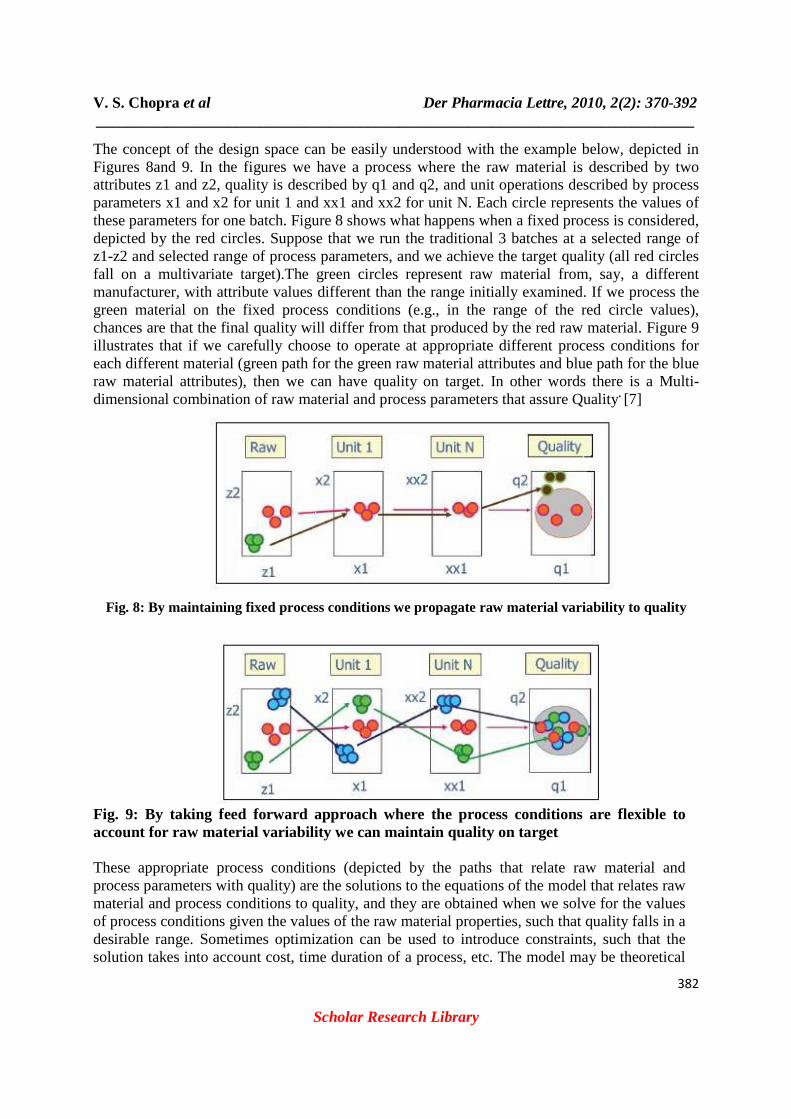
The concept of the design space can be easily understood with the example below, depicted in Figures 8and 9. In the figures we have a process where the raw material is described by two attributes z1 and z2, quality is described by q1 and q2, and unit operations described by process parameters x1 and x2 for unit 1 and xx1 and xx2 for unit N. Each circle represents the values of these parameters for one batch. Figure 8 shows what happens when a fixed process is considered, depicted by the red circles. Suppose that we run the traditional 3 batches at a selected range of z1-z2 and selected range of process parameters, and we achieve the target quality (all red circles fall on a multivariate target).The green circles represent raw material from, say, a different manufacturer, with attribute values different than the range initially examined. If we process the green material on the fixed process conditions (e.g., in the range of the red circle values), chances are that the final quality will differ from that produced by the red raw material. Figure 9 illustrates that if we carefully choose to operate at appropriate different process conditions for each different material (green path for the green raw material attributes and blue path for the blue raw material attributes), then we can have quality on target. In other words there is a Multi-dimensional combination of raw material and process parameters that assure Quality. [7]
Fig. 8: By maintaining fixed process conditions we propagate raw material variability to quality
Fig. 9: By taking feed forward approach where the process conditions are flexible to account for raw material variability we can maintain quality on target These appropriate process conditions (depicted by the paths that relate raw material and process parameters with quality) are the solutions to the equations of the model that relates raw material and process conditions to quality, and they are obtained when we solve for the values of process conditions given the values of the raw material properties, such that quality falls in a desirable range. Sometimes optimization can be used to introduce constraints, such that the solution takes into account cost, time duration of a process, etc. The model may be theoretical
V. S. Chopra et al Der Pharmacia Lettre, 2010, 2(2): 370-392
_____________________________________________________________________________
383
Scholar Research Library
or empirical or hybrid. In other words, we can express Quality as a function (model) of the raw Material attributes and Process Parameters:
that is,
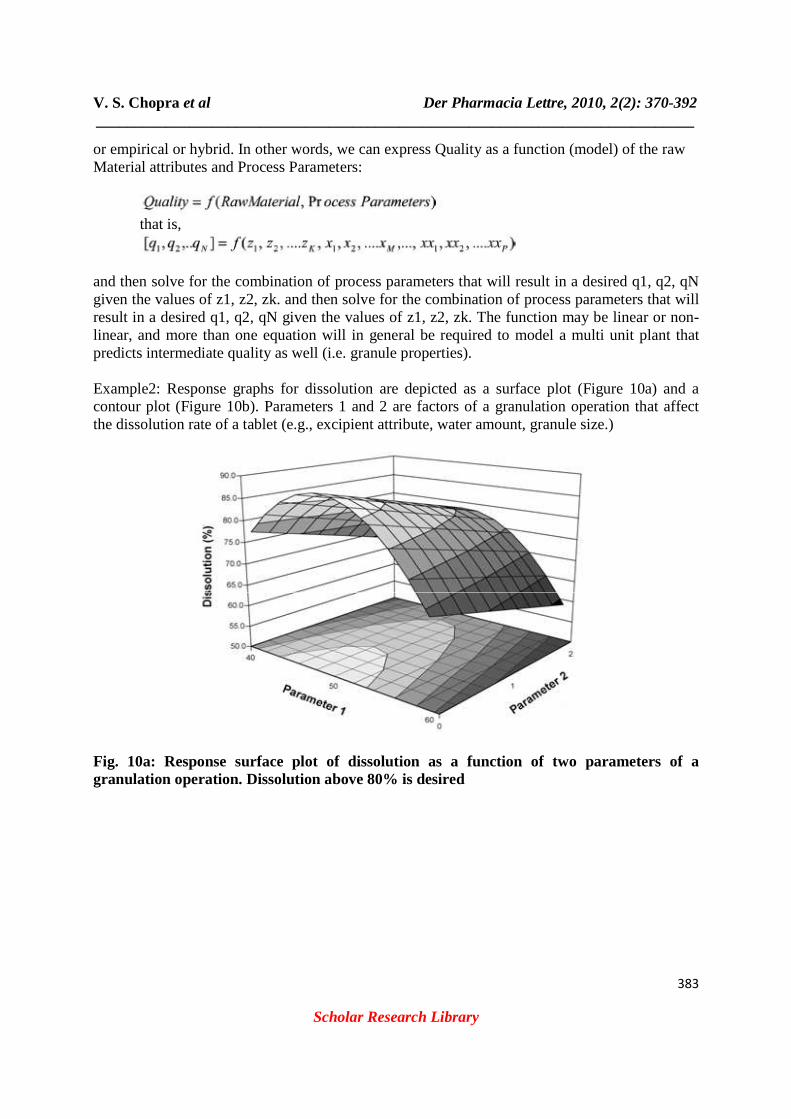
and then solve for the combination of process parameters that will result in a desired q1, q2, qN given the values of z1, z2, zk. and then solve for the combination of process parameters that will result in a desired q1, q2, qN given the values of z1, z2, zk. The function may be linear or non-linear, and more than one equation will in general be required to model a multi unit plant that predicts intermediate quality as well (i.e. granule properties). Example2: Response graphs for dissolution are depicted as a surface plot (Figure 10a) and a contour plot (Figure 10b). Parameters 1 and 2 are factors of a granulation operation that affect the dissolution rate of a tablet (e.g., excipient attribute, water amount, granule size.)
Fig. 10a: Response surface plot of dissolution as a function of two parameters of a granulation operation. Dissolution above 80% is desired
V. S. Chopra et al Der Pharmacia Lettre, 2010, 2(2): 370-392
_____________________________________________________________________________
384
Scholar Research Library
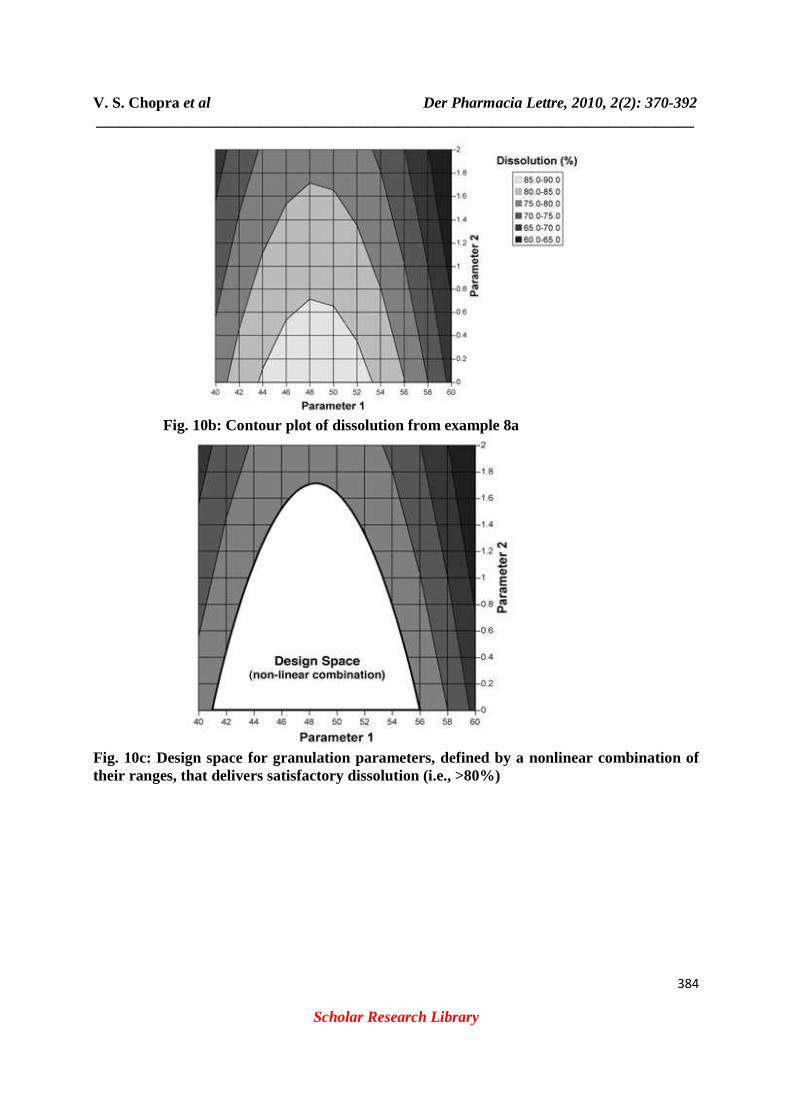
Fig. 10b: Contour plot of dissolution from example 8a
Fig. 10c: Design space for granulation parameters, defined by a nonlinear combination of their ranges, that delivers satisfactory dissolution (i.e., >80%)
V. S. Chopra et al Der Pharmacia Lettre, 2010, 2(2): 370-392
_____________________________________________________________________________
385
Scholar Research Library
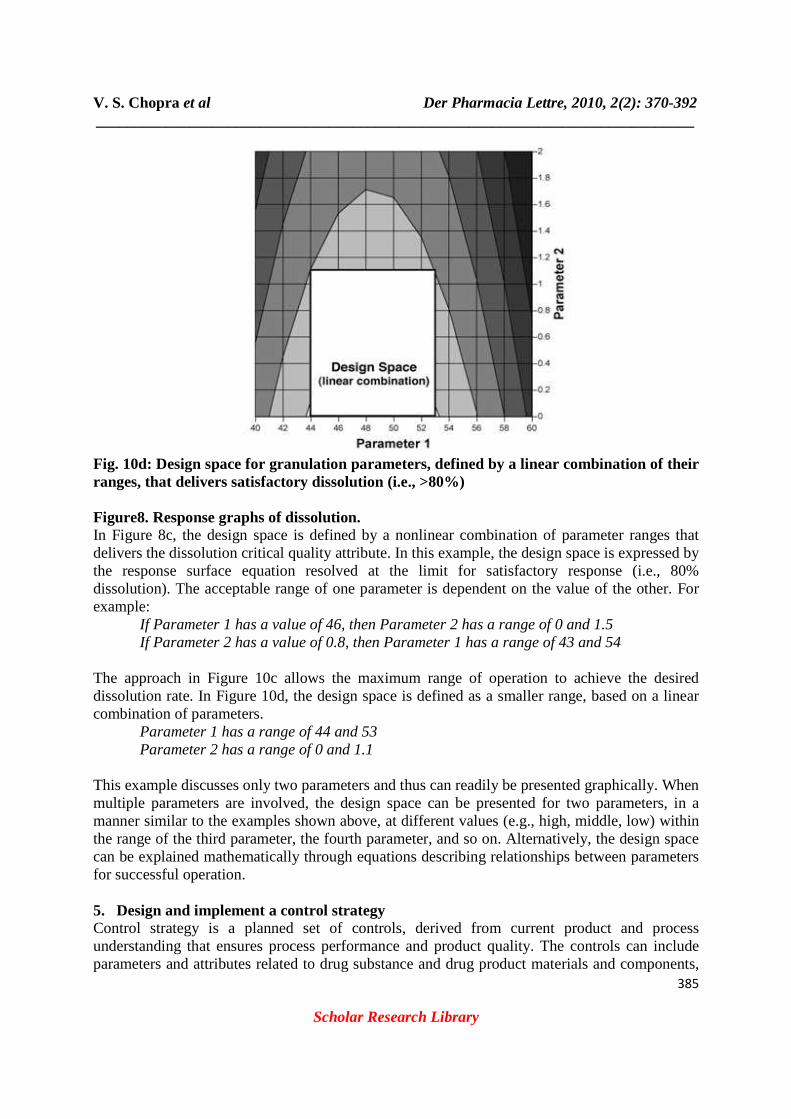
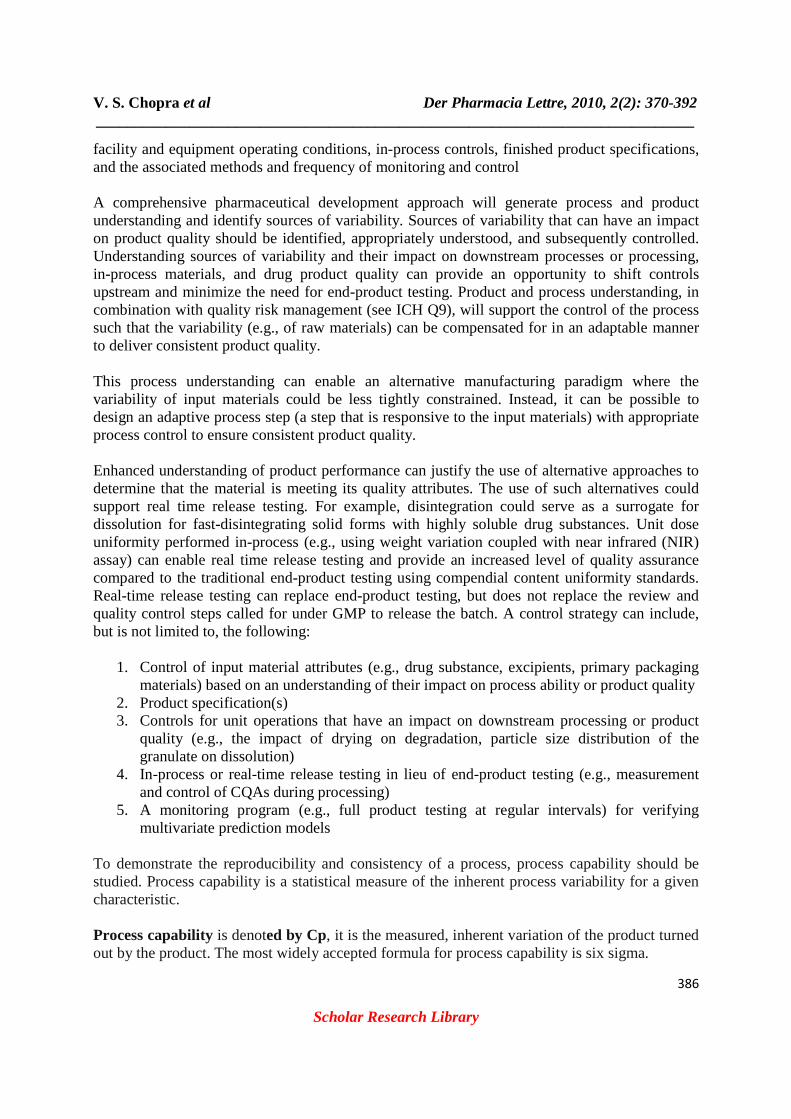
Fig. 10d: Design space for granulation parameters, defined by a linear combination of their ranges, that delivers satisfactory dissolution (i.e., >80%) Figure8. Response graphs of dissolution. In Figure 8c, the design space is defined by a nonlinear combination of parameter ranges that delivers the dissolution critical quality attribute. In this example, the design space is expressed by the response surface equation resolved at the limit for satisfactory response (i.e., 80% dissolution). The acceptable range of one parameter is dependent on the value of the other. For example: If Parameter 1 has a value of 46, then Parameter 2 has a range of 0 and 1.5 If Parameter 2 has a value of 0.8, then Parameter 1 has a range of 43 and 54 The approach in Figure 10c allows the maximum range of operation to achieve the desired dissolution rate. In Figure 10d, the design space is defined as a smaller range, based on a linear combination of parameters. Parameter 1 has a range of 44 and 53 Parameter 2 has a range of 0 and 1.1 This example discusses only two parameters and thus can readily be presented graphically. When multiple parameters are involved, the design space can be presented for two parameters, in a manner similar to the examples shown above, at different values (e.g., high, middle, low) within the range of the third parameter, the fourth parameter, and so on. Alternatively, the design space can be explained mathematically through equations describing relationships between parameters for successful operation. 5. Design and implement a control strategy Control strategy is a planned set of controls, derived from current product and process understanding that ensures process performance and product quality. The controls can include parameters and attributes related to drug substance and drug product materials and components,
V. S. Chopra et al Der Pharmacia Lettre, 2010, 2(2): 370-392
_____________________________________________________________________________
386
Scholar Research Library
facility and equipment operating conditions, in-process controls, finished product specifications, and the associated methods and frequency of monitoring and control A comprehensive pharmaceutical development approach will generate process and product understanding and identify sources of variability. Sources of variability that can have an impact on product quality should be identified, appropriately understood, and subsequently controlled. Understanding sources of variability and their impact on downstream processes or processing, in-process materials, and drug product quality can provide an opportunity to shift controls upstream and minimize the need for end-product testing. Product and process understanding, in combination with quality risk management (see ICH Q9), will support the control of the process such that the variability (e.g., of raw materials) can be compensated for in an adaptable manner to deliver consistent product quality. This process understanding can enable an alternative manufacturing paradigm where the variability of input materials could be less tightly constrained. Instead, it can be possible to design an adaptive process step (a step that is responsive to the input materials) with appropriate process control to ensure consistent product quality. Enhanced understanding of product performance can justify the use of alternative approaches to determine that the material is meeting its quality attributes. The use of such alternatives could support real time release testing. For example, disintegration could serve as a surrogate for dissolution for fast-disintegrating solid forms with highly soluble drug substances. Unit dose uniformity performed in-process (e.g., using weight variation coupled with near infrared (NIR) assay) can enable real time release testing and provide an increased level of quality assurance compared to the traditional end-product testing using compendial content uniformity standards. Real-time release testing can replace end-product testing, but does not replace the review and quality control steps called for under GMP to release the batch. A control strategy can include, but is not limited to, the following:
1. Control of input material attributes (e.g., drug substance, excipients, primary packaging materials) based on an understanding of their impact on process ability or product quality
2. Product specification(s) 3. Controls for unit operations that have an impact on downstream processing or product
quality (e.g., the impact of drying on degradation, particle size distribution of the granulate on dissolution)
4. In-process or real-time release testing in lieu of end-product testing (e.g., measurement and control of CQAs during processing)
5. A monitoring program (e.g., full product testing at regular intervals) for verifying multivariate prediction models
To demonstrate the reproducibility and consistency of a process, process capability should be studied. Process capability is a statistical measure of the inherent process variability for a given characteristic. Process capability is denoted by Cp, it is the measured, inherent variation of the product turned out by the product. The most widely accepted formula for process capability is six sigma.
V. S. Chopra et al Der Pharmacia Lettre, 2010, 2(2): 370-392
_____________________________________________________________________________
387
Scholar Research Library
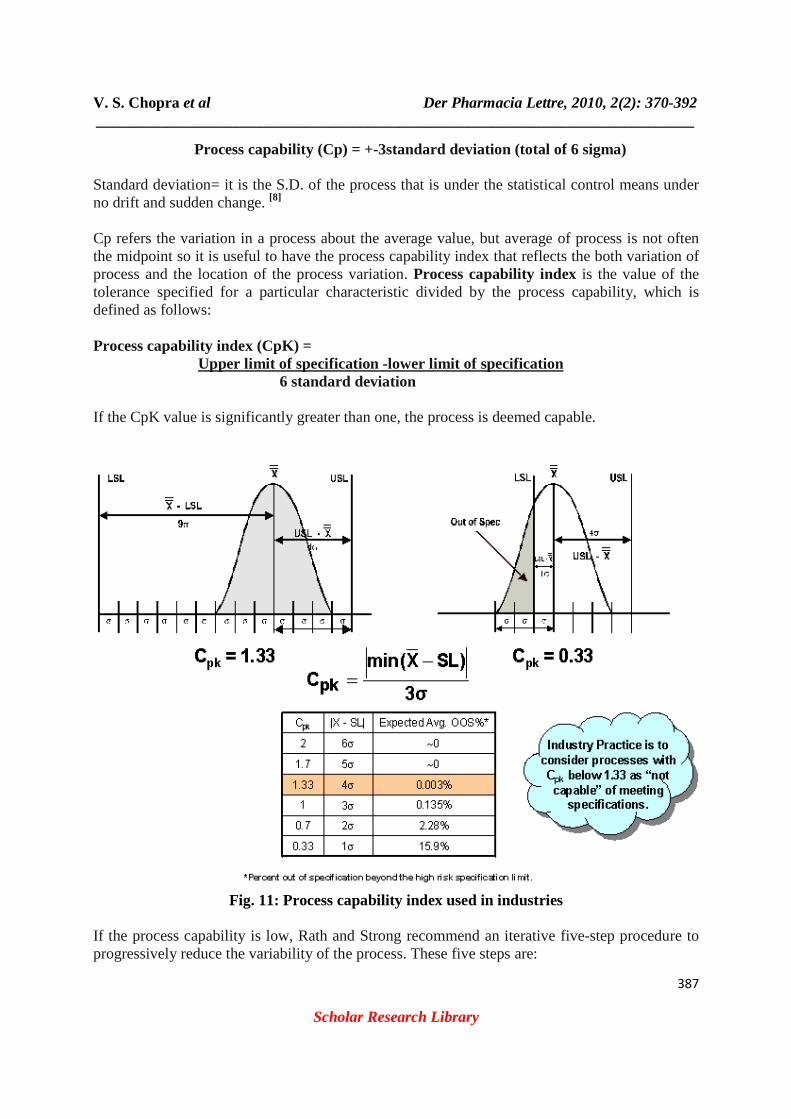
Process capability (Cp) = +-3standard deviation (total of 6 sigma) Standard deviation= it is the S.D. of the process that is under the statistical control means under no drift and sudden change. [8] Cp refers the variation in a process about the average value, but average of process is not often the midpoint so it is useful to have the process capability index that reflects the both variation of process and the location of the process variation. Process capability index is the value of the tolerance specified for a particular characteristic divided by the process capability, which is defined as follows: Process capability index (CpK) = Upper limit of specification -lower limit of specification
6 standard deviation If the CpK value is significantly greater than one, the process is deemed capable.
Fig. 11: Process capability index used in industries
If the process capability is low, Rath and Strong recommend an iterative five-step procedure to progressively reduce the variability of the process. These five steps are:
V. S. Chopra et al Der Pharmacia Lettre, 2010, 2(2): 370-392
_____________________________________________________________________________
388
Scholar Research Library
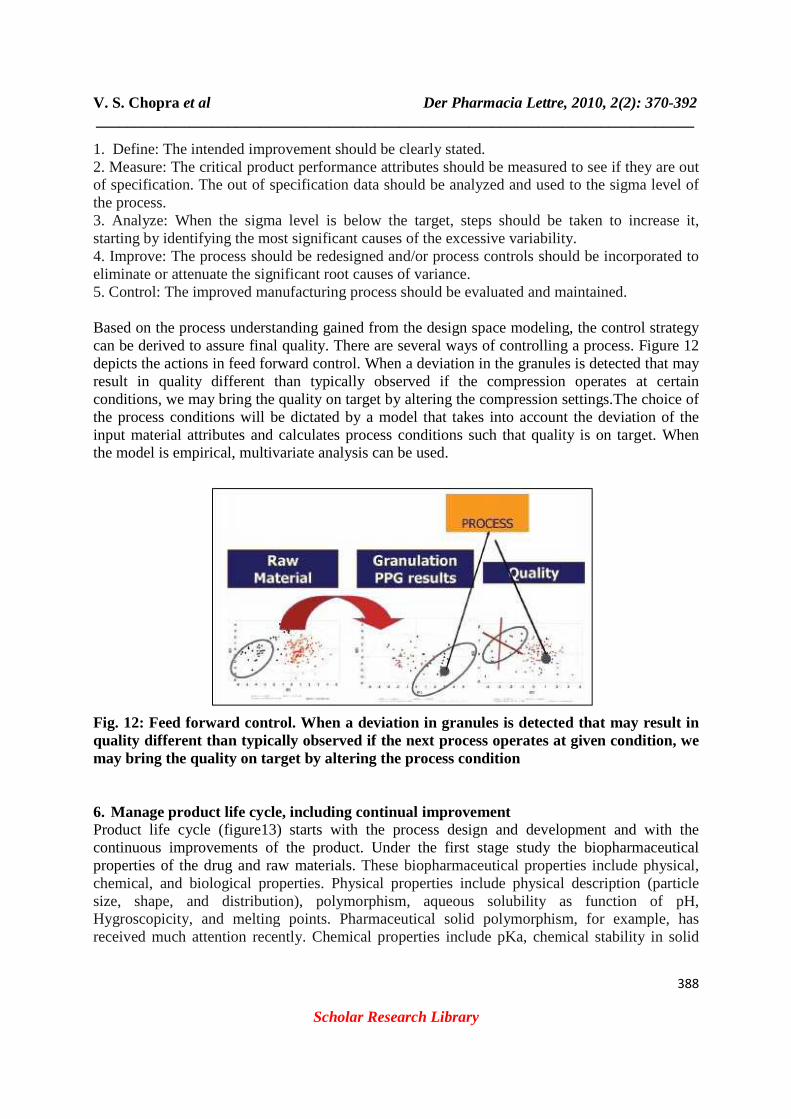
1. Define: The intended improvement should be clearly stated. 2. Measure: The critical product performance attributes should be measured to see if they are out of specification. The out of specification data should be analyzed and used to the sigma level of the process. 3. Analyze: When the sigma level is below the target, steps should be taken to increase it, starting by identifying the most significant causes of the excessive variability. 4. Improve: The process should be redesigned and/or process controls should be incorporated to eliminate or attenuate the significant root causes of variance. 5. Control: The improved manufacturing process should be evaluated and maintained. Based on the process understanding gained from the design space modeling, the control strategy can be derived to assure final quality. There are several ways of controlling a process. Figure 12 depicts the actions in feed forward control. When a deviation in the granules is detected that may result in quality different than typically observed if the compression operates at certain conditions, we may bring the quality on target by altering the compression settings.The choice of the process conditions will be dictated by a model that takes into account the deviation of the input material attributes and calculates process conditions such that quality is on target. When the model is empirical, multivariate analysis can be used.
Fig. 12: Feed forward control. When a deviation in granules is detected that may result in quality different than typically observed if the next process operates at given condition, we may bring the quality on target by altering the process condition
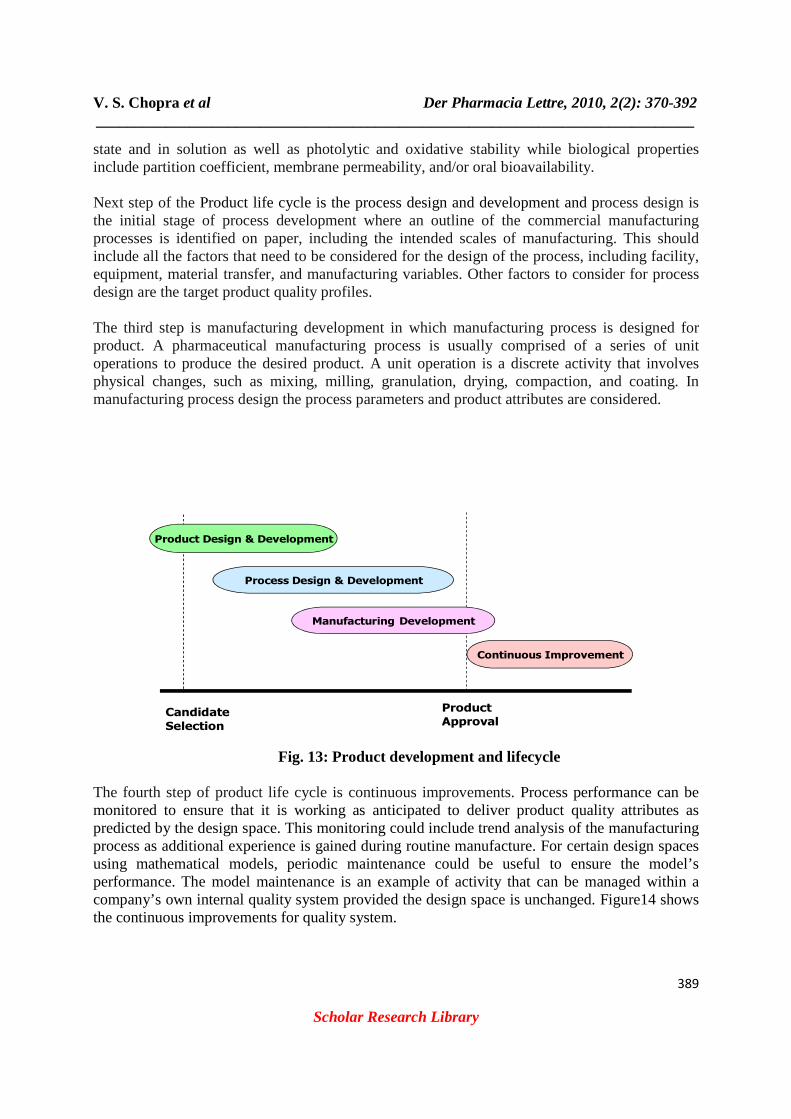
6. Manage product life cycle, including continual improvement Product life cycle (figure13) starts with the process design and development and with the continuous improvements of the product. Under the first stage study the biopharmaceutical properties of the drug and raw materials. These biopharmaceutical properties include physical, chemical, and biological properties. Physical properties include physical description (particle size, shape, and distribution), polymorphism, aqueous solubility as function of pH, Hygroscopicity, and melting points. Pharmaceutical solid polymorphism, for example, has received much attention recently. Chemical properties include pKa, chemical stability in solid
V. S. Chopra et al Der Pharmacia Lettre, 2010, 2(2): 370-392
_____________________________________________________________________________
389
Scholar Research Library
state and in solution as well as photolytic and oxidative stability while biological properties include partition coefficient, membrane permeability, and/or oral bioavailability. Next step of the Product life cycle is the process design and development and process design is the initial stage of process development where an outline of the commercial manufacturing processes is identified on paper, including the intended scales of manufacturing. This should include all the factors that need to be considered for the design of the process, including facility, equipment, material transfer, and manufacturing variables. Other factors to consider for process design are the target product quality profiles. The third step is manufacturing development in which manufacturing process is designed for product. A pharmaceutical manufacturing process is usually comprised of a series of unit operations to produce the desired product. A unit operation is a discrete activity that involves physical changes, such as mixing, milling, granulation, drying, compaction, and coating. In manufacturing process design the process parameters and product attributes are considered.
Candidate
Selection
Product Design & Development
Process Design & Development
Manufacturing Development
Product
Approval
Continuous Improvement
Fig. 13: Product development and lifecycle
The fourth step of product life cycle is continuous improvements. Process performance can be monitored to ensure that it is working as anticipated to deliver product quality attributes as predicted by the design space. This monitoring could include trend analysis of the manufacturing process as additional experience is gained during routine manufacture. For certain design spaces using mathematical models, periodic maintenance could be useful to ensure the model’s performance. The model maintenance is an example of activity that can be managed within a company’s own internal quality system provided the design space is unchanged. Figure14 shows the continuous improvements for quality system.
V. S. Chopra et al Der Pharmacia Lettre, 2010, 2(2): 370-392
_____________________________________________________________________________
390
Scholar Research Library
Fig. 14: Quality system for continuous improvements
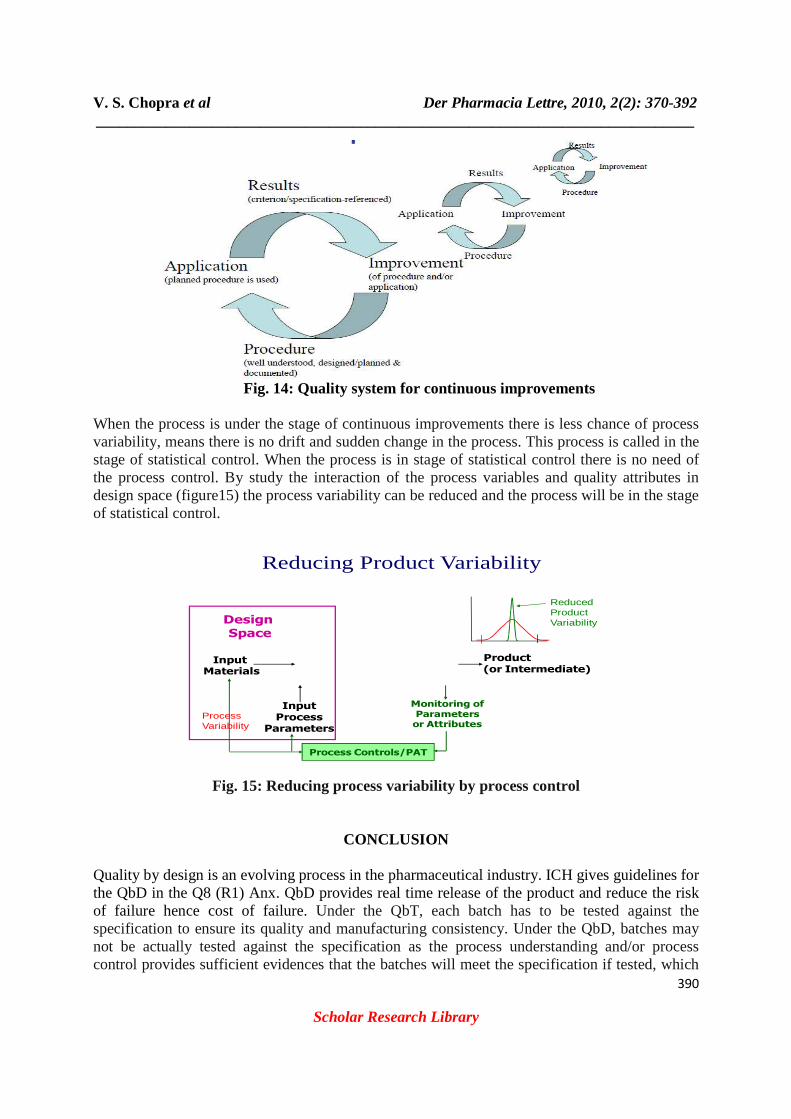
When the process is under the stage of continuous improvements there is less chance of process variability, means there is no drift and sudden change in the process. This process is called in the stage of statistical control. When the process is in stage of statistical control there is no need of the process control. By study the interaction of the process variables and quality attributes in design space (figure15) the process variability can be reduced and the process will be in the stage of statistical control.
Reducing Product Variability
Design Space
Monitoring ofParametersor Attributes
Process Controls/PAT
InputProcessParameters
Input Materials
Product (or Intermediate)
ProductVariability
ReducedProductVariability
ProcessVariability
Fig. 15: Reducing process variability by process control
CONCLUSION Quality by design is an evolving process in the pharmaceutical industry. ICH gives guidelines for the QbD in the Q8 (R1) Anx. QbD provides real time release of the product and reduce the risk of failure hence cost of failure. Under the QbT, each batch has to be tested against the specification to ensure its quality and manufacturing consistency. Under the QbD, batches may not be actually tested against the specification as the process understanding and/or process control provides sufficient evidences that the batches will meet the specification if tested, which
V. S. Chopra et al Der Pharmacia Lettre, 2010, 2(2): 370-392
_____________________________________________________________________________
391
Scholar Research Library
allows the real time release of the batches so QbD is a better approach than QbT. Interaction of the raw material and process parameter with CQAs is important part of the QbD. Design space is the multidimensional combination and interaction between process parameter and quality attributes of the product. If we change the process parameter within the design space then the product will be of predefined quality. When the process is running within design space then no need to control the process but if the process is running out of design then there is need of process control and process improvements so that the process will give the product with desired QTPP and predefined quality. Six sigma continuous improvement approach is used to control the process which have five phases: define, measure, analyze, improve and, control phase. Process capability is used to determine whether the process is capable or not. If the CpK value is greater than 1, then the process is capable. QbD is novel approach which is currently being used in pharmaceutical industry than empirical approaches of the product development because it reduces the product variability.
REFERENCES
[1] Yu Lx. Pharmaceutical Research, vol.25, 4, 2008; 781-791 [2] Arnurn PV. A FDA Perspective on Quality by Design. [3] Aegis Analytical Corporation. Quality by Design is Essential in New Regulatory Environment, http://www.aegiscorp.com [4] ICH Q8 (R1), 2008. Pharmaceutical Development. Part I: Pharmaceutical Development, a. And Part II: Annex to Pharmaceutical Development., http://www.ich.org. [5] ICH Q9, 2005. Quality Risk Management., http://www.ich.org [6] Nesh RA, Wachter AH. Pharmaceutical Process Validation. Edn 3, Marcel DAKKER Inc, Newyork, 2005. PP. 452-454 [7] Kourti K. Quality by Design in the Pharmaceutical Industry: The Role of Multivariate analysis. [8] Gryna FM, Chua RCH, Defeo JA. Juran’s Quality Planning and Analysis For Enterprise. Edn 5, Tata MacGraw-Hill Publishing Company Ltd, New Delhi, 2007, PP. 67-199, 689-694 [9] ICH Q10, 2008a. Pharmaceutical Quality Systems., http://www.ich.org [10] VonBehren D, Quality by Design: The Automated Pharmaceutical assay: An Overview. SOTAX Corporation. PP.1-5 [11] Huang J, Kaul G, Chatapalli R, Hernandez-Abad P, Ghosh K, Nagi A. International Journal of Pharmaceutics. 2009;382:23-32 [12] Wu H, Tawakkul M, White M, Khan MA. International Journal of Pharmaceutics. 2009; 372:39-48 [13] Chen C, Moore C. Role of Statistics in Pharmaceutical Development Using Quality-by-Design Approach- An FDA Perspective. In the Proceeding of FDA/ Industry Statistics Workshop. Sep 27-29, 2006 [14] Winkle HN. Implementing Quality by Design. In the proceeding of PDA/FDA Joint Regulatory Conference: Evolution of the Global Regulatory Environment: A Practical Approach TO Change. Sep 24, 2007 [15] Weinberg s, Fugua R. A stochastic Model of “Quality by Design” For the Pharmaceutical industry.
V. S. Chopra et al Der Pharmacia Lettre, 2010, 2(2): 370-392
_____________________________________________________________________________
392
Scholar Research Library
[16] Feiler S, Solot Ph. Quality by Deign of Experiments: How Can design Of Experiments Be Used in Efficient Development, as specified In the ICH Q8 and PAT Guidelines. AICOS Technologies Ag.