bab v kesimpulan dan saran 5.1. kesimpulan · mustafa, edwin nasution. ... cv alfabeta. bandung....
TRANSCRIPT
56
BAB V
KESIMPULAN DAN SARAN
5.1. Kesimpulan
Berdasarkan analisis data penelitian yang sudah dilakukan, maka dapat
disimpulkan bahwa tidak semua variabel independent mempengaruhi variabel
dependent secara signifikan. Variabel Independensi, Integritas dan Kompetensi
berpengaruh positif terhadap Kualitas Hasil Pemeriksaan. Dengan demikian,
semakin tinggi independensi, integritas dan tinggi tingkat kompetensi yang
dimiliki auditor, maka semakin meningkat atau semakin baik kualitas hasil
pemeriksaan yang dilakukannya. Sedangkan untuk variabel pengalaman kerja dan
obyektivitas tidak berpengaruh signifikan terhadap kualitas hasil pemeriksaan.
Sedangkan secara simultan, kelima variabel tersebut berpengaruh terhadap
kualitas hasil pemeriksaan dengan kemampuan menjelaskan terhadap variabel
dependen sebesar 61,2%. sedangkan sisanya sebesar 38,8% dipengaruhi oleh
variabel lain yang tidak termasuk dalam model penelitian ini. Hal ini berarti masih
banyak variabel- variabel independen lainnya yang dapat menjelaskan variabel
kualitas hasil pemeriksaan.
57
5.2 Saran
1. Ruang lingkup penelitian ini hanya di lakukan pada Inspektorat Provinsi
Daerah Istimewa Yogyakarta sehingga untuk mendapatkan kesimpulan
yang bersifat umum perlu dilakukan penelitian yanglebih luas.
2. Masih terdapat variabel independen lain yang mempengaruhi variasi
dalam variabel kualitas hasil pemeriksaan yang belum tergali pada
penlitian ini. Penelitian selanjutnya dapat memasukkan variabel- variabel
lain.
64
DAFTAR PUSTAKA
Alim, M. Nizarul. Trisni Hapsari dan Lilik Purwanti. 2007. Jurnal. Pengaruh Kompetensi Dan Independensi Terhadap Kualitas Audit Dengan Etika Auditor Sebagai Variabel Moderasi. SNA X. Makassar.
Arens, Alvin A., Randal J.E dan Mark S.B. 2004. Auditing dan Pelayanan
Verifikasi, Pendekatan Terpadu. Jilid 1, Edisi Kesembilan. Penerbit PT Indeks. Jakarta.
Arikonto, Suharsimi. 2003. Manajemen Penelitian. Edisi Baru. Cetakan Keenam.
PT. Rineka Cipta. Jakarta. Asih, Dwi Ananing Tyas. 2006. Jurnal. Pengaruh Pengalaman Terhadap
Peningkatan Keahlian Auditor Dalam Bidang Auditing. Skripsi. Fakultas Ekonomi Universitas Islam Indonesia. Yogyakarta.
Budi, Sasongko. Basuki dan Hendaryatno. 2004. Jurnal. Internal Auditor dan
Dilema Etika. SNA VII. 22 Christiawan, Yulius Jogi. 2002. Jurnal. Kompetensi dan Independensi Akuntan
Publik: Refleksi Hasil Penelitian Empiris. Jurnal Akuntansi & Keuangan Vol.4, No. 2, November, 79 - 92.
Ghozali, Imam. 2006. Aplikasi Analisis Multivariate dengan program SPSS.
Cetakan IV. Badan Penerbit Universitas Diponegoro. Semarang. Herliansyah, Yudhi. Meifida Ilyas. 2006. Jurnal. Pengaruh Pengalaman Auditor
Terhadap Penggunaan Bukti Tidak Relevan Dalam Auditor Judgment. SNA IX. Padang.
Mardisar, Diani. Ria Nelly Sari. 2007. Jurnal. Pengaruh Akuntabilitas Dan
Pengetahuan Terhadap Kualitas Hasil Kerja Auditor. SNA X. Makassar. Mulyadi dan Kanaka Purwadireja. 1998. Auditing. Edisi Kelima. Penerbit
Salemba Empat. Jakarta. Mustafa, Edwin Nasution. Hardius Usman. 2007. Proses Penelitian Kuantitatif.
Lembaga Penerbit Fakultas Ekonomi Universitas Indonesia. Oktavia, Reni. 2006. Jurnal. Pengaruh Pengalaman Audit Dan Self-Efficacy
Terhadap Keputusan Auditor: Survey Pada Auditor Pemerintah. FakultasEkonomi. Universitas Lampung. Peraturan Pemerintah Nomor 60 tahun 2008 tentang Sistem Pengendalian InternPemerintah

65
Permenpan Nomor PER/04/M.PAN/03/2008 tentang Kode Etik Aparat Pengawasan Intern Pemerintah
Permenpan Nomor PER/05/M.PAN/03/2008 tentang Standar Audit Aparat
Pengawasan Intern Pemerintah Pusdiklatwas BPKP. 2005. Kode Etik dan Standar Audit. Edisi Keempat. Rai, Agung. 2008. Audit Kinerja Pada Sektor Publik. Penerbit Salemba Empat. Sugiyono. 2004. Metode Penelitian Bisnis. CV Alfabeta. Bandung. Sunarto. 2003. Auditing. Edisi Revisi Cetakan Pertama. Penerbit
Panduan.Yogyakarta. Suraida, Ida. 2005. Jurnal. Pengaruh Etika, Kompetensi, Pengalaman Audit Dan
Risiko Audit Terhadap Skeptisme Profesional Auditor Dan Ketepatan23 Pemberian Opini Akuntan Publik. Sosiohumaniora, Vol. 7, No. 3, November,186
- 202. Trisnaningsih, Sri. 2007. Jurnal. Independensi Auditor Dan Komitmen Organisasi
Sebagai Mediasi Pengaruh Pemahaman Good Governance, Gaya Kepemimpinan Dan Budaya Organisasi Terhadap Kinerja Auditor. SNA XMakassar.

66
LAMPIRAN I

67
LAMPIRAN II

68
Reliability Scale: ALL VARIABLES
Case Processing Summary
30 100.00 .0
30 100.0
ValidExcludeda
Total
CasesN %
Listwise deletion based on allvariables in the procedure.
a.
Reliability Statistics
.813 4
Cronbach'sAlpha N of Items
Item-Total Statistics
12.63 4.654 .533 .87312.43 5.013 .875 .64912.43 7.220 .512 .82312.60 5.559 .782 .703
X1-I-01X1-I-02X1-I-03X1-I-04
Scale Mean ifItem Deleted
ScaleVariance if
Item Deleted
CorrectedItem-TotalCorrelation
Cronbach'sAlpha if Item
Deleted

69
Reliability Scale: ALL VARIABLES
Case Processing Summary
30 100.00 .0
30 100.0
ValidExcludeda
Total
CasesN %
Listwise deletion based on allvariables in the procedure.
a.
Reliability Statistics
.634 4
Cronbach'sAlpha N of Items
Item-Total Statistics
12.43 2.806 .489 .54712.23 2.944 .397 .59212.50 1.914 .499 .50312.83 2.144 .382 .610
X1-II-01X1-II-02X1-II-03X1-II-04
Scale Mean ifItem Deleted
ScaleVariance if
Item Deleted
CorrectedItem-TotalCorrelation
Cronbach'sAlpha if Item
Deleted

70
Reliability Scale: ALL VARIABLES
Case Processing Summary
30 100.00 .0
30 100.0
ValidExcludeda
Total
CasesN %
Listwise deletion based on allvariables in the procedure.
a.
Reliability Statistics
.755 3
Cronbach'sAlpha N of Items
Item-Total Statistics
7.57 2.392 .618 .6347.50 2.190 .778 .4287.27 3.375 .395 .858
X2-I-01X2-I-02X2-I-03
Scale Mean ifItem Deleted
ScaleVariance if
Item Deleted
CorrectedItem-TotalCorrelation
Cronbach'sAlpha if Item
Deleted

71
Reliability Scale: ALL VARIABLES
Case Processing Summary
30 100.00 .0
30 100.0
ValidExcludeda
Total
CasesN %
Listwise deletion based on allvariables in the procedure.
a.
Reliability Statistics
.725 3
Cronbach'sAlpha N of Items
Item-Total Statistics
8.63 .861 .564 .8018.30 1.666 .614 .6078.27 1.720 .676 .586
X2-II-01X2-II-02X2-II-03
Scale Mean ifItem Deleted
ScaleVariance if
Item Deleted
CorrectedItem-TotalCorrelation
Cronbach'sAlpha if Item
Deleted

72
Reliability Scale: ALL VARIABLES
Case Processing Summary
30 100.00 .0
30 100.0
ValidExcludeda
Total
CasesN %
Listwise deletion based on allvariables in the procedure.
a.
Reliability Statistics
.812 3
Cronbach'sAlpha N of Items
Item-Total Statistics
8.50 1.638 .739 .6918.57 1.151 .602 .9118.47 1.706 .780 .679
X2-III-01X2-III-02X2-III-03
Scale Mean ifItem Deleted
ScaleVariance if
Item Deleted
CorrectedItem-TotalCorrelation
Cronbach'sAlpha if Item
Deleted

73
Reliability Scale: ALL VARIABLES
Case Processing Summary
30 100.00 .0
30 100.0
ValidExcludeda
Total
CasesN %
Listwise deletion based on allvariables in the procedure.
a.
Reliability Statistics
.757 4
Cronbach'sAlpha N of Items
Item-Total Statistics
12.93 1.582 .569 .69312.97 1.413 .532 .72312.83 1.454 .755 .59812.77 1.771 .406 .775
X3-I-01X3-I-02X3-I-03X3-I-04
Scale Mean ifItem Deleted
ScaleVariance if
Item Deleted
CorrectedItem-TotalCorrelation
Cronbach'sAlpha if Item
Deleted

74
Reliability Scale: ALL VARIABLES
Case Processing Summary
30 100.00 .0
30 100.0
ValidExcludeda
Total
CasesN %
Listwise deletion based on allvariables in the procedure.
a.
Reliability Statistics
.943 4
Cronbach'sAlpha N of Items
Item-Total Statistics
13.27 2.133 .882 .92013.33 2.023 .839 .93613.37 2.171 .874 .92313.33 2.161 .869 .924
X3-II-01X3-II-02X3-II-03X3-II-04
Scale Mean ifItem Deleted
ScaleVariance if
Item Deleted
CorrectedItem-TotalCorrelation
Cronbach'sAlpha if Item
Deleted

75
Reliability Scale: ALL VARIABLES
Case Processing Summary
30 100.00 .0
30 100.0
ValidExcludeda
Total
CasesN %
Listwise deletion based on allvariables in the procedure.
a.
Reliability Statistics
.773 3
Cronbach'sAlpha N of Items
Item-Total Statistics
9.20 .855 .467 .8398.93 .616 .811 .4488.93 .754 .574 .732
X4-I-01X4-I-02X4-I-03
Scale Mean ifItem Deleted
ScaleVariance if
Item Deleted
CorrectedItem-TotalCorrelation
Cronbach'sAlpha if Item
Deleted

76
Reliability Scale: ALL VARIABLES
Case Processing Summary
30 100.00 .0
30 100.0
ValidExcludeda
Total
CasesN %
Listwise deletion based on allvariables in the procedure.
a.
Reliability Statistics
.839 3
Cronbach'sAlpha N of Items
Item-Total Statistics
9.23 .737 .790 .6869.17 .764 .795 .6869.27 .892 .541 .928
X4-II-01X4-II-02X4-II-03
Scale Mean ifItem Deleted
ScaleVariance if
Item Deleted
CorrectedItem-TotalCorrelation
Cronbach'sAlpha if Item
Deleted

77
Reliability Scale: ALL VARIABLES
Case Processing Summary
30 100.00 .0
30 100.0
ValidExcludeda
Total
CasesN %
Listwise deletion based on allvariables in the procedure.
a.
Reliability Statistics
.716 3
Cronbach'sAlpha N of Items
Item-Total Statistics
8.73 1.444 .734 .4788.83 .971 .602 .5688.90 1.541 .378 .805
X4-III-01X4-III-02X4-III-03
Scale Mean ifItem Deleted
ScaleVariance if
Item Deleted
CorrectedItem-TotalCorrelation
Cronbach'sAlpha if Item
Deleted

78
Reliability Scale: ALL VARIABLES
Case Processing Summary
30 100.00 .0
30 100.0
ValidExcludeda
Total
CasesN %
Listwise deletion based on allvariables in the procedure.
a.
Reliability Statistics
.772 5
Cronbach'sAlpha N of Items
Item-Total Statistics
17.57 3.357 .630 .70417.50 3.293 .622 .70517.60 2.938 .461 .79317.30 3.734 .509 .74417.23 3.564 .617 .715
X4-IV-01X4-IV-02X4-IV-03X4-IV-04X4-IV-05
Scale Mean ifItem Deleted
ScaleVariance if
Item Deleted
CorrectedItem-TotalCorrelation
Cronbach'sAlpha if Item
Deleted

79
Reliability Scale: ALL VARIABLES
Case Processing Summary
30 100.00 .0
30 100.0
ValidExcludeda
Total
CasesN %
Listwise deletion based on allvariables in the procedure.
a.
Reliability Statistics
.720 3
Cronbach'sAlpha N of Items
Item-Total Statistics
8.90 .783 .579 .5879.00 1.034 .434 .7518.77 .944 .632 .536
X5-I-01X5-I-02X5-I-03
Scale Mean ifItem Deleted
ScaleVariance if
Item Deleted
CorrectedItem-TotalCorrelation
Cronbach'sAlpha if Item
Deleted

80
Reliability Scale: ALL VARIABLES
Case Processing Summary
30 100.00 .0
30 100.0
ValidExcludeda
Total
CasesN %
Listwise deletion based on allvariables in the procedure.
a.
Reliability Statistics
.918 4
Cronbach'sAlpha N of Items
Item-Total Statistics
13.90 1.679 .897 .86213.93 1.857 .709 .92813.83 1.730 .893 .86513.83 1.868 .754 .912
X5-II-01X5-II-02X5-II-03X5-II-04
Scale Mean ifItem Deleted
ScaleVariance if
Item Deleted
CorrectedItem-TotalCorrelation
Cronbach'sAlpha if Item
Deleted

81
Reliability Scale: ALL VARIABLES
Case Processing Summary
30 100.00 .0
30 100.0
ValidExcludeda
Total
CasesN %
Listwise deletion based on allvariables in the procedure.
a.
Reliability Statistics
.920 3
Cronbach'sAlpha N of Items
Item-Total Statistics
9.00 1.172 .845 .8869.17 1.040 .809 .9109.10 .990 .874 .855
X5-III-01X5-III-02X5-III-03
Scale Mean ifItem Deleted
ScaleVariance if
Item Deleted
CorrectedItem-TotalCorrelation
Cronbach'sAlpha if Item
Deleted

82
Reliability Scale: ALL VARIABLES
Case Processing Summary
30 100.00 .0
30 100.0
ValidExcludeda
Total
CasesN %
Listwise deletion based on allvariables in the procedure.
a.
Reliability Statistics
.947 5
Cronbach'sAlpha N of Items
Item-Total Statistics
18.10 3.610 .737 .95418.10 3.472 .824 .93918.03 3.413 .863 .93218.03 3.344 .909 .92418.00 3.310 .940 .919
Y1-I-01Y1-I-02Y1-I-03Y1-I-04Y1-I-05
Scale Mean ifItem Deleted
ScaleVariance if
Item Deleted
CorrectedItem-TotalCorrelation
Cronbach'sAlpha if Item
Deleted

83
Reliability Scale: ALL VARIABLES
Case Processing Summary
30 100.00 .0
30 100.0
ValidExcludeda
Total
CasesN %
Listwise deletion based on allvariables in the procedure.
a.
Reliability Statistics
.878 5
Cronbach'sAlpha N of Items
Item-Total Statistics
17.73 3.582 .778 .83817.80 3.545 .792 .83417.97 2.930 .700 .87417.93 3.582 .808 .83317.77 3.909 .575 .881
Y1-II-01Y1-II-02Y1-II-03Y1-II-04Y1-II-05
Scale Mean ifItem Deleted
ScaleVariance if
Item Deleted
CorrectedItem-TotalCorrelation
Cronbach'sAlpha if Item
Deleted

84
LAMPIRAN III

85
Frequencies
Statistics
Jenis Kelamin45
0ValidMissing
N
Jenis Kelamin
29 64.4 64.4 64.416 35.6 35.6 100.045 100.0 100.0
laki-lakiperempuanTotal
ValidFrequency Percent Valid Percent
CumulativePercent

86
LAMPIRAN IV
87
Frequency Table
Statistics
45 0 4.22 1.12645 0 4.40 .80945 0 4.38 .61445 0 4.22 .76545 0 4.33 .52245 0 4.42 .49945 0 4.18 .80645 0 3.96 .92845 0 3.73 .96345 0 3.89 .91045 0 4.04 .85245 0 4.07 .93945 0 4.24 .60945 0 4.42 .49945 0 4.36 .57045 0 4.27 .80945 0 4.40 .53945 0 4.31 .51445 0 4.18 .77745 0 4.36 .48445 0 4.42 .49945 0 4.47 .50545 0 4.40 .58045 0 4.44 .50345 0 4.44 .50345 0 4.38 .49045 0 4.62 .49045 0 4.58 .49945 0 4.58 .49945 0 4.60 .49545 0 4.53 .50545 0 4.49 .50645 0 4.38 .71645 0 4.36 .64545 0 4.29 .54945 0 4.33 .56445 0 4.29 .75745 0 4.47 .50545 0 4.51 .50645 0 4.24 .64545 0 4.16 .56245 0 4.29 .62645 0 4.36 .57045 0 4.27 .68845 0 4.36 .60945 0 4.33 .70745 0 4.27 .68845 0 4.20 .58845 0 4.27 .61845 0 4.40 .49545 0 4.44 .54645 0 4.49 .50645 0 4.42 .54345 0 4.51 .50645 0 4.53 .50545 0 4.47 .50545 0 4.33 .67445 0 4.36 .48445 0 4.51 .506
X1-I-01X1-I-02X1-I-03X1-I-04X1-II-01X1-II-02X1-II-03X1-II-04X2-I-01X2-I-02X2-I-03X2-II-01X2-II-02X2-II-03X2-III-01X2-III-02X2-III-03X3-I-01X3-I-02X3-I-03X3-I-04X3-II-01X3-II-02X3-II-03X3-II-04X4-I-01X4-I-02X4-I-03X4-II-01X4-II-02X4-II-03X4-III-01X4-III-02X4-III-03X4-IV-01X4-IV-02X4-IV-03X4-IV-04X4-IV-05X5-I-01X5-I-02X5-I-03X5-II-01X5-II-02X5-II-03X5-II-04X5-III-01X5-III-02X5-III-03Y1-I-01Y1-I-02Y1-I-03Y1-I-04Y1-I-05Y1-II-01Y1-II-02Y1-II-03Y1-II-04Y1-II-05
Valid MissingN
Mean Std. Deviation

88
X1-I-01
4 8.9 8.9 8.919 42.2 42.2 51.122 48.9 48.9 100.045 100.0 100.0
STSSSSTotal
ValidFrequency Percent Valid Percent
CumulativePercent
X1-I-02
1 2.2 2.2 2.21 2.2 2.2 4.4
20 44.4 44.4 48.923 51.1 51.1 100.045 100.0 100.0
STSTSSSSTotal
ValidFrequency Percent Valid Percent
CumulativePercent
X1-I-03
1 2.2 2.2 2.225 55.6 55.6 57.819 42.2 42.2 100.045 100.0 100.0
TSSSSTotal
ValidFrequency Percent Valid Percent
CumulativePercent
X1-I-04
1 2.2 2.2 2.23 6.7 6.7 8.9
25 55.6 55.6 64.416 35.6 35.6 100.045 100.0 100.0
STSNSSSTotal
ValidFrequency Percent Valid Percent
CumulativePercent
X1-II-01
1 2.2 2.2 2.228 62.2 62.2 64.416 35.6 35.6 100.045 100.0 100.0
NSSSTotal
ValidFrequency Percent Valid Percent
CumulativePercent
89
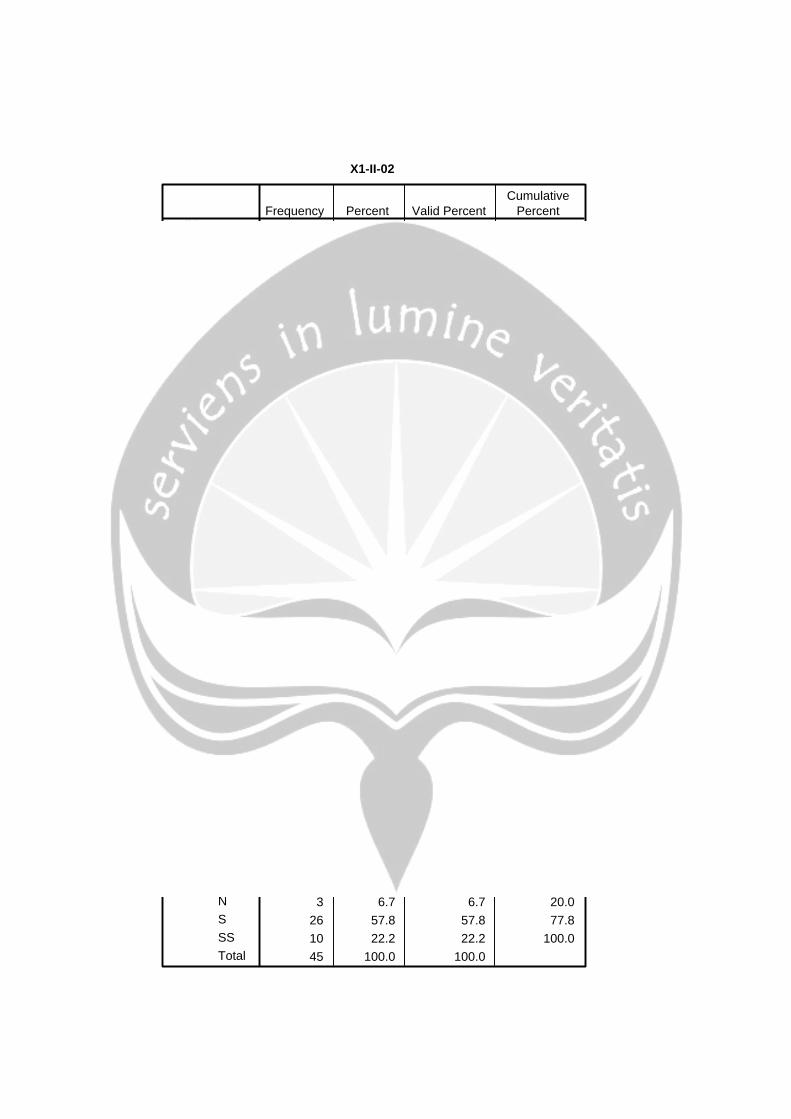
X1-II-02
26 57.8 57.8 57.819 42.2 42.2 100.045 100.0 100.0
SSSTotal
ValidFrequency Percent Valid Percent
CumulativePercent
X1-II-03
3 6.7 6.7 6.72 4.4 4.4 11.1
24 53.3 53.3 64.416 35.6 35.6 100.045 100.0 100.0
TSNSSSTotal
ValidFrequency Percent Valid Percent
CumulativePercent
X1-II-04
1 2.2 2.2 2.23 6.7 6.7 8.95 11.1 11.1 20.0
24 53.3 53.3 73.312 26.7 26.7 100.045 100.0 100.0
STSTSNSSSTotal
ValidFrequency Percent Valid Percent
CumulativePercent
X2-I-01
7 15.6 15.6 15.67 15.6 15.6 31.1
22 48.9 48.9 80.09 20.0 20.0 100.0
45 100.0 100.0
TSNSSSTotal
ValidFrequency Percent Valid Percent
CumulativePercent
X2-I-02
6 13.3 13.3 13.33 6.7 6.7 20.0
26 57.8 57.8 77.810 22.2 22.2 100.045 100.0 100.0
TSNSSSTotal
ValidFrequency Percent Valid Percent
CumulativePercent

90
X2-I-03
1 2.2 2.2 2.23 6.7 6.7 8.9
30 66.7 66.7 75.611 24.4 24.4 100.045 100.0 100.0
STSTSSSSTotal
ValidFrequency Percent Valid Percent
CumulativePercent
X2-II-01
1 2.2 2.2 2.23 6.7 6.7 8.93 6.7 6.7 15.6
23 51.1 51.1 66.715 33.3 33.3 100.045 100.0 100.0
STSTSNSSSTotal
ValidFrequency Percent Valid Percent
CumulativePercent
X2-II-02
4 8.9 8.9 8.926 57.8 57.8 66.715 33.3 33.3 100.045 100.0 100.0
NSSSTotal
ValidFrequency Percent Valid Percent
CumulativePercent
X2-II-03
26 57.8 57.8 57.819 42.2 42.2 100.045 100.0 100.0
SSSTotal
ValidFrequency Percent Valid Percent
CumulativePercent
X2-III-01
2 4.4 4.4 4.425 55.6 55.6 60.018 40.0 40.0 100.045 100.0 100.0
NSSSTotal
ValidFrequency Percent Valid Percent
CumulativePercent
91
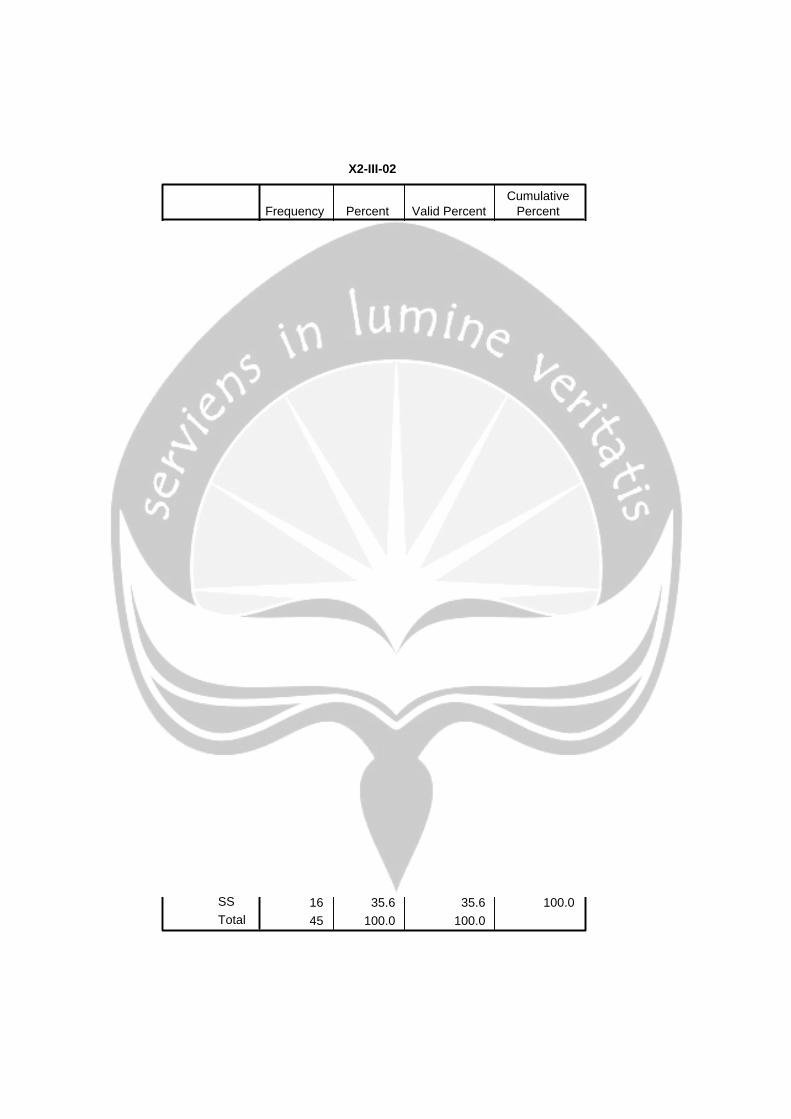
X2-III-02
3 6.7 6.7 6.71 2.2 2.2 8.9
22 48.9 48.9 57.819 42.2 42.2 100.045 100.0 100.0
TSNSSSTotal
ValidFrequency Percent Valid Percent
CumulativePercent
X2-III-03
1 2.2 2.2 2.225 55.6 55.6 57.819 42.2 42.2 100.045 100.0 100.0
NSSSTotal
ValidFrequency Percent Valid Percent
CumulativePercent
X3-I-01
1 2.2 2.2 2.229 64.4 64.4 66.715 33.3 33.3 100.045 100.0 100.0
NSSSTotal
ValidFrequency Percent Valid Percent
CumulativePercent
X3-I-02
1 2.2 2.2 2.21 2.2 2.2 4.41 2.2 2.2 6.7
28 62.2 62.2 68.914 31.1 31.1 100.045 100.0 100.0
STSTSNSSSTotal
ValidFrequency Percent Valid Percent
CumulativePercent
X3-I-03
29 64.4 64.4 64.416 35.6 35.6 100.045 100.0 100.0
SSSTotal
ValidFrequency Percent Valid Percent
CumulativePercent
92
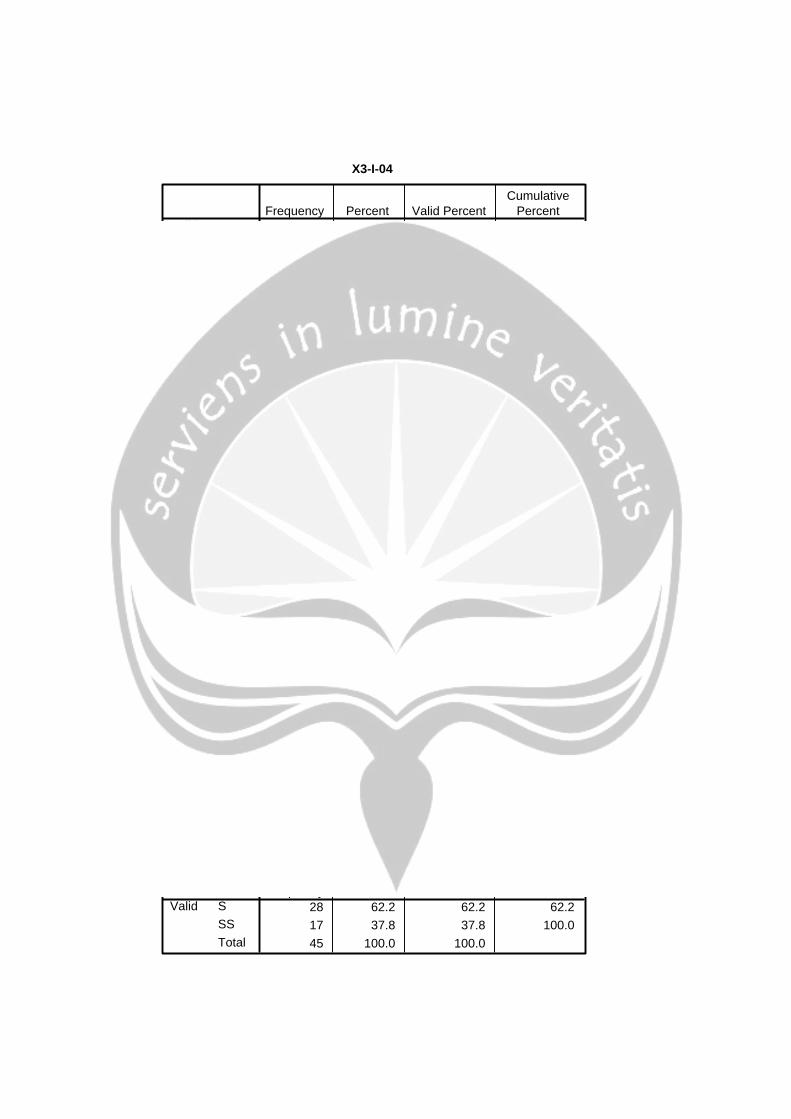
X3-I-04
26 57.8 57.8 57.819 42.2 42.2 100.045 100.0 100.0
SSSTotal
ValidFrequency Percent Valid Percent
CumulativePercent
X3-II-01
24 53.3 53.3 53.321 46.7 46.7 100.045 100.0 100.0
SSSTotal
ValidFrequency Percent Valid Percent
CumulativePercent
X3-II-02
2 4.4 4.4 4.423 51.1 51.1 55.620 44.4 44.4 100.045 100.0 100.0
NSSSTotal
ValidFrequency Percent Valid Percent
CumulativePercent
X3-II-03
25 55.6 55.6 55.620 44.4 44.4 100.045 100.0 100.0
SSSTotal
ValidFrequency Percent Valid Percent
CumulativePercent
X3-II-04
25 55.6 55.6 55.620 44.4 44.4 100.045 100.0 100.0
SSSTotal
ValidFrequency Percent Valid Percent
CumulativePercent
X4-I-01
28 62.2 62.2 62.217 37.8 37.8 100.045 100.0 100.0
SSSTotal
ValidFrequency Percent Valid Percent
CumulativePercent

93
X4-I-02
17 37.8 37.8 37.828 62.2 62.2 100.045 100.0 100.0
SSSTotal
ValidFrequency Percent Valid Percent
CumulativePercent
X4-I-03
19 42.2 42.2 42.226 57.8 57.8 100.045 100.0 100.0
SSSTotal
ValidFrequency Percent Valid Percent
CumulativePercent
X4-II-01
19 42.2 42.2 42.226 57.8 57.8 100.045 100.0 100.0
SSSTotal
ValidFrequency Percent Valid Percent
CumulativePercent
X4-II-02
18 40.0 40.0 40.027 60.0 60.0 100.045 100.0 100.0
SSSTotal
ValidFrequency Percent Valid Percent
CumulativePercent
X4-II-03
21 46.7 46.7 46.724 53.3 53.3 100.045 100.0 100.0
SSSTotal
ValidFrequency Percent Valid Percent
CumulativePercent
X4-III-01
23 51.1 51.1 51.122 48.9 48.9 100.045 100.0 100.0
SSSTotal
ValidFrequency Percent Valid Percent
CumulativePercent
94
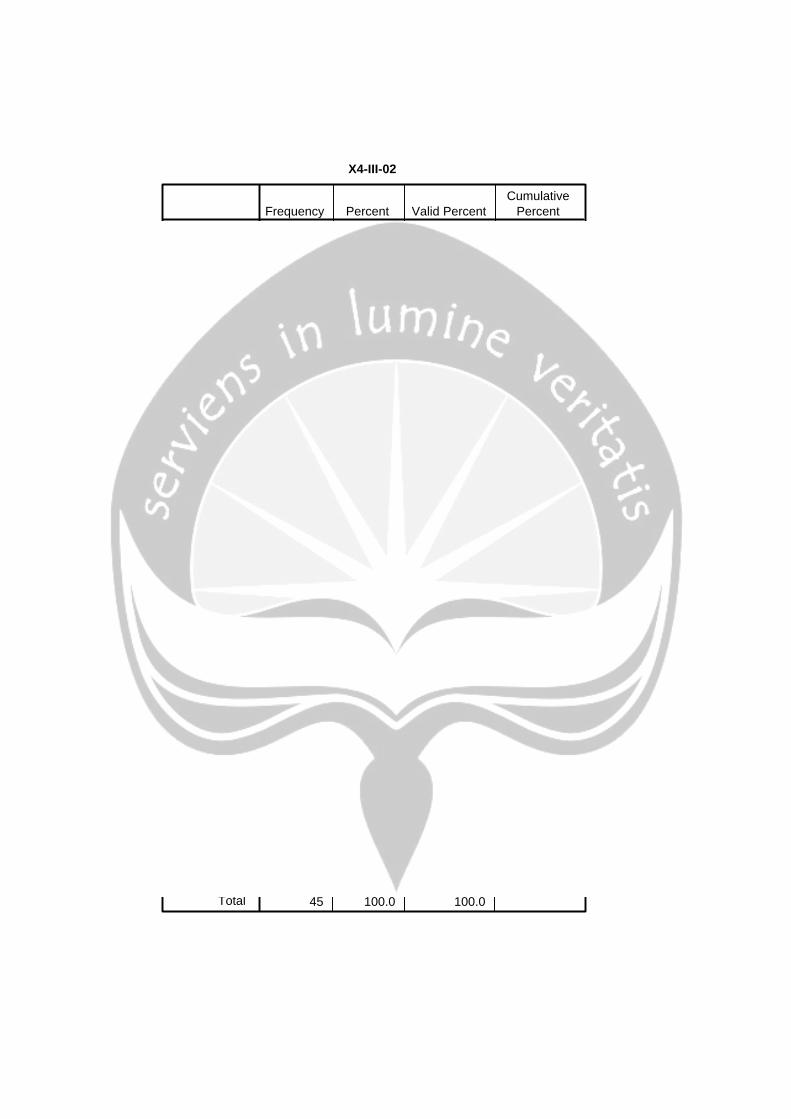
X4-III-02
1 2.2 2.2 2.224 53.3 53.3 55.620 44.4 44.4 100.045 100.0 100.0
STSSSSTotal
ValidFrequency Percent Valid Percent
CumulativePercent
X4-III-03
4 8.9 8.9 8.921 46.7 46.7 55.620 44.4 44.4 100.045 100.0 100.0
NSSSTotal
ValidFrequency Percent Valid Percent
CumulativePercent
X4-IV-01
2 4.4 4.4 4.428 62.2 62.2 66.715 33.3 33.3 100.045 100.0 100.0
NSSSTotal
ValidFrequency Percent Valid Percent
CumulativePercent
X4-IV-02
2 4.4 4.4 4.426 57.8 57.8 62.217 37.8 37.8 100.045 100.0 100.0
NSSSTotal
ValidFrequency Percent Valid Percent
CumulativePercent
X4-IV-03
1 2.2 2.2 2.22 4.4 4.4 6.7
24 53.3 53.3 60.018 40.0 40.0 100.045 100.0 100.0
STSNSSSTotal
ValidFrequency Percent Valid Percent
CumulativePercent

95
X4-IV-04
24 53.3 53.3 53.321 46.7 46.7 100.045 100.0 100.0
SSSTotal
ValidFrequency Percent Valid Percent
CumulativePercent
X4-IV-05
22 48.9 48.9 48.923 51.1 51.1 100.045 100.0 100.0
SSSTotal
ValidFrequency Percent Valid Percent
CumulativePercent
X5-I-01
5 11.1 11.1 11.124 53.3 53.3 64.416 35.6 35.6 100.045 100.0 100.0
NSSSTotal
ValidFrequency Percent Valid Percent
CumulativePercent
X5-I-02
4 8.9 8.9 8.930 66.7 66.7 75.611 24.4 24.4 100.045 100.0 100.0
NSSSTotal
ValidFrequency Percent Valid Percent
CumulativePercent
X5-I-03
4 8.9 8.9 8.924 53.3 53.3 62.217 37.8 37.8 100.045 100.0 100.0
NSSSTotal
ValidFrequency Percent Valid Percent
CumulativePercent

96
X5-II-01
2 4.4 4.4 4.425 55.6 55.6 60.018 40.0 40.0 100.045 100.0 100.0
NSSSTotal
ValidFrequency Percent Valid Percent
CumulativePercent
X5-II-02
6 13.3 13.3 13.321 46.7 46.7 60.018 40.0 40.0 100.045 100.0 100.0
NSSSTotal
ValidFrequency Percent Valid Percent
CumulativePercent
X5-II-03
3 6.7 6.7 6.723 51.1 51.1 57.819 42.2 42.2 100.045 100.0 100.0
NSSSTotal
ValidFrequency Percent Valid Percent
CumulativePercent
X5-II-04
6 13.3 13.3 13.318 40.0 40.0 53.321 46.7 46.7 100.045 100.0 100.0
NSSSTotal
ValidFrequency Percent Valid Percent
CumulativePercent
X5-III-01
6 13.3 13.3 13.321 46.7 46.7 60.018 40.0 40.0 100.045 100.0 100.0
NSSSTotal
ValidFrequency Percent Valid Percent
CumulativePercent
97
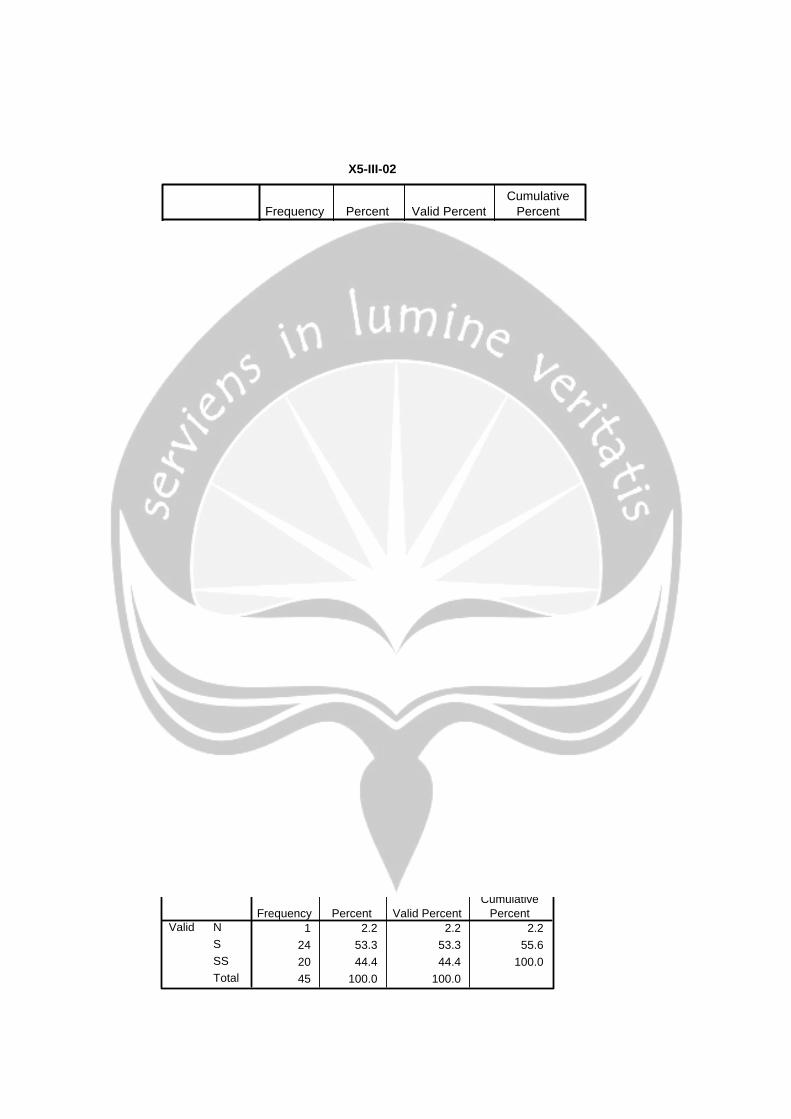
X5-III-02
4 8.9 8.9 8.928 62.2 62.2 71.113 28.9 28.9 100.045 100.0 100.0
NSSSTotal
ValidFrequency Percent Valid Percent
CumulativePercent
X5-III-03
4 8.9 8.9 8.925 55.6 55.6 64.416 35.6 35.6 100.045 100.0 100.0
NSSSTotal
ValidFrequency Percent Valid Percent
CumulativePercent
Y1-I-01
27 60.0 60.0 60.018 40.0 40.0 100.045 100.0 100.0
SSSTotal
ValidFrequency Percent Valid Percent
CumulativePercent
Y1-I-02
1 2.2 2.2 2.223 51.1 51.1 53.321 46.7 46.7 100.045 100.0 100.0
NSSSTotal
ValidFrequency Percent Valid Percent
CumulativePercent
Y1-I-03
23 51.1 51.1 51.122 48.9 48.9 100.045 100.0 100.0
SSSTotal
ValidFrequency Percent Valid Percent
CumulativePercent
Y1-I-04
1 2.2 2.2 2.224 53.3 53.3 55.620 44.4 44.4 100.045 100.0 100.0
NSSSTotal
ValidFrequency Percent Valid Percent
CumulativePercent
98
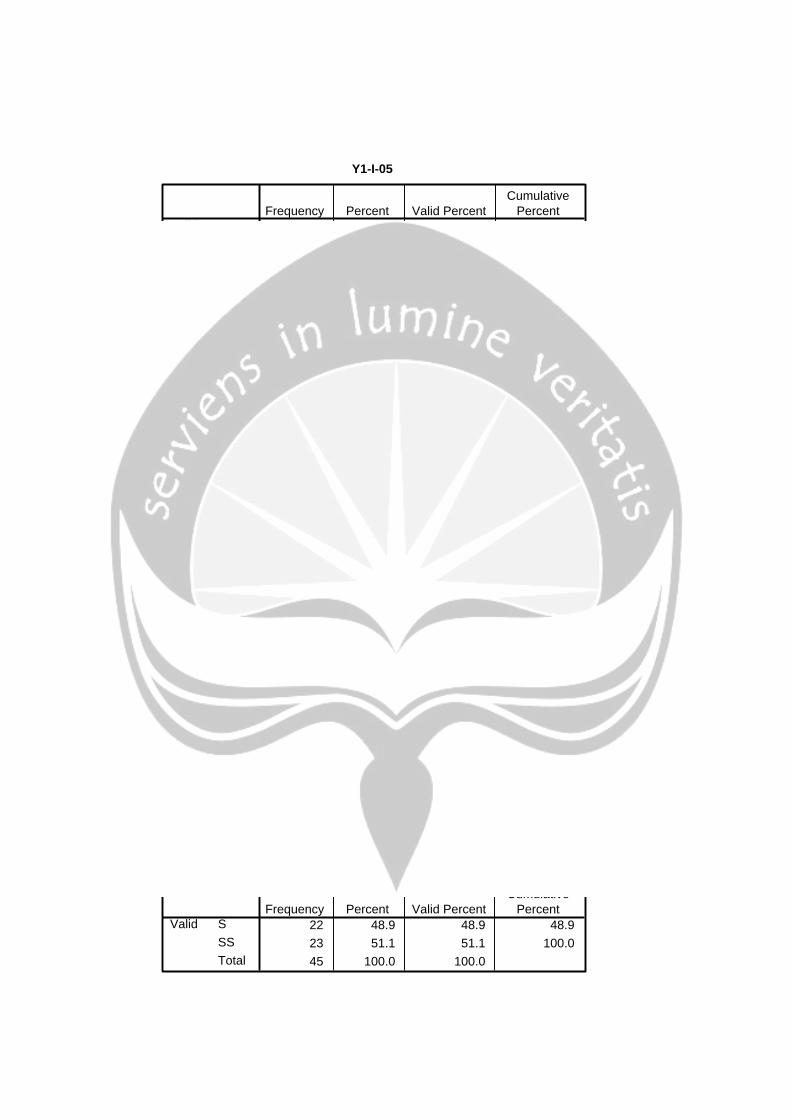
Y1-I-05
22 48.9 48.9 48.923 51.1 51.1 100.045 100.0 100.0
SSSTotal
ValidFrequency Percent Valid Percent
CumulativePercent
Y1-II-01
21 46.7 46.7 46.724 53.3 53.3 100.045 100.0 100.0
SSSTotal
ValidFrequency Percent Valid Percent
CumulativePercent
Y1-II-02
24 53.3 53.3 53.321 46.7 46.7 100.045 100.0 100.0
SSSTotal
ValidFrequency Percent Valid Percent
CumulativePercent
Y1-II-03
1 2.2 2.2 2.22 4.4 4.4 6.7
23 51.1 51.1 57.819 42.2 42.2 100.045 100.0 100.0
TSNSSSTotal
ValidFrequency Percent Valid Percent
CumulativePercent
Y1-II-04
29 64.4 64.4 64.416 35.6 35.6 100.045 100.0 100.0
SSSTotal
ValidFrequency Percent Valid Percent
CumulativePercent
Y1-II-05
22 48.9 48.9 48.923 51.1 51.1 100.045 100.0 100.0
SSSTotal
ValidFrequency Percent Valid Percent
CumulativePercent

99
X1-I
1 2.2 2.2 2.24 8.9 8.9 11.1
40 88.9 88.9 100.045 100.0 100.0
RendahSedangTinggiTotal
ValidFrequency Percent Valid Percent
CumulativePercent
X1-II
4 8.9 8.9 8.941 91.1 91.1 100.045 100.0 100.0
SedangTinggiTotal
ValidFrequency Percent Valid Percent
CumulativePercent
X2-I
2 4.4 4.4 4.414 31.1 31.1 35.629 64.4 64.4 100.045 100.0 100.0
RendahSedangTinggiTotal
ValidFrequency Percent Valid Percent
CumulativePercent
X2-II
8 17.8 17.8 17.837 82.2 82.2 100.045 100.0 100.0
SedangTinggiTotal
ValidFrequency Percent Valid Percent
CumulativePercent
X2-III
5 11.1 11.1 11.140 88.9 88.9 100.045 100.0 100.0
SedangTinggiTotal
ValidFrequency Percent Valid Percent
CumulativePercent
X3-I
1 2.2 2.2 2.244 97.8 97.8 100.045 100.0 100.0
SedangTinggiTotal
ValidFrequency Percent Valid Percent
CumulativePercent
100
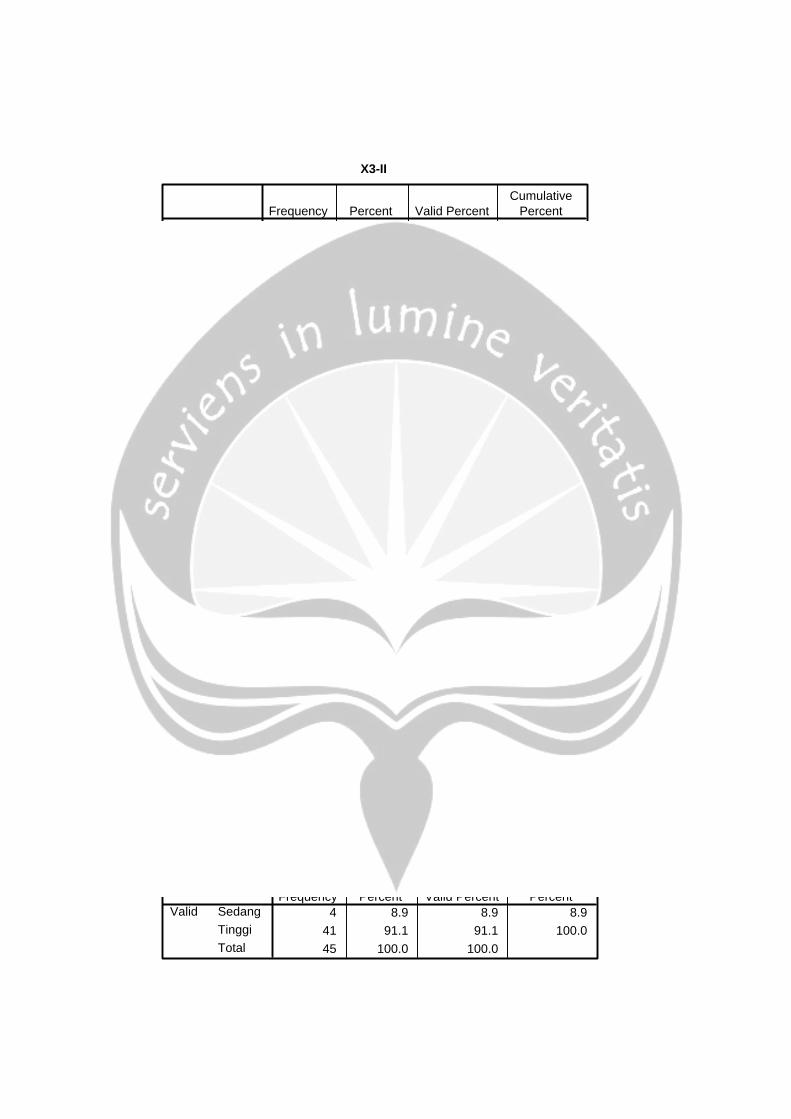
X3-II
45 100.0 100.0 100.0TinggiValidFrequency Percent Valid Percent
CumulativePercent
X4-I
45 100.0 100.0 100.0TinggiValidFrequency Percent Valid Percent
CumulativePercent
X4-II
45 100.0 100.0 100.0TinggiValidFrequency Percent Valid Percent
CumulativePercent
X4-III
3 6.7 6.7 6.742 93.3 93.3 100.045 100.0 100.0
SedangTinggiTotal
ValidFrequency Percent Valid Percent
CumulativePercent
X4-IV
1 2.2 2.2 2.244 97.8 97.8 100.045 100.0 100.0
SedangTinggiTotal
ValidFrequency Percent Valid Percent
CumulativePercent
X5-I
7 15.6 15.6 15.638 84.4 84.4 100.045 100.0 100.0
SedangTinggiTotal
ValidFrequency Percent Valid Percent
CumulativePercent
X5-II
4 8.9 8.9 8.941 91.1 91.1 100.045 100.0 100.0
SedangTinggiTotal
ValidFrequency Percent Valid Percent
CumulativePercent

101
X5-III
10 22.2 22.2 22.235 77.8 77.8 100.045 100.0 100.0
SedangTinggiTotal
ValidFrequency Percent Valid Percent
CumulativePercent
Y1-I
45 100.0 100.0 100.0TinggiValidFrequency Percent Valid Percent
CumulativePercent
Y1-II
45 100.0 100.0 100.0TinggiValidFrequency Percent Valid Percent
CumulativePercent

102
LAMPIRAN V
103
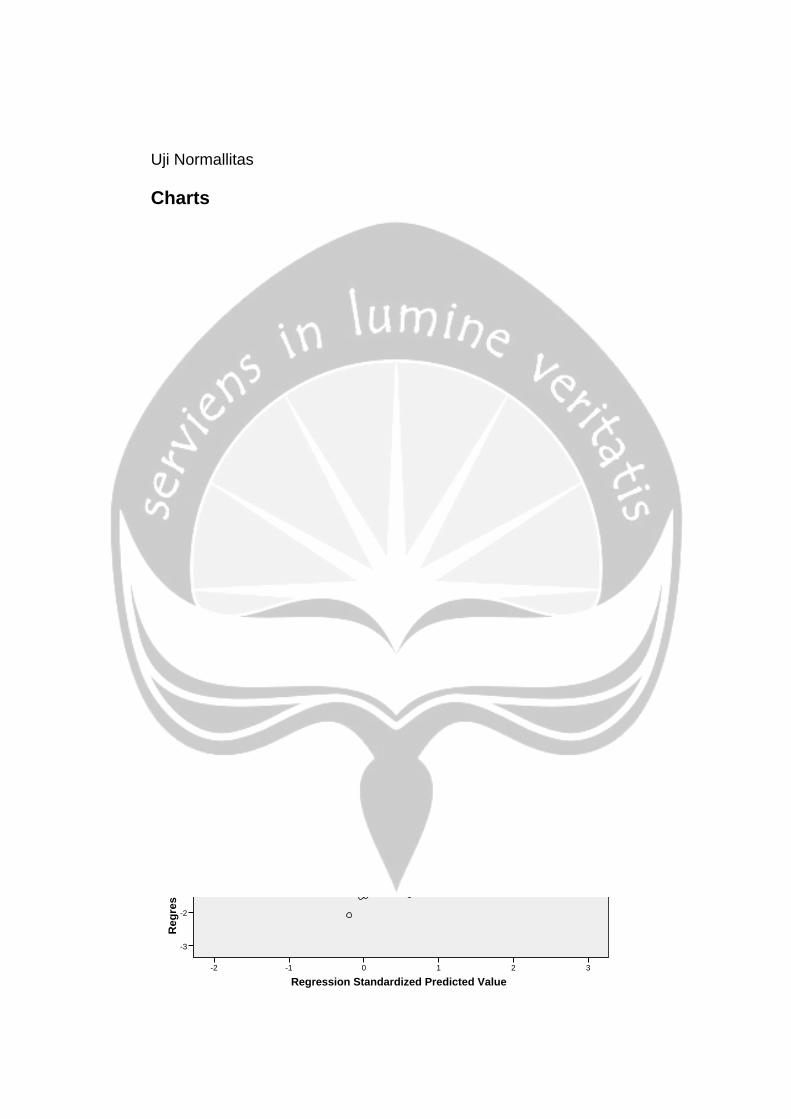
Uji Normallitas Charts
Uji Heterokesdastisitas
Observed Cum Prob1.00.80.60.40.20.0
Expe
cted
Cum
Pro
b
1.0
0.8
0.6
0.4
0.2
0.0
Normal P-P Plot of Regression Standardized Residual
Dependent Variable: Kualitas Hasil Pemeriksaan (Y)
Regression Standardized Predicted Value3210-1-2
Reg
ress
ion
Stud
entiz
ed R
esid
ual
3
2
1
0
-1
-2
-3
Scatterplot
Dependent Variable: Kualitas Hasil Pemeriksaan (Y)

104
LAMPIRAN VI

105
Uji Autokorelasi
Uji Multikolinieritas
Model Summary b
.810a .656 .612 .24831 1.861Model1
R R SquareAdjustedR Square
Std. Error ofthe Estimate
Durbin-Watson
Predictors: (Constant), Kompetensi Auditor (X5), Independensi (X2),Obyektifitas (X3), Pengalaman Kerja (X1), Integritas (X4)
a.
Dependent Variable: Kualitas Hasil Pemeriksaan (Y)b.
Coefficientsa
-.159 .580 -.274 .785.074 .094 .093 .790 .434 .454 .126 .074 .641 1.559.259 .095 .314 2.733 .009 .522 .401 .257 .667 1.499.023 .116 .022 .197 .845 .370 .032 .019 .712 1.404.393 .150 .351 2.612 .013 .683 .386 .245 .488 2.050.319 .083 .392 3.835 .000 .516 .523 .360 .846 1.182
(Constant)Pengalaman Kerja (X1)Independensi (X2)Obyektifitas (X3)Integritas (X4)Kompetensi Auditor (X5)
Model1
B Std. Error
UnstandardizedCoefficients
Beta
StandardizedCoefficients
t Sig. Zero-order Partial PartCorrelations
Tolerance VIFCollinearity Statistics
Dependent Variable: Kualitas Hasil Pemeriksaan (Y)a.
Coefficient Correlationsa
1.000 .135 .062 .091 -.374.135 1.000 -.222 -.319 -.184.062 -.222 1.000 .133 -.398.091 -.319 .133 1.000 -.407
-.374 -.184 -.398 -.407 1.000.007 .001 .001 .001 -.005.001 .009 -.002 -.003 -.003.001 -.002 .013 .001 -.007.001 -.003 .001 .009 -.006
-.005 -.003 -.007 -.006 .023
Kompetensi Auditor (X5)Independensi (X2)Obyektifitas (X3)Pengalaman Kerja (X1)Integritas (X4)Kompetensi Auditor (X5)Independensi (X2)Obyektifitas (X3)Pengalaman Kerja (X1)Integritas (X4)
Correlations
Covariances
Model1
KompetensiAuditor (X5)
Independensi(X2)
Obyektifitas(X3)
PengalamanKerja (X1) Integritas (X4)
Dependent Variable: Kualitas Hasil Pemeriksaan (Y)a.

106
LAMPIRAN VII
107
Regression
Variables Entered/Removedb
Kompetensi Auditor (X5), Independensi(X2), Obyektifitas (X3), PengalamanKerja (X1), Integritas (X4)
a . Enter
Model1
Variables EnteredVariablesRemoved Method
All requested variables entered.a.
Dependent Variable: Kualitas Hasil Pemeriksaan (Y)b.
Model Summaryb
.810a .656 .612 .24831 1.861Model1
R R SquareAdjustedR Square
Std. Error ofthe Estimate
Durbin-Watson
Predictors: (Constant), Kompetensi Auditor (X5), Independensi (X2),Obyektifitas (X3), Pengalaman Kerja (X1), Integritas (X4)
a.
Dependent Variable: Kualitas Hasil Pemeriksaan (Y)b.
ANOVAb
4.587 5 .917 14.879 .000a
2.405 39 .0626.992 44
RegressionResidualTotal
Model1
Sum ofSquares df Mean Square F Sig.
Predictors: (Constant), Kompetensi Auditor (X5), Independensi (X2), Obyektifitas(X3), Pengalaman Kerja (X1), Integritas (X4)
a.
Dependent Variable: Kualitas Hasil Pemeriksaan (Y)b.
Coefficientsa
-.159 .580 -.274 .785.074 .094 .093 .790 .434 .454 .126 .074 .641 1.559.259 .095 .314 2.733 .009 .522 .401 .257 .667 1.499.023 .116 .022 .197 .845 .370 .032 .019 .712 1.404.393 .150 .351 2.612 .013 .683 .386 .245 .488 2.050.319 .083 .392 3.835 .000 .516 .523 .360 .846 1.182
(Constant)Pengalaman Kerja (X1)Independensi (X2)Obyektifitas (X3)Integritas (X4)Kompetensi Auditor (X5)
Model1
B Std. Error
UnstandardizedCoefficients
Beta
StandardizedCoefficients
t Sig. Zero-order Partial PartCorrelations
Tolerance VIFCollinearity Statistics
Dependent Variable: Kualitas Hasil Pemeriksaan (Y)a.