bab 5 simpulan dan saran 5.1 simpulanrepository.wima.ac.id/894/6/bab 5.pdfteo, h., 2002, attitudes...
TRANSCRIPT
68
BAB 5
SIMPULAN DAN SARAN
5.1 Simpulan
Dari hasil pengujian hipotesis dan pembahasan, maka simpulan
yang dapat diuraikan dalam penelitian ini adalah sebagai berikut:
1. Trust In Online Store berpengaruh negatif terhadap Perceived Risk
pada Produk Fashion Online di Surabaya. Dengan demikian,
hipotesis pertama yang menyatakan bahwa Trust In Online Store
berpengaruh terhadap Perceived Risk diterima.
2. Perceived Risk berpengaruh negatif terhadap Attitude Towards
Online Purchasing pada Produk Fashion Online di Surabaya.
Dengan demikian, hipotesis kedua yang menyatakan bahwa
Perceived Risk berpengaruh terhadap Attitude Towards Online
Purchasing diterima.
3. Attitude Towards Online Purchasing berpengaruh positif terhadap
Online Purchase Intention pada Produk Fashion Online di
Surabaya. Dengan demikian, hipotesis ketiga yang menyatakan
bahwa Attitude Towards Online Purchasing berpengaruh terhadap
Online Purchase Intention diterima.
5.2 Saran
Berdasarkan pada simpulan penelitian di atas, maka saran yang
diajukan adalah sebagai berikut:
1. Penelitian mendatang diharapkan mampu melakukan
penelitian lebih dalam mengenai hubungan antara Trust In
Online Store dengan Perceived Risk, Perceived Risk dengan
Attitude Towards Online Purchasing dan Attitude Towards

69
Online Purchasing dengan Online Purchase Intention pada
produk fashion secara online. Dan juga pengaruh variabel lain
terhadap Minat Beli Konsumen yang tidak dijelaskan pada
penelitian ini cukup besar presentasenya, sehingga diharapkan
pihak peneliti dapat meneliti lebih lanjut variabel-variabel lain
yang berpengaruh terhadap Miat Beli Konsumen.
2. Peningkatan Minat Beli Konsumen dapat dilakukan dengan
peningkatan kepercayaan atas toko online, pengurangan resiko
yang terjadi, dan sikap terhadap pembelian online. Semakin
besar nilai kepercayaan konsumen terhadap toko online, maka
semakin kecil resiko yang dialami dan semakin bertambah
sikap konsumen akan pembelian secara online. Dan juga pihak
toko online produk fashion perlu meningkatkan tingkat
kepercayaan konsumen terhadap produk yang ditawarkan
kepada konsumen, sehingga diharapkan konsumen memiliki
kepercayaan yang sesuai dengan harapannya.
3. Adanya keterbatasan penelitian tentang objek penelitian yang
kurang mengarah pada pembelian online shopping. Disini
peneliti meneliti melalui media promosi seperti facebook dan
blackberry messanger, sehingga diharapkan pada penelitian
mendatang peneliti dapat melakukan penelitian melalui situs
online shopping seperti kaskus, toko bagus.com, berniaga.com
dan lainnya.

70
DAFTAR KEPUSTAKAAN
Dursun, Inci., Kabadayi, Tumer., Alan, Kocak., dan Sezen Billent, 2011, Store Brand Purhase Intention: Effects of Risk, Quality, Familiarity and Store Brand Shelf Space, Journal of Global Strategic Management., pp:114.
Hassanein, Khaled., dan Milena, Head., 2004, The Influence of Product Type on Online Trust, Journal 17th Bled Electronic Commerce Conference Global., pp:2.
Heijeden., Verhagen., dan Creemer, 2003, Understanding Online Purchase Intentions: Contributions From Technology and Trust Perspectives, European Journal of Information Systems, 12., pp:43.
Herawati, Vina, 2012, Pengaruh Persepsi Kualitas Produk Terhadap Niat Pembelian Ulang Pada Private Label “Carrefour” Di Carrefour Melalui Kepuasan Konsumen Sebagai Variabel Mediasi, Skripsi, Surabaya: Universitas Katolik Widya Mandala.
Jun, Guo., dan Jaafar, Ismawati., 2011, A Study on Consumers’ Attitude Towards Online Shopping in China, International Journal of Business and Social Science, Vol. 2 No. 22., pp:123-124.
Jusoh, Md., dan Ling, Hai., 2012, Factors Influencing Consumers Attitude Towards E-Commerce Purchases Through Online Shopping, International Journal of Humanities and Social Science, Vol. 2 No.4., pp:224.
Kim. J., Ferrin, L., dan Rao, Raghav., 2008, A Trust-Based Consumer Decision-Making Model in Electronic Commerce: The Role of Trust, Perceived Risk, and Their Antacedents, Journal Decision Support Systems 44., pp:544-564.
Kwek, Ling Choon., Tan, Piew Hoi., dan Lau, Chai Teck., 2010, Investigating the Shopping Orientations on Online Purchase
71
Intention in the E-Commerce Environment: A Malaysian Study, Journal of Internet Banking and Commerce, Vol. 15, No. 2., pp:4- 5. Liang , TP., dan Lai, HJ., 2000, Electronic Store Design and Consumer Choice : An Empirical Study, Journal in Proceeding of The 33rd Hawaii International Conference on System Sci., pp:1-10.
Lim, Heejin., dan Dubinsky J., 2004, Consumers’ Perceptions of E- Shopping Characteristics: An Expectancy-Value Approach, Journal of Services Marketing, Vol. 18, No. 7., pp:500-513.
Maharsi, Sri., dan Fenny., 2006, Analisa Faktor-Faktor yang Mempengaruhi Kepercayaan dan Pengaruh Kepercayaan Terhadap Loyalitas Pengguna Internet Banking di Surabaya, Jurnal Akuntansi dan Keuangan, Vol. 8, No. 1., pp:37.
McGoldrick, Peter J., 2002, Retail Marketing, New York. USA: McGraw Hill, Irwin. Sina, S. S., 2011, Modul Pembelajaran Analisis Multivariat, Surabaya:
Fakultas Bisnis Universitas Katolik Widya Mandala.
Schiffman, Leon G., dan L.L,. Kanuk., 2000, Consumer Behavior, 7th ed., Upper Saddle River, New Jersey: Prentice Hall Inc.
Tang, Tzy-Wen., dan Wen-Hai, Chi., 2005, The Role of Trust in Customer Online Shopping Behavior: Perspective of Technology Acceptance Model, Marketing Journals Vol. 15 No. 1, 2004., pp:2.
Teo, H., 2002, Attitudes Toward Online Shopping and The Internet, Journal Behaviour & Information Technology, Vol. 21, No. 4., pp:264.
Utami, Christina W., 2008, Stategi Pemasaran Ritel, Jakarta: Indeks.
72
Zendehel, Marzieh., Paim, HJ., Bojei, B., dan Osman, BT., 2011, The Effects on Trust on Online Malaysian Students Buying Behavior, Australian Journal of Basic and Applied Sciences., pp:1125-1126.
Zhou, X., Dan Xiangchun, Liu., 2005, Effective User Interface Design For Consumer Trust, www.luleauniversityoftechnology.com. (Akses tgl. 10 Juni 2012)., pp:3.
Kuesioner Penelitian
Kepada:
Yth. Para Responden
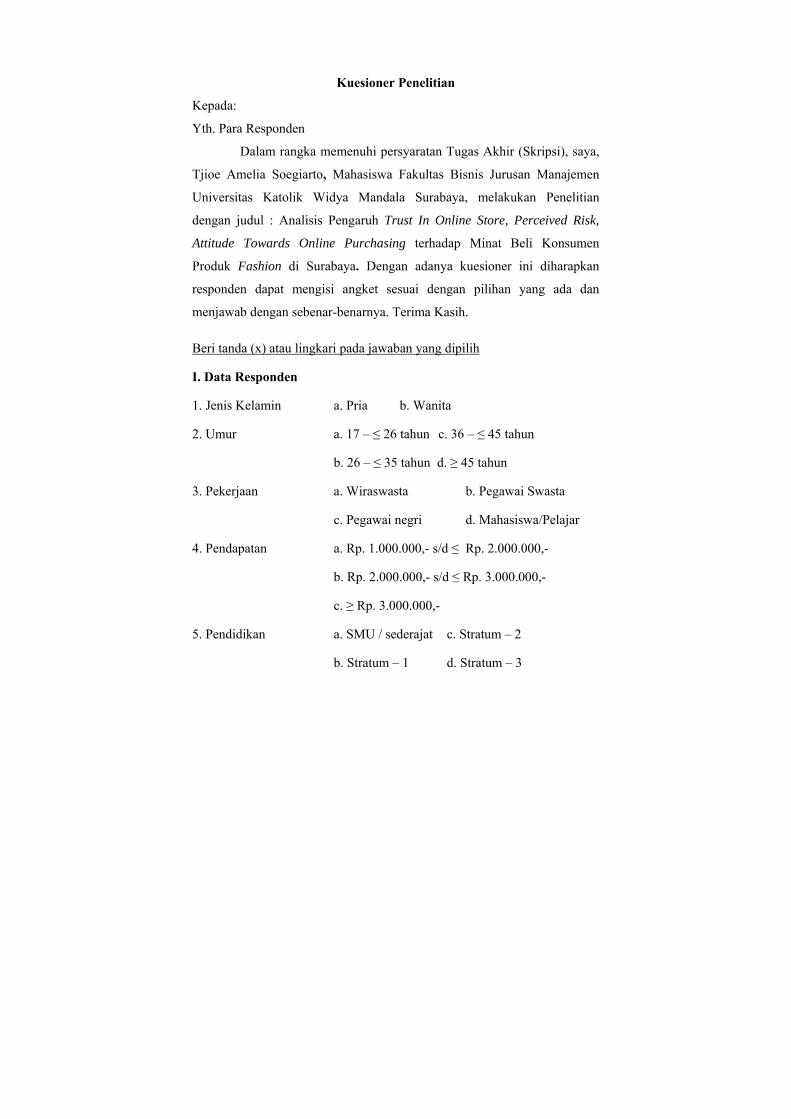
Dalam rangka memenuhi persyaratan Tugas Akhir (Skripsi), saya,
Tjioe Amelia Soegiarto, Mahasiswa Fakultas Bisnis Jurusan Manajemen
Universitas Katolik Widya Mandala Surabaya, melakukan Penelitian
dengan judul : Analisis Pengaruh Trust In Online Store, Perceived Risk,
Attitude Towards Online Purchasing terhadap Minat Beli Konsumen
Produk Fashion di Surabaya. Dengan adanya kuesioner ini diharapkan
responden dapat mengisi angket sesuai dengan pilihan yang ada dan
menjawab dengan sebenar-benarnya. Terima Kasih.
Beri tanda (x) atau lingkari pada jawaban yang dipilih
I. Data Responden
1. Jenis Kelamin a. Pria b. Wanita
2. Umur a. 17 – ≤ 26 tahun c. 36 – ≤ 45 tahun
b. 26 – ≤ 35 tahun d. ≥ 45 tahun
3. Pekerjaan a. Wiraswasta b. Pegawai Swasta
c. Pegawai negri d. Mahasiswa/Pelajar
4. Pendapatan a. Rp. 1.000.000,- s/d ≤ Rp. 2.000.000,-
b. Rp. 2.000.000,- s/d ≤ Rp. 3.000.000,-
c. ≥ Rp. 3.000.000,-
5. Pendidikan a. SMU / sederajat c. Stratum – 2
b. Stratum – 1 d. Stratum – 3
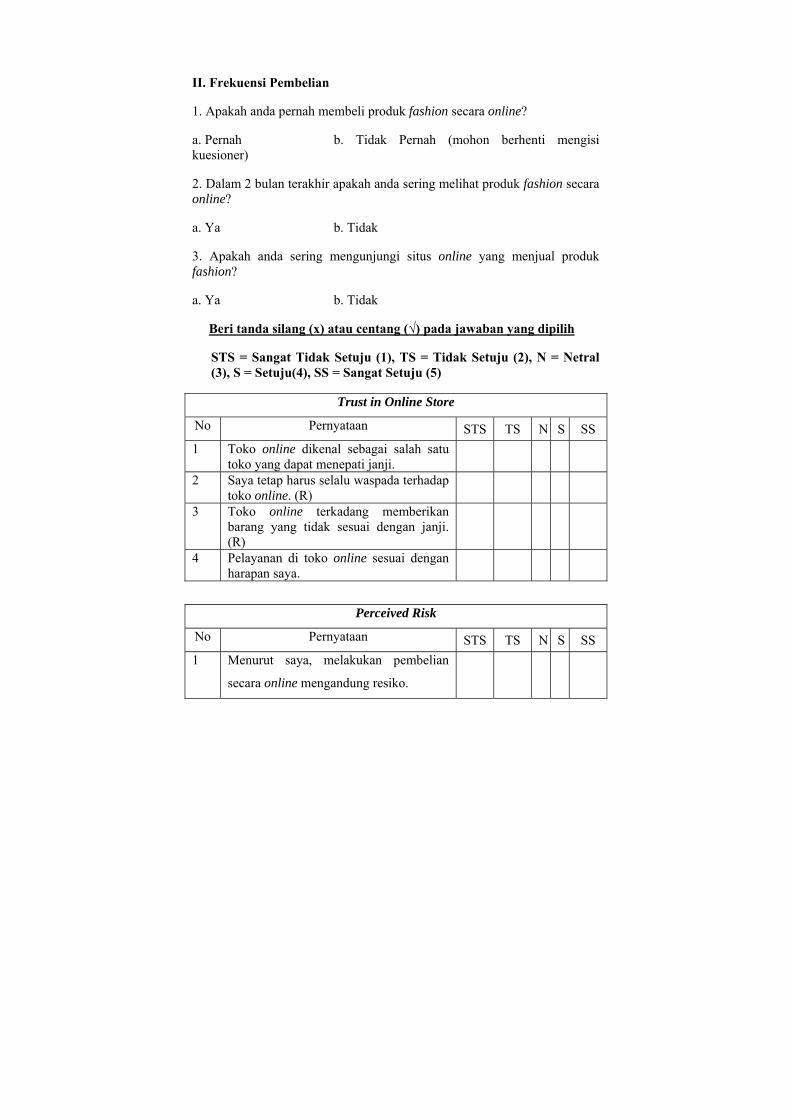
II. Frekuensi Pembelian
1. Apakah anda pernah membeli produk fashion secara online?
a. Pernah b. Tidak Pernah (mohon berhenti mengisi kuesioner)
2. Dalam 2 bulan terakhir apakah anda sering melihat produk fashion secara online?
a. Ya b. Tidak
3. Apakah anda sering mengunjungi situs online yang menjual produk fashion?
a. Ya b. Tidak
Beri tanda silang (x) atau centang (√) pada jawaban yang dipilih
STS = Sangat Tidak Setuju (1), TS = Tidak Setuju (2), N = Netral (3), S = Setuju(4), SS = Sangat Setuju (5)
Trust in Online Store
No Pernyataan STS TS N S SS
1 Toko online dikenal sebagai salah satu toko yang dapat menepati janji.
2 Saya tetap harus selalu waspada terhadap toko online. (R)
3 Toko online terkadang memberikan barang yang tidak sesuai dengan janji. (R)
4 Pelayanan di toko online sesuai dengan harapan saya.
Perceived Risk
No Pernyataan STS TS N S SS
1 Menurut saya, melakukan pembelian
secara online mengandung resiko.

2 Saya tidak yakin bahwa produk yang
dibeli secara online akan persis seperti
yang ditawarkan.
3 Pembelian secara online beresiko
mengingat pengorbanan yang harus saya
keluarkan.
Attitudes Towards Online Shopping
No Pernyataan STS TS N S SS
1 Ide menggunakan website untuk membeli produk fashion secara online adalah suatu hal yang menarik.
2 Saya suka dengan adanya ide membeli produk fashion secara online melalui website
3 Menggunakan website untuk membeli produk fashion secara online merupakan ide yang bagus.
Online Purchase Intention
No Pernyataan STS TS N S SS
1 Saya akan kembali berbelanja secara online.
2 Saya akan memilih membeli produk fashion secara online dalam waktu dekat ini.
3 Saya akan memilih membeli produk fashion secara online dalam jangka waktu yang panjang. (R)

Lampiran 1
Deskripsi Responden
Distribusi Jenis Kelamin Responden
Karakteristik Responden
Jumlah %
Jenis kelamin Pria 39 26
Wanita 111 74
Total 150 100
Distribusi Umur Responden
Range Umur Responden
Jumlah %
17 – ≤ 26 Tahun 90 60
26 – ≤ 35 Tahun 36 24
36 – ≤ 45 Tahun 18 12
≥ 45 Tahun 6 4
Total 150 100
Distribusi Pekerjaan Responden
Pekerjaan Responden
Jumlah %
Wiraswasta 14 9,33
Pegawai Negri 22 14,67
Pegawai Swasta 45 30
Mahasiswa/Pelajar 69 46
Total 150 100
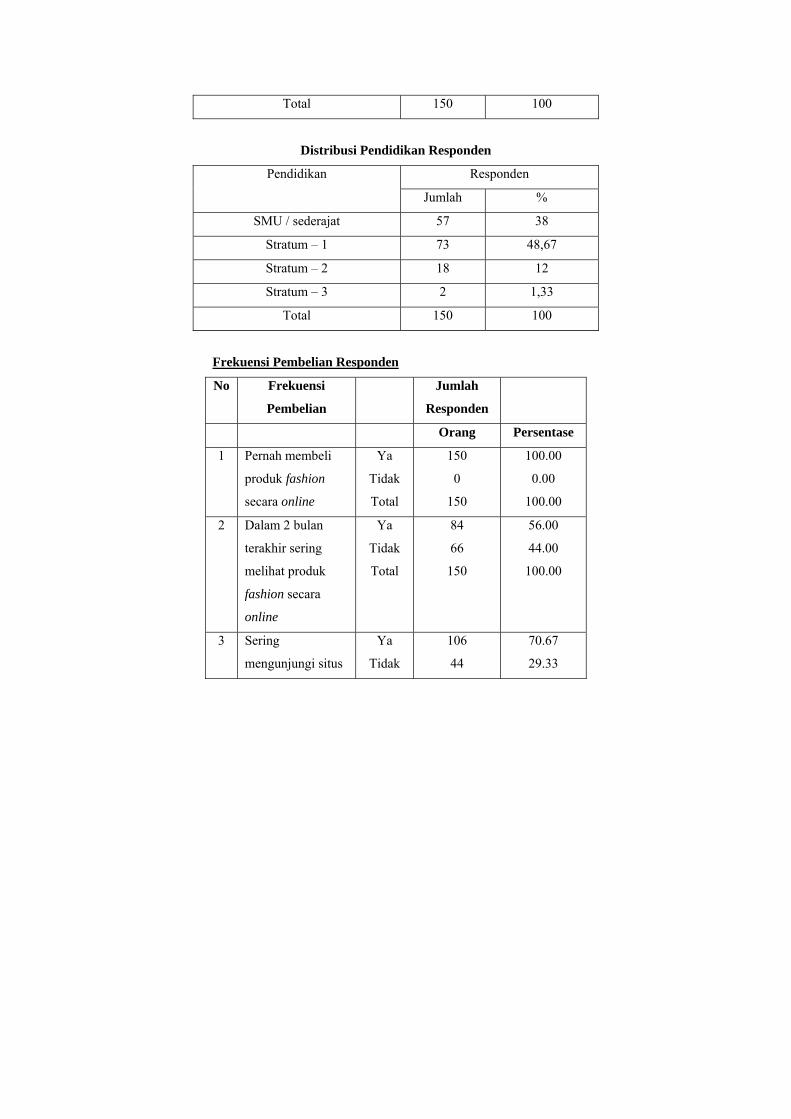
Distribusi Pendidikan Responden
Pendidikan Responden
Jumlah %
SMU / sederajat 57 38
Stratum – 1 73 48,67
Stratum – 2 18 12
Stratum – 3 2 1,33
Total 150 100
Frekuensi Pembelian Responden
No Frekuensi
Pembelian
Jumlah
Responden
Orang Persentase
1
Pernah membeli
produk fashion
secara online
Ya
Tidak
Total
150
0
150
100.00
0.00
100.00
2 Dalam 2 bulan
terakhir sering
melihat produk
fashion secara
online
Ya
Tidak
Total
84
66
150
56.00
44.00
100.00
3 Sering
mengunjungi situs
Ya
Tidak
106
44
70.67
29.33

online yang
menjual produk
fashion
Total 150 100.00

Statistik Deskripsi Variabel
Descriptives
Descriptive Statistics
Descriptive Statistics
N Minimum Maximum Mean Std.
Deviation PR1 150 1 5 2,49 1,230 PR2 150 1 5 2,49 1,151 PR3 150 1 5 2,39 1,423 PR 150 1,00 5,00 2,4556 1,16589 Valid N (listwise)
150
Descriptive Statistics
N Minimum Maximu
m Mean Std.
Deviation AT1 150 1 5 3,70 1,437 AT2 150 1 5 3,75 1,439 AT3 150 1 5 3,57 1,430 AT 150 1,00 5,00 3,6711 1,37897 Valid N (listwise)
150
N Minimu
m Maximum Mean Std.
Deviation TR1 150 1 5 3,55 1,059 TR2 150 1 5 3,57 1,277 TR3 150 1 5 3,54 1,191 TR4 150 1 5 3,49 1,145 TR 150 1,25 5,00 3,5383 1,05620 Valid N (listwise)
150

Descriptive Statistics
N Minimum Maximu
m Mean Std.
Deviation OP1 150 1 5 3,80 1,390 OP2 150 1 5 3,77 1,424 OP3 150 1 5 3,61 1,414 OP 150 1,00 5,00 3,7267 1,35170 Valid N (listwise)
150
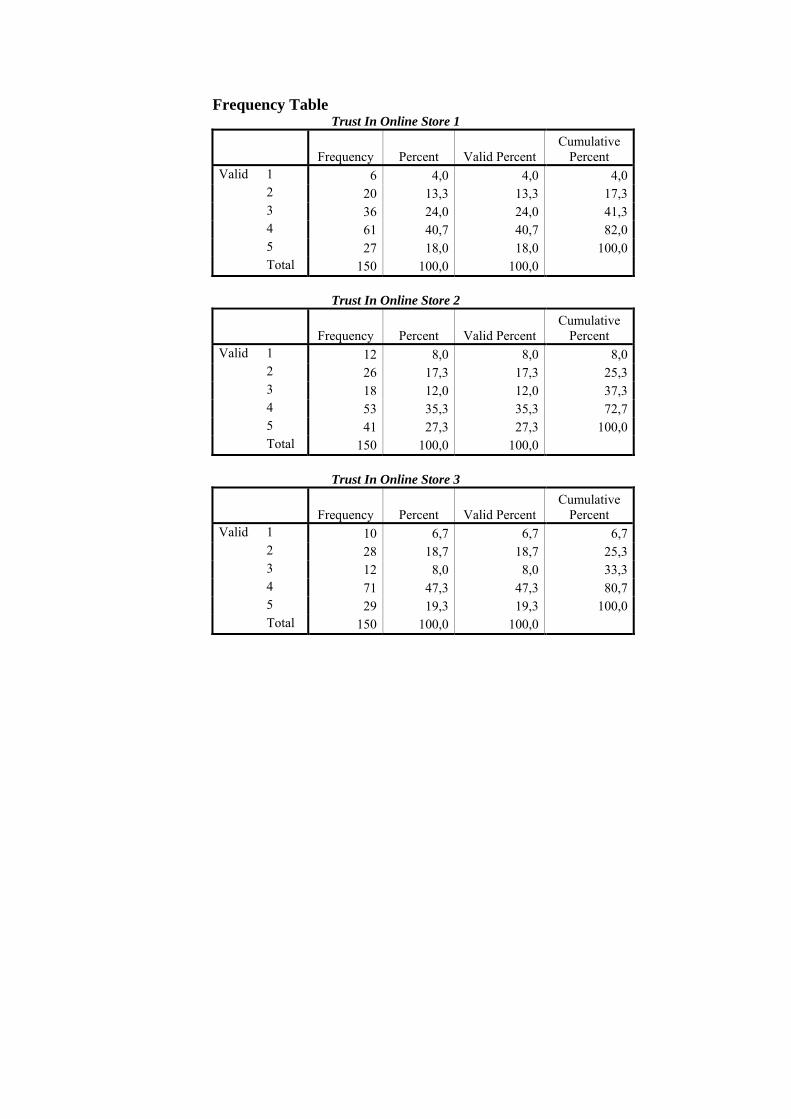
Frequency Table Trust In Online Store 1
Frequency Percent Valid Percent Cumulative
Percent Valid 1 6 4,0 4,0 4,0
2 20 13,3 13,3 17,3 3 36 24,0 24,0 41,3 4 61 40,7 40,7 82,0 5 27 18,0 18,0 100,0 Total 150 100,0 100,0
Trust In Online Store 2
Frequency Percent Valid Percent Cumulative
Percent Valid 1 12 8,0 8,0 8,0
2 26 17,3 17,3 25,3 3 18 12,0 12,0 37,3 4 53 35,3 35,3 72,7 5 41 27,3 27,3 100,0 Total 150 100,0 100,0
Trust In Online Store 3
Frequency Percent Valid Percent Cumulative
Percent Valid 1 10 6,7 6,7 6,7
2 28 18,7 18,7 25,3 3 12 8,0 8,0 33,3 4 71 47,3 47,3 80,7 5 29 19,3 19,3 100,0 Total 150 100,0 100,0

Trust In Online Store 4
Frequency Percent Valid Percent Cumulative
Percent Valid 1 9 6,0 6,0 6,0
2 25 16,7 16,7 22,7 3 26 17,3 17,3 40,0 4 63 42,0 42,0 82,0 5 27 18,0 18,0 100,0 Total 150 100,0 100,0
Perceived Risk 1
Frequency Percent Valid Percent Cumulative
Percent Valid 1 32 21,3 21,3 21,3
2 63 42,0 42,0 63,3 3 15 10,0 10,0 73,3 4 29 19,3 19,3 92,7 5 11 7,3 7,3 100,0 Total 150 100,0 100,0
Perceived Risk 2
Frequency Percent Valid Percent Cumulative
Percent Valid 1 32 21,3 21,3 21,3
2 55 36,7 36,7 58,0 3 27 18,0 18,0 76,0 4 30 20,0 20,0 96,0 5 6 4,0 4,0 100,0 Total 150 100,0 100,0
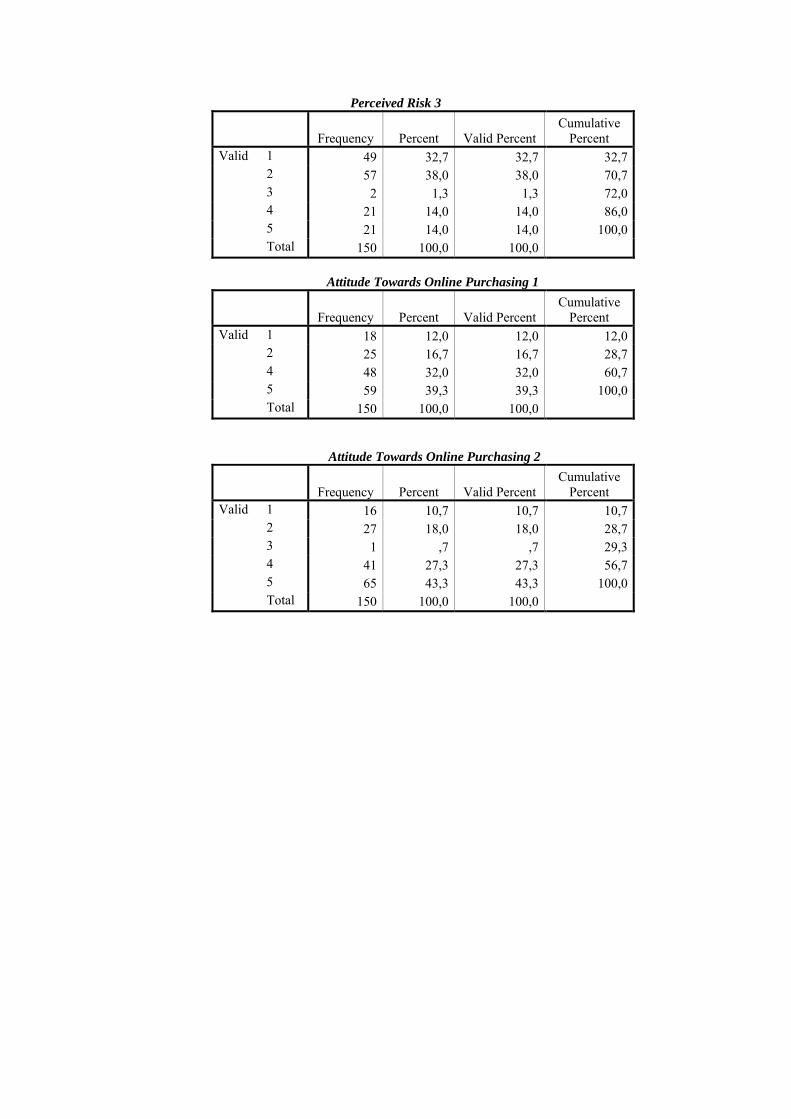
Perceived Risk 3
Frequency Percent Valid Percent Cumulative
Percent Valid 1 49 32,7 32,7 32,7
2 57 38,0 38,0 70,7 3 2 1,3 1,3 72,0 4 21 14,0 14,0 86,0 5 21 14,0 14,0 100,0 Total 150 100,0 100,0
Attitude Towards Online Purchasing 1
Frequency Percent Valid Percent Cumulative
Percent Valid 1 18 12,0 12,0 12,0
2 25 16,7 16,7 28,7 4 48 32,0 32,0 60,7 5 59 39,3 39,3 100,0 Total 150 100,0 100,0
Attitude Towards Online Purchasing 2
Frequency Percent Valid Percent Cumulative
Percent Valid 1 16 10,7 10,7 10,7
2 27 18,0 18,0 28,7 3 1 ,7 ,7 29,3 4 41 27,3 27,3 56,7 5 65 43,3 43,3 100,0 Total 150 100,0 100,0

Attitude Towards Online Purchasing 3
Frequency Percent Valid Percent Cumulative
Percent Valid 1 23 15,3 15,3 15,3
2 20 13,3 13,3 28,7 3 1 ,7 ,7 29,3 4 61 40,7 40,7 70,0 5 45 30,0 30,0 100,0 Total 150 100,0 100,0
Online Purchase Intention 1
Frequency Percent Valid Percent Cumulative
Percent Valid 1 13 8,7 8,7 8,7
2 28 18,7 18,7 27,3 4 44 29,3 29,3 56,7 5 65 43,3 43,3 100,0 Total 150 100,0 100,0
Online Purchase Intention 2
Frequency Percent Valid Percent Cumulative
Percent Valid 1 16 10,7 10,7 10,7
2 25 16,7 16,7 27,3 3 1 ,7 ,7 28,0 4 43 28,7 28,7 56,7 5 65 43,3 43,3 100,0 Total 150 100,0 100,0

Online Purchase Intention 3
Frequency Percent Valid Percent Cumulative
Percent Valid 1 22 14,7 14,7 14,7
2 19 12,7 12,7 27,3 3 1 ,7 ,7 28,0 4 62 41,3 41,3 69,3 5 46 30,7 30,7 100,0 Total 150 100,0 100,0

Lampiran 2
Correlations Correlations
TR1 TR2 TR3 TR4 TRTotal TR1 Pearson
Correlation 1 ,675** ,709** ,958** ,914**
Sig. (2-tailed)
,000 ,000 ,000 ,000
N 150 150 150 150 150 TR2 Pearson
Correlation ,675*
*1 ,791** ,712** ,887**
Sig. (2-tailed)
,000 ,000 ,000 ,000
N 150 150 150 150 150 TR3 Pearson
Correlation ,709*
*,791** 1 ,714** ,892**
Sig. (2-tailed)
,000 ,000 ,000 ,000
N 150 150 150 150 150 TR4 Pearson
Correlation ,958*
*,712** ,714** 1 ,927**
Sig. (2-tailed)
,000 ,000 ,000 ,000
N 150 150 150 150 150 TRTotal Pearson
Correlation ,914*
*,887** ,892** ,927** 1
Sig. (2-tailed)
,000 ,000 ,000 ,000
N 150 150 150 150 150 ** Correlation is significant at the 0.01 level (2-tailed).

Correlations
PR1 PR2 PR3 PRTotal PR1 Pearson
Correlation 1 ,692** ,830** ,917**
Sig. (2-tailed) ,000 ,000 ,000
N 150 150 150 150
PR2 Pearson Correlation ,692** 1 ,765** ,884**
Sig. (2-tailed) ,000 ,000 ,000
N 150 150 150 150
PR3 Pearson Correlation ,830** ,765** 1 ,951**
Sig. (2-tailed) ,000 ,000 ,000
N 150 150 150 150
PRTotal Pearson Correlation ,917** ,884** ,951** 1
Sig. (2-tailed) ,000 ,000 ,000
N 150 150 150 150
** Correlation is significant at the 0.01 level (2-tailed).
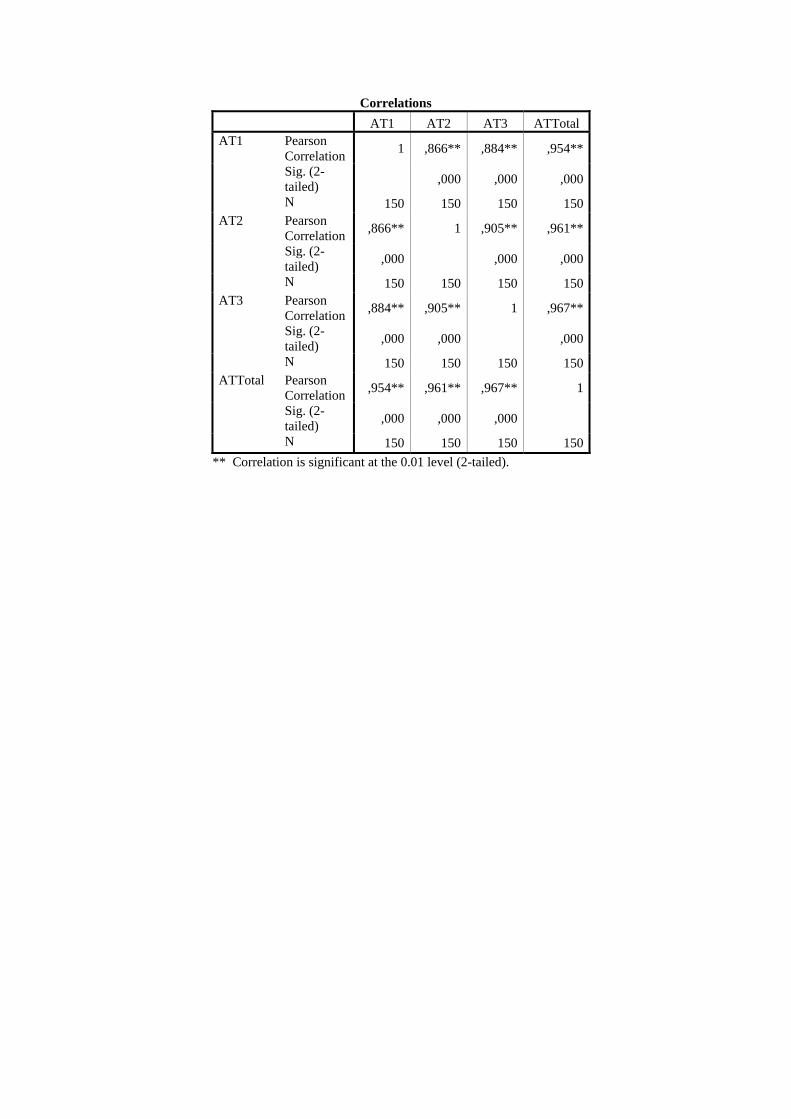
Correlations
AT1 AT2 AT3 ATTotal AT1 Pearson
Correlation 1 ,866** ,884** ,954**
Sig. (2-tailed)
,000 ,000 ,000
N 150 150 150 150 AT2 Pearson
Correlation ,866** 1 ,905** ,961**
Sig. (2-tailed)
,000 ,000 ,000
N 150 150 150 150 AT3 Pearson
Correlation ,884** ,905** 1 ,967**
Sig. (2-tailed)
,000 ,000 ,000
N 150 150 150 150 ATTotal Pearson
Correlation ,954** ,961** ,967** 1
Sig. (2-tailed)
,000 ,000 ,000
N 150 150 150 150
** Correlation is significant at the 0.01 level (2-tailed).

Correlations
OP1 OP2 OP3 OPTotal OP1 Pearson
Correlation 1 ,862** ,882** ,953**
Sig. (2-tailed) ,000 ,000 ,000 N 150 150 150 150 OP2 Pearson
Correlation ,862** 1 ,895** ,959**
Sig. (2-tailed) ,000 ,000 ,000 N 150 150 150 150 OP3 Pearson
Correlation ,882** ,895** 1 ,965**
Sig. (2-tailed) ,000 ,000 ,000 N 150 150 150 150 OPTotal Pearson
Correlation ,953** ,959** ,965** 1
Sig. (2-tailed) ,000 ,000 ,000 N 150 150 150 150
** Correlation is significant at the 0.01 level (2-tailed).
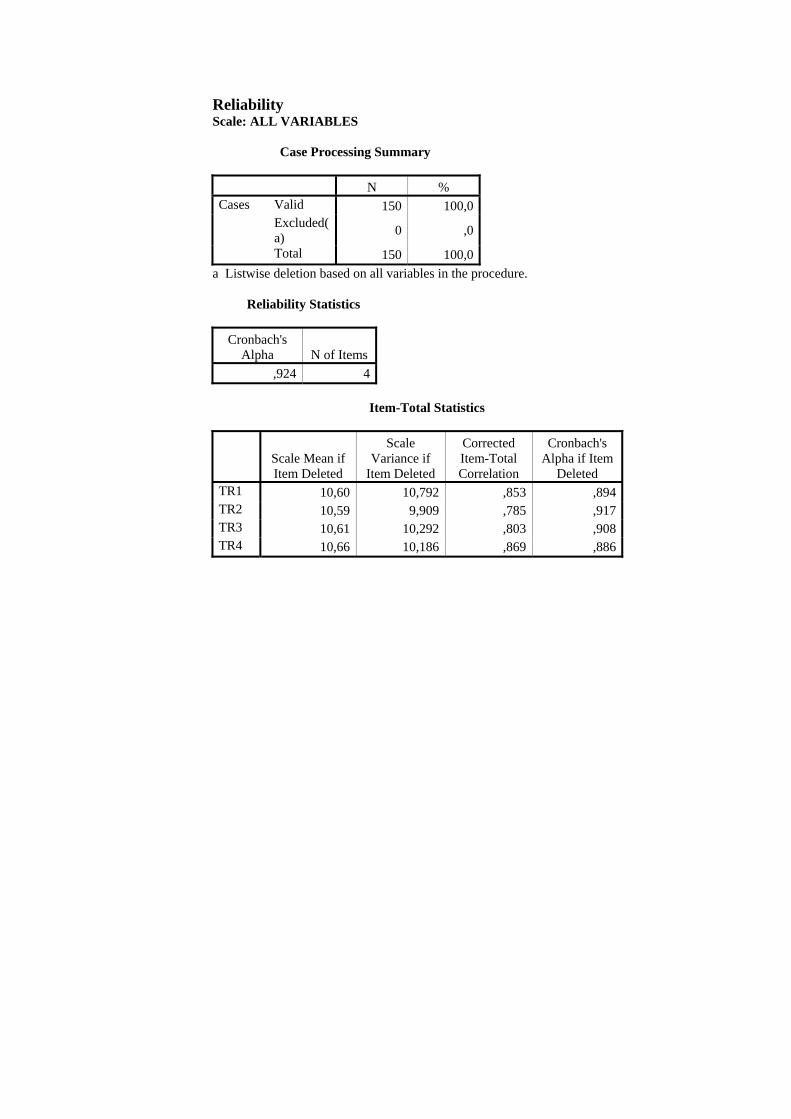
Reliability Scale: ALL VARIABLES Case Processing Summary
N % Cases Valid 150 100,0
Excluded(a)
0 ,0
Total 150 100,0
a Listwise deletion based on all variables in the procedure. Reliability Statistics
Cronbach's Alpha N of Items
,924 4
Item-Total Statistics
Scale Mean if Item Deleted
Scale Variance if
Item Deleted
Corrected Item-Total Correlation
Cronbach's Alpha if Item
Deleted TR1 10,60 10,792 ,853 ,894 TR2 10,59 9,909 ,785 ,917 TR3 10,61 10,292 ,803 ,908 TR4 10,66 10,186 ,869 ,886
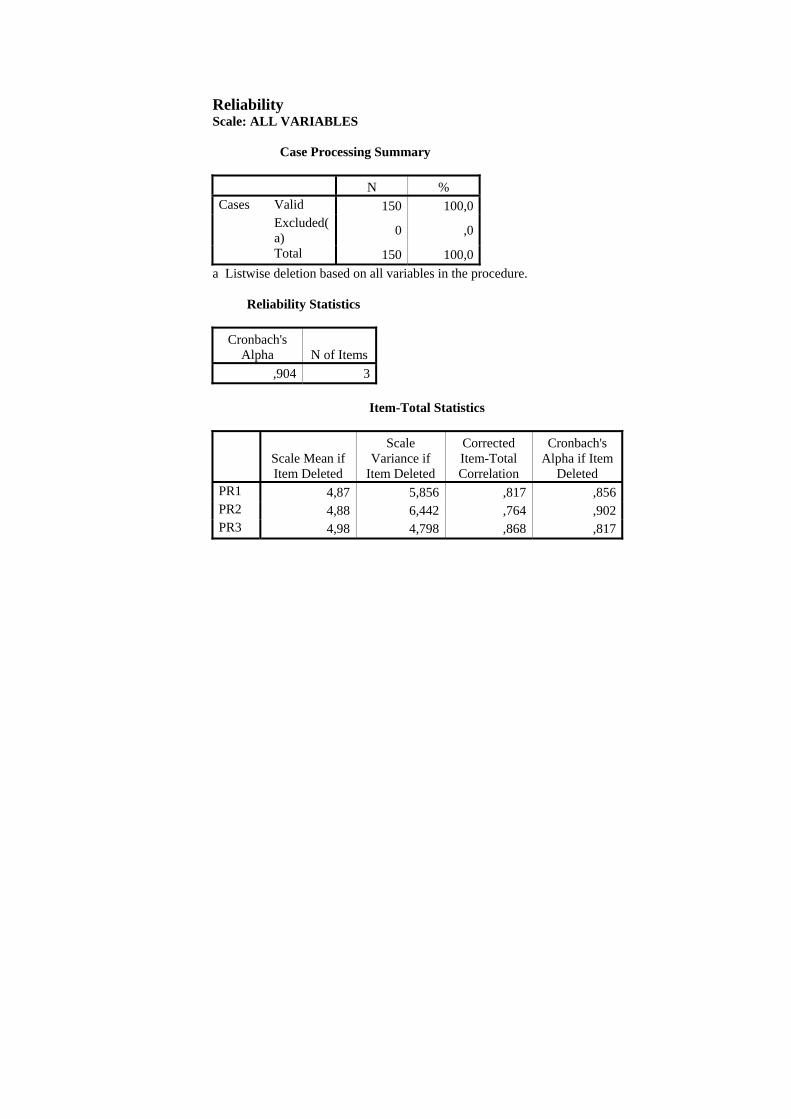
Reliability Scale: ALL VARIABLES Case Processing Summary
N % Cases Valid 150 100,0
Excluded(a)
0 ,0
Total 150 100,0
a Listwise deletion based on all variables in the procedure. Reliability Statistics
Cronbach's Alpha N of Items
,904 3
Item-Total Statistics
Scale Mean if Item Deleted
Scale Variance if
Item Deleted
Corrected Item-Total Correlation
Cronbach's Alpha if Item
Deleted PR1 4,87 5,856 ,817 ,856 PR2 4,88 6,442 ,764 ,902 PR3 4,98 4,798 ,868 ,817

Reliability Scale: ALL VARIABLES Case Processing Summary
N % Cases Valid 150 100,0
Excluded(a)
0 ,0
Total 150 100,0
a Listwise deletion based on all variables in the procedure. Reliability Statistics
Cronbach's Alpha N of Items
,958 3
Item-Total Statistics
Scale Mean if Item Deleted
Scale Variance if
Item Deleted
Corrected Item-Total Correlation
Cronbach's Alpha if Item
Deleted AT1 7,31 7,841 ,896 ,950 AT2 7,27 7,740 ,912 ,938 AT3 7,45 7,712 ,926 ,928

Reliability Scale: ALL VARIABLES Case Processing Summary
N % Cases Valid 150 100,0
Excluded(a)
0 ,0
Total 150 100,0
a Listwise deletion based on all variables in the procedure. Reliability Statistics
Cronbach's Alpha N of Items
,956 3
Item-Total Statistics
Scale Mean if Item Deleted
Scale Variance if
Item Deleted
Corrected Item-Total Correlation
Cronbach's Alpha if Item
Deleted OP1 7,38 7,633 ,895 ,945 OP2 7,41 7,397 ,906 ,937 OP3 7,57 7,374 ,921 ,925

Lampiran 3
Regression Descriptive Statistics
Mean Std. Deviation N Perceived 2,4556 1,16589 150 Trust 3,5383 1,05620 150
Correlations
Perceived Trust Pearson Correlation Perceived 1,000 -,693
Trust -,693 1,000 Sig. (1-tailed) Perceived . ,000
Trust ,000 . N Perceived 150 150
Trust 150 150

Variables Entered/Removed(b)
Model Variables Entered
Variables Removed Method
1 Trust(a) . Enter
a All requested variables entered. b Dependent Variable: Perceived Model Summary(b)
Model R R Square Adjusted R Square
Std. Error of the Estimate Durbin-Watson
1 ,693(a) ,481 ,477 ,84306 2,558
a Predictors: (Constant), Trust b Dependent Variable: Perceived

ANOVA(b)
Model
Sum of Squares Df
Mean Square F Sig.
1 Regression
97,346 1 97,346 136,962 ,000(a)
Residual 105,191 148 ,711 Total 202,537 149
a Predictors: (Constant), Trust b Dependent Variable: Perceived
Coefficients(a)
Model Unstandardized Coefficients
Standardized Coefficients t Sig. Correlations
Collinearity Statistics
B Std. Error Beta
Zero-order Partial Part
Tolerance VIF
1 (Constant)
5,163 ,241 21,389 ,000
Trust -,765 ,065 -,693 -11,703 ,000 -,693 -,693 -,693 1,000 1,000 a Dependent Variable: Perceived
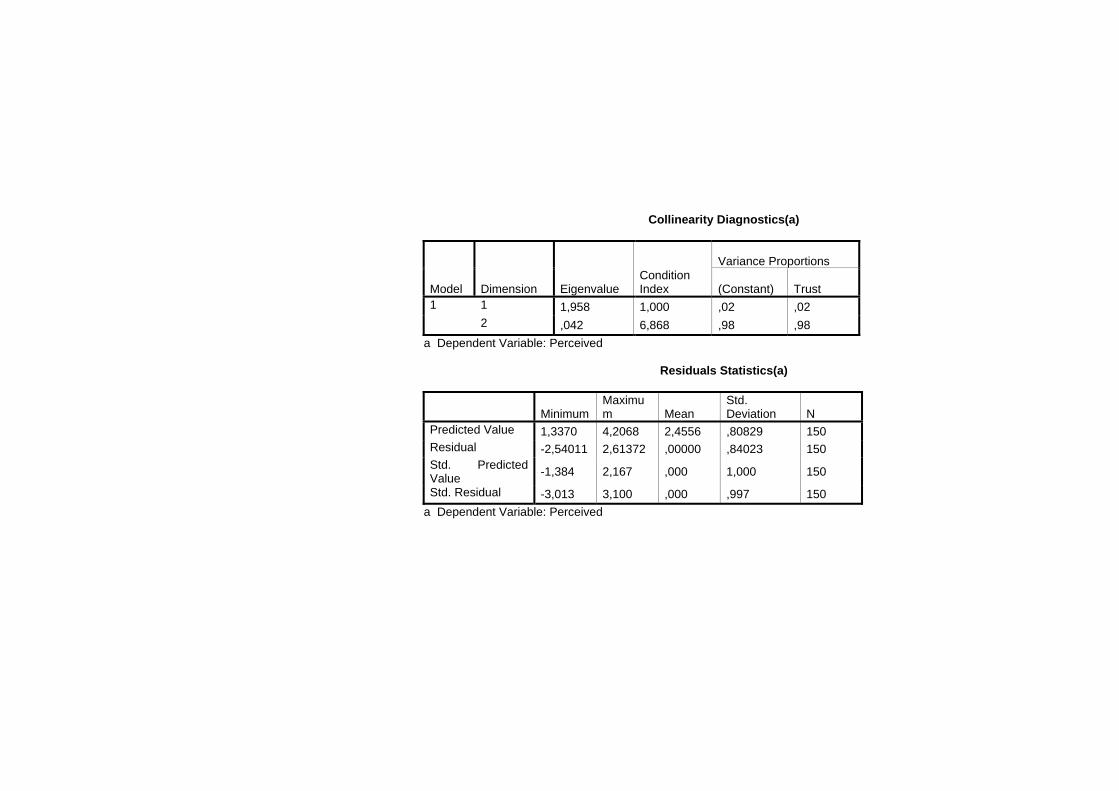
Collinearity Diagnostics(a)
Model Dimension Eigenvalue Condition Index
Variance Proportions
(Constant) Trust 1 1 1,958 1,000 ,02 ,02
2 ,042 6,868 ,98 ,98
a Dependent Variable: Perceived
Residuals Statistics(a)
Minimum Maximum Mean
Std. Deviation N
Predicted Value 1,3370 4,2068 2,4556 ,80829 150 Residual -2,54011 2,61372 ,00000 ,84023 150 Std. Predicted Value
-1,384 2,167 ,000 1,000 150
Std. Residual -3,013 3,100 ,000 ,997 150
a Dependent Variable: Perceived
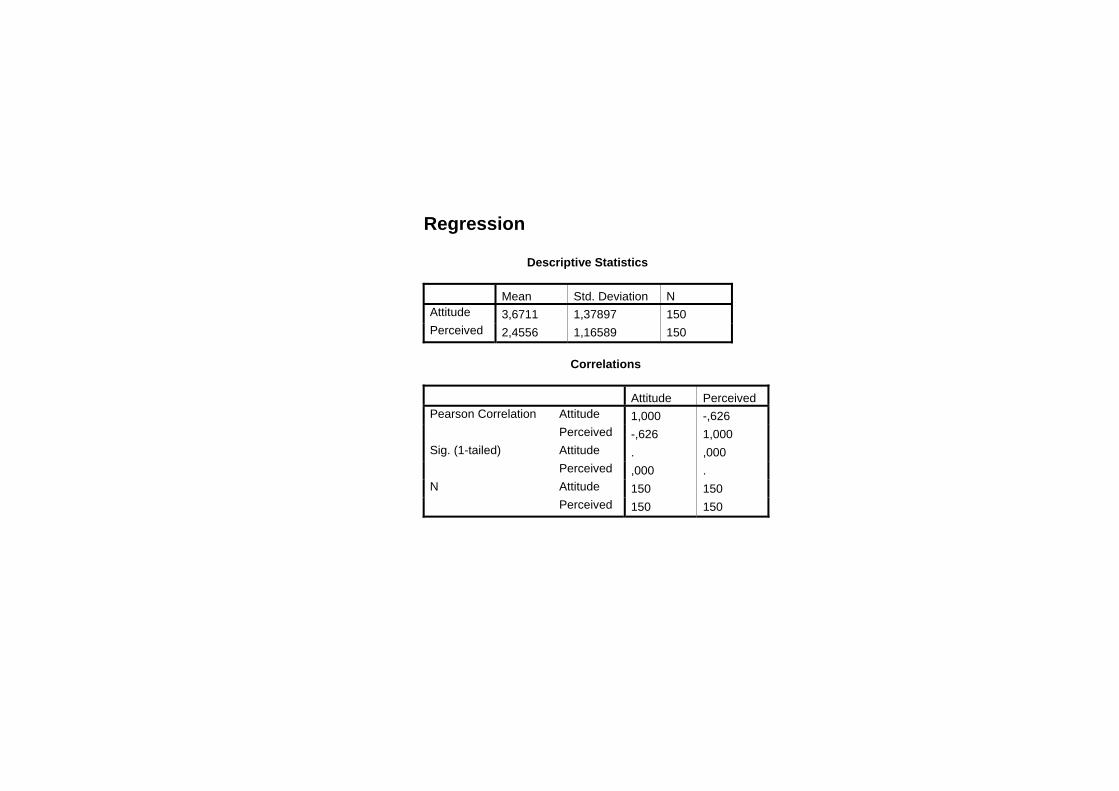
Regression Descriptive Statistics
Mean Std. Deviation N Attitude 3,6711 1,37897 150 Perceived 2,4556 1,16589 150
Correlations
Attitude Perceived Pearson Correlation Attitude 1,000 -,626
Perceived -,626 1,000 Sig. (1-tailed) Attitude . ,000
Perceived ,000 . N Attitude 150 150
Perceived 150 150

Variables Entered/Removed(b)
Model Variables Entered
Variables Removed Method
1 Perceived(a)
. Enter
a All requested variables entered. b Dependent Variable: Attitude
Model Summary(b)
Model R R Square Adjusted R Square
Std. Error of the Estimate Durbin-Watson
1 ,626(a) ,391 ,387 1,07944 2,423
a Predictors: (Constant), Perceived b Dependent Variable: Attitude

ANOVA(b)
Model
Sum of Squares df
Mean Square F Sig.
1 Regression
110,882 1 110,882 95,163 ,000(a)
Residual 172,448 148 1,165 Total 283,330 149
a Predictors: (Constant), Perceived b Dependent Variable: Attitude
Coefficients(a)
Model Unstandardized Coefficients
Standardized Coefficients t Sig. Correlations
Collinearity Statistics
B Std. Error Beta
Zero-order Partial Part
Tolerance VIF
1 (Constant)
5,488 ,206 26,634 ,000
Perceived
-,740 ,076 -,626 -9,755 ,000 -,626 -,626 -,626 1,000 1,000
a Dependent Variable: Attitude
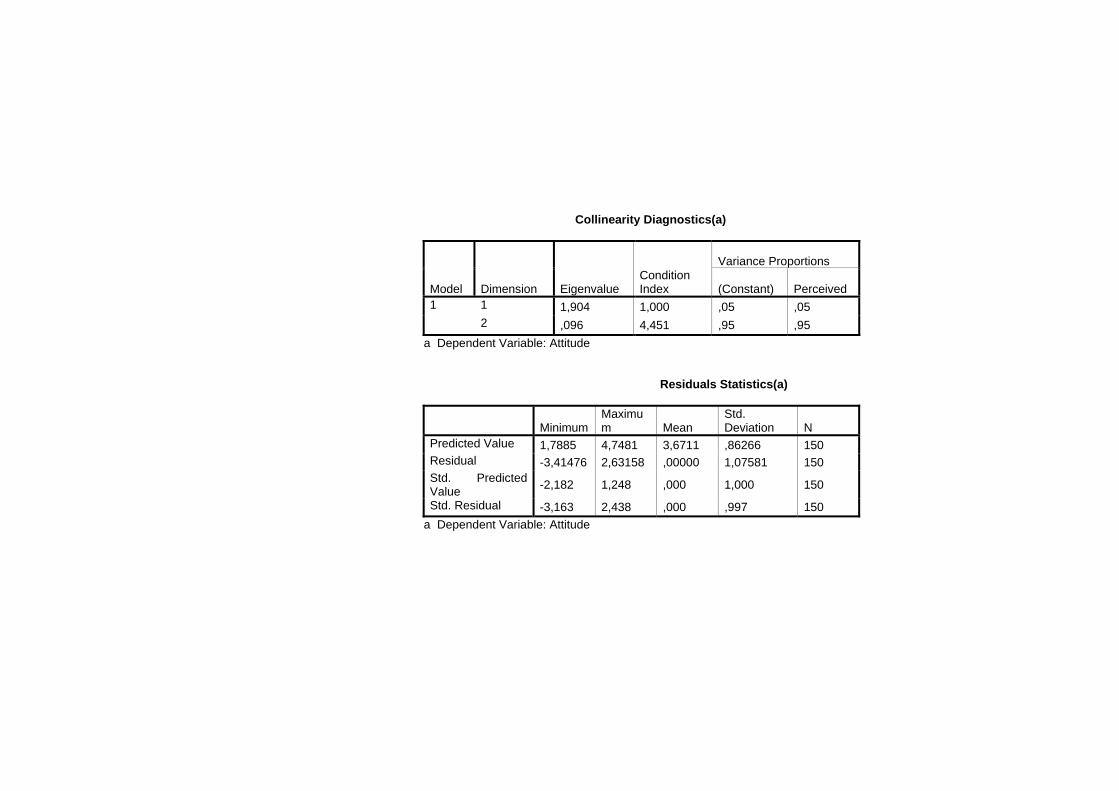
Collinearity Diagnostics(a)
Model Dimension Eigenvalue Condition Index
Variance Proportions
(Constant) Perceived 1 1 1,904 1,000 ,05 ,05
2 ,096 4,451 ,95 ,95
a Dependent Variable: Attitude
Residuals Statistics(a)
Minimum Maximum Mean
Std. Deviation N
Predicted Value 1,7885 4,7481 3,6711 ,86266 150 Residual -3,41476 2,63158 ,00000 1,07581 150 Std. Predicted Value
-2,182 1,248 ,000 1,000 150
Std. Residual -3,163 2,438 ,000 ,997 150
a Dependent Variable: Attitude
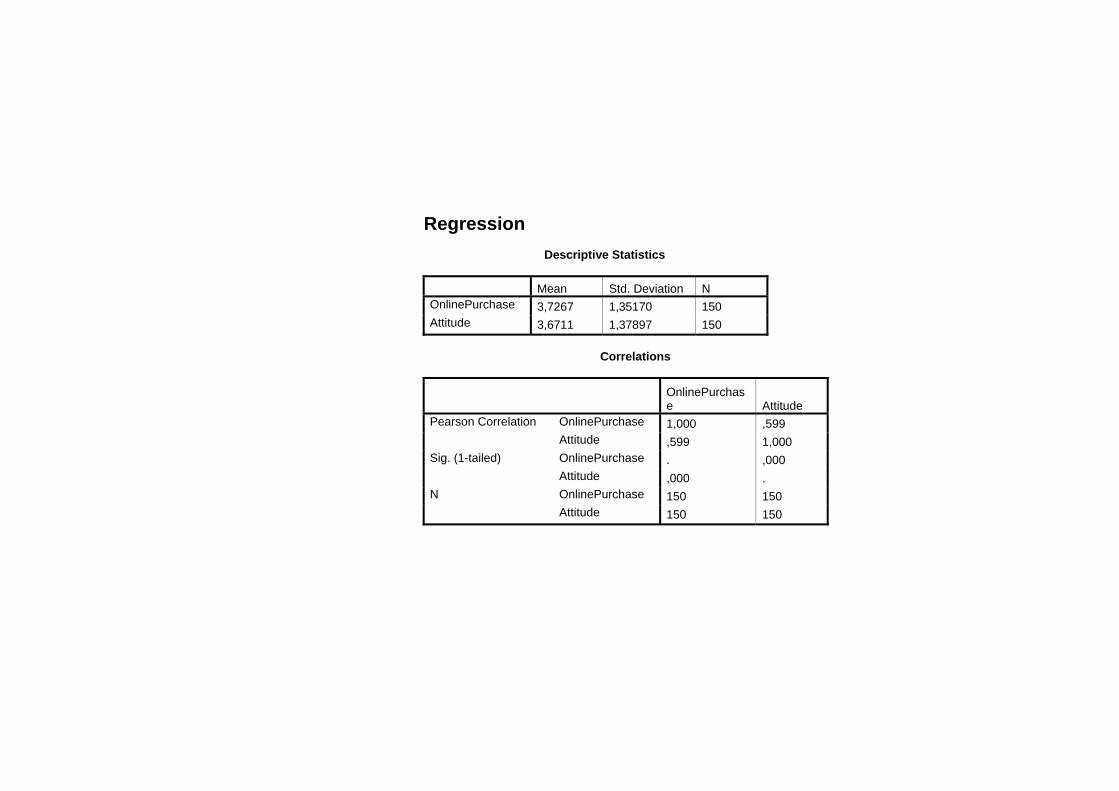
Regression Descriptive Statistics
Mean Std. Deviation N OnlinePurchase 3,7267 1,35170 150 Attitude 3,6711 1,37897 150
Correlations
OnlinePurchase Attitude
Pearson Correlation OnlinePurchase 1,000 ,599 Attitude ,599 1,000
Sig. (1-tailed) OnlinePurchase . ,000 Attitude ,000 .
N OnlinePurchase 150 150 Attitude 150 150
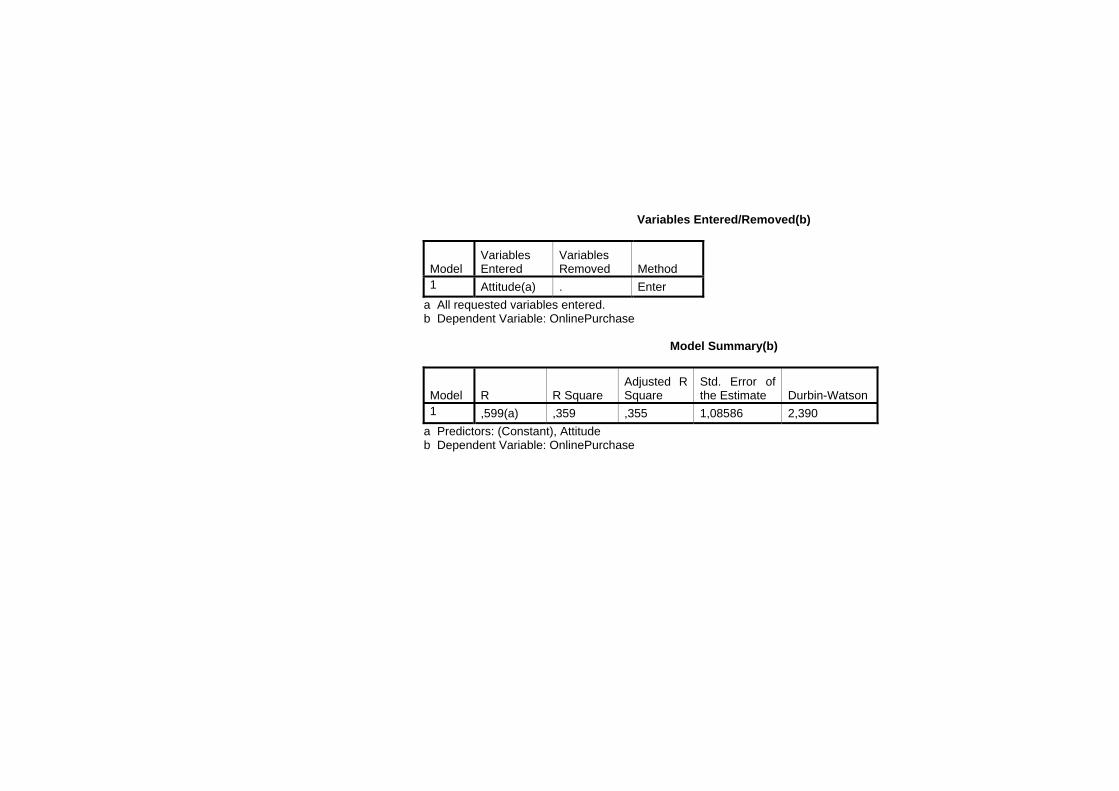
Variables Entered/Removed(b)
Model Variables Entered
Variables Removed Method
1 Attitude(a) . Enter
a All requested variables entered. b Dependent Variable: OnlinePurchase
Model Summary(b)
Model R R Square Adjusted R Square
Std. Error of the Estimate Durbin-Watson
1 ,599(a) ,359 ,355 1,08586 2,390
a Predictors: (Constant), Attitude b Dependent Variable: OnlinePurchase

ANOVA(b)
Model Sum of Squares Df
Mean Square F Sig.
1 Regression 97,732 1 97,732 82,887 ,000(a) Residual 174,506 148 1,179 Total 272,238 149
a Predictors: (Constant), Attitude b Dependent Variable: OnlinePurchase
Coefficients(a)
Model Unstandardized Coefficients
Standardized Coefficients T Sig. Correlations
Collinearity Statistics
B Std. Error Beta
Zero-order Partial Part
Tolerance VIF
1 (Constant)
1,571 ,253 6,211 ,000
Attitude
,587 ,065 ,599 9,104 ,000 ,599 ,599 ,599 1,000 1,000
a Dependent Variable: OnlinePurchase

Collinearity Diagnostics(a)
Model Dimension Eigenvalue Condition Index
Variance Proportions
(Constant) Attitude 1 1 1,937 1,000 ,03 ,03
2 ,063 5,523 ,97 ,97
a Dependent Variable: OnlinePurchase
Residuals Statistics(a)
MinimumMaximum Mean
Std. Deviation N
Predicted Value 2,1579 4,5071 3,7267 ,80989 150 Residual -3,31137 2,64635 ,00000 1,08221 150 Std. Predicted Value
-1,937 ,964 ,000 1,000 150
Std. Residual -3,050 2,437 ,000 ,997 150
a Dependent Variable: OnlinePurchase