1 computed tomography scanner (ct-scan) pemindai...
TRANSCRIPT

PT. SIEMENS INDONESIA
(c) Daniel Kartawiguna, 2006 [email protected] 1
1
Always Thinking Ahead.
1
Always Thinking Ahead.
Computed Tomography Scanner (CT-Scan)(Pemindai Tomografi Komputer)Oleh: Daniel Kartawiguna, ST., MM., M.Acc.PT. SIEMENS INDONESIA – Medical [email protected]
DISAJIKAN DALAM RANGKA PELATIHAN CT SCAN DOSEN ATEM
JAKARTA, 19 JUNI 2006
2
Always Thinking Ahead.
2
Always Thinking Ahead.
MATERI PELATIHAN
I. Dasar Tomografi KomputerII. Sistem Tomografi Komputer SpiralIII.Sistem Tomografi Komputer Multi
Irisan (MSCT)IV.Pemeliharaan dan PerbaikkanV. Aplikasi Klinis MSCT

PT. SIEMENS INDONESIA
(c) Daniel Kartawiguna, 2006 [email protected] 2
3
Always Thinking Ahead.
3
Always Thinking Ahead.
I. Dasar-dasar Tomografi Komputer
4
Always Thinking Ahead.
4
Always Thinking Ahead.
POKOK BAHASAN1.Tomografi Komputer dan Sejarah
Perkembangannya2.Prinsip Tomografi Komputer3.Komponen2 Tomografi Komputer4.Sistem Tomografi Komputer yang
dikembangkan oleh SIEMENS5.Kalibrasi6.Pemeriksaan Kualitas Gambar
Dasar-dasar Tomografi Komputer

PT. SIEMENS INDONESIA
(c) Daniel Kartawiguna, 2006 [email protected] 3
5
Always Thinking Ahead.
5
Always Thinking Ahead.
POKOK BAHASAN1.Tomografi Komputer dan Sejarah
Perkembangannya2.Prinsip Tomografi Komputer3.Komponen2 Tomografi Komputer4.Sistem Tomografi Komputer yang
dikembangkan oleh SIEMENS5.Kalibrasi6.Pemeriksaan Kualitas Gambar
Dasar-dasar Tomografi Komputer
6
Always Thinking Ahead.
6
Always Thinking Ahead.
PenemuanPenemuan SinarSinar--XXSinar-X ditemukan pada
tahun 1895 oleh seorang ahli
fisika Jerman yang bernama:
Wilhelm Conrad Röntgen
PT. SIEMENS INDONESIA
(c) Daniel Kartawiguna, 2006 [email protected] 4
7
Always Thinking Ahead.
7
Always Thinking Ahead.
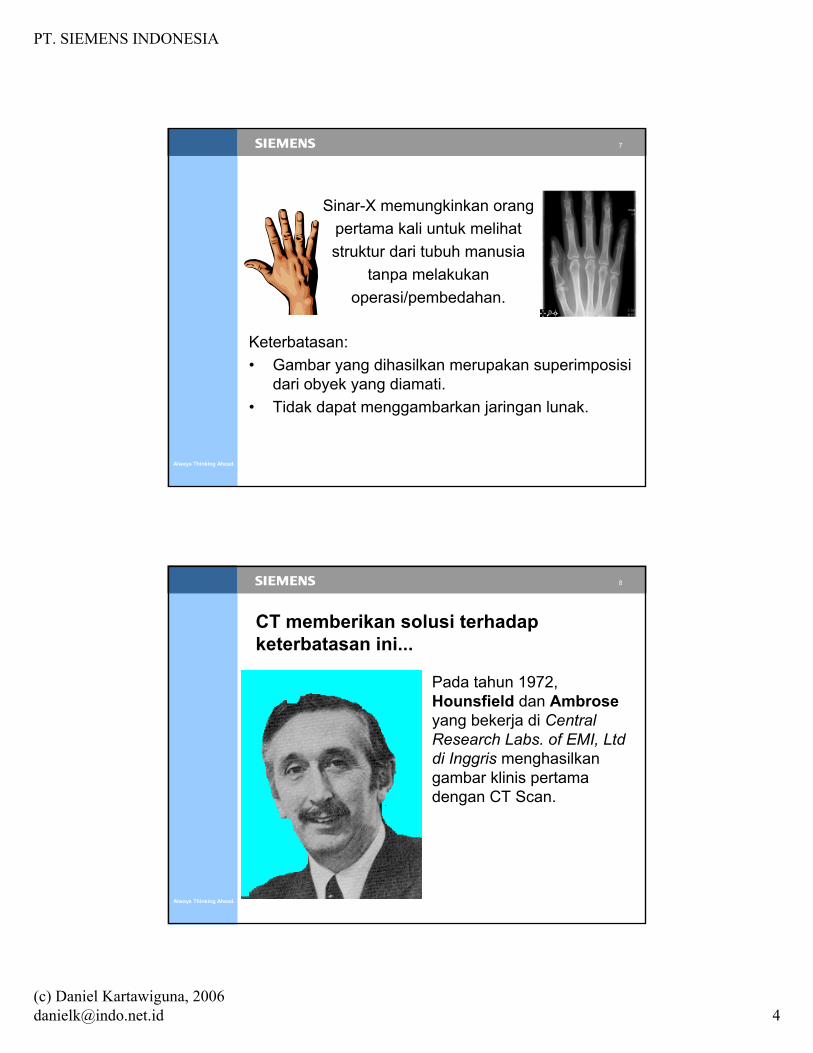
Keterbatasan:• Gambar yang dihasilkan merupakan superimposisi
dari obyek yang diamati. • Tidak dapat menggambarkan jaringan lunak.
Sinar-X memungkinkan orangpertama kali untuk melihatstruktur dari tubuh manusia
tanpa melakukanoperasi/pembedahan.
8
Always Thinking Ahead.
8
Always Thinking Ahead.
Pada tahun 1972, Hounsfield dan Ambrose yang bekerja di Central Research Labs. of EMI, Ltd di Inggris menghasilkangambar klinis pertamadengan CT Scan.
CT memberikan solusi terhadapketerbatasan ini...

PT. SIEMENS INDONESIA
(c) Daniel Kartawiguna, 2006 [email protected] 5
9
Always Thinking Ahead.
9
Always Thinking Ahead.
memungkinkanpertama kali kita dapatmelihat:
• Memerlukan waktu yang lama.
• Resolusi perlu ditingkatkan.
GambarGambar CT yang CT yang pertamapertama
- Tomographic atau“Slice” anatomy
- Perbedaan densitas
Keterbatasan:
10
Always Thinking Ahead.
10
Always Thinking Ahead.
CT-Scanner Siemens yang pertama
Waktu scan 7 min, matrix gambar 80x80 Pixel, scan field 25 cm, resolusi spatial 1,3 mm (4LP/cm)
SIRETOM (1974)

PT. SIEMENS INDONESIA
(c) Daniel Kartawiguna, 2006 [email protected] 6
11
Always Thinking Ahead.
11
Always Thinking Ahead.
Perkembangan kualitas gambar CTDari tahun 1972 - 2000
SIRETOM (1974)
SOMATOM Plus 4 UFC(1996)
12
Always Thinking Ahead.
12
Always Thinking Ahead.
Ringkasan Sejarah PerkembanganTomografi Komputer1917 J.H. Radon: Transformasi Radon, gambar dari
obyek yang tidak diketahui dapat digambarkan dari proyeksinya.
1963 A.M. Cormack: mengembangkan teknik untukmenentukan distribusi penyerapan tubuh manusia.
1972 G.N. Hounsfield dan J. Ambrose: menghasilkan gambar CT pertama kali untuk keperluan klinis.
1974 60 unit CT terpasang untuk pemeriksaan kepala1975 First whole body scanner in clinical use1979 Hounsfield dan Cormack dianugerahi hadiah Nobel1989 Spiral CT1998 Multislice CT2000 > 30000 clinical CT installations

PT. SIEMENS INDONESIA
(c) Daniel Kartawiguna, 2006 [email protected] 7
13
Always Thinking Ahead.
13
Always Thinking Ahead.
POKOK BAHASAN1.Tomografi Komputer dan Sejarah
Perkembangannya2.Prinsip Tomografi Komputer3.Komponen2 Tomografi Komputer4.Sistem Tomografi Komputer yang
dikembangkan oleh SIEMENS5.Kalibrasi6.Pemeriksaan Kualitas Gambar
14
Always Thinking Ahead.
14
Always Thinking Ahead.
Prinsip Dasar Pemindai Tomografi KomputerPelemahan intensitas sinar-X oleh obyek yang ditembus oleh sinar-X tersebut.
Berkas sinar-X yang menembussuatu obyek akan mengalamipelemahan (kehilangan energi) yang diakibatkan oleh:
Penyerapan oleh obyekPenyebaran
Sinar-X datang Sinar-X Diteruskan
SINARSINAR--X DIHAMBURKANX DIHAMBURKAN
JARINGANTUBUH
Penyerapan oleh jaringan adalah sebanding dengan densitasnya
JaringanDengan
Kepadatanrendah
Jaringandengan
kepadatanyang tinggi
PERLEMAHAN LEBIH BESAR PERLEMAHAN LEBIH KECIL
PT. SIEMENS INDONESIA
(c) Daniel Kartawiguna, 2006 [email protected] 8
15
Always Thinking Ahead.
15
Always Thinking Ahead.
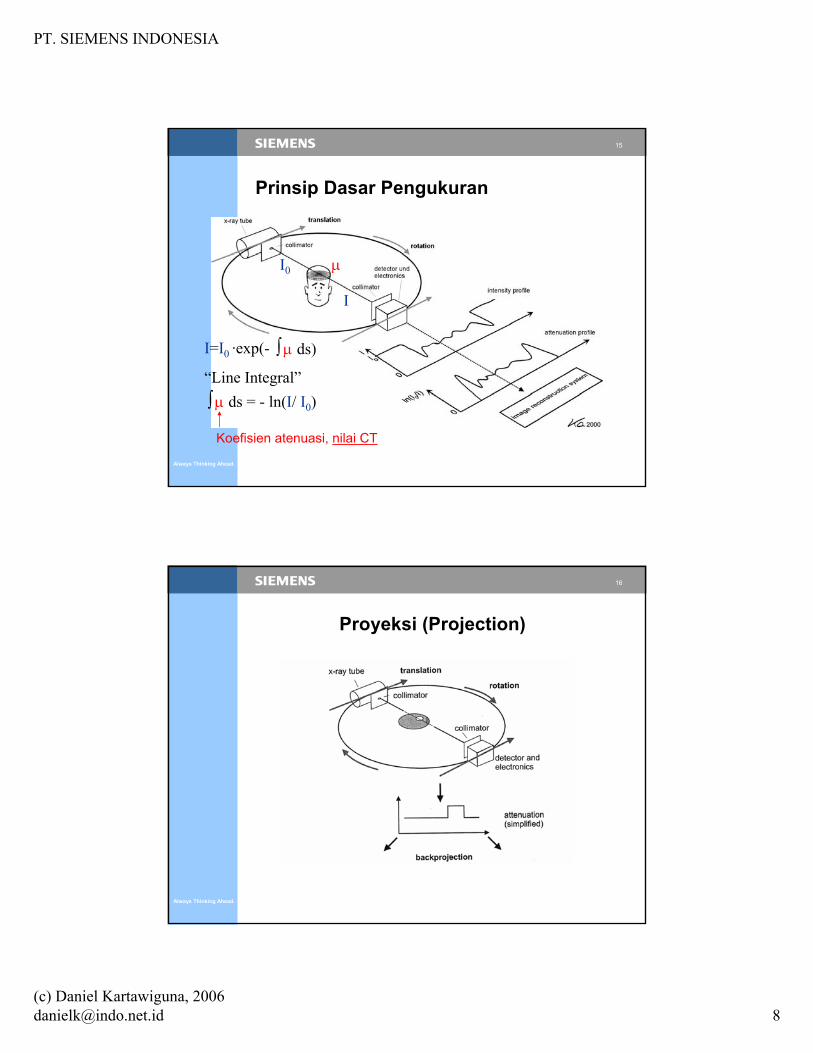
Prinsip Dasar Pengukuran
I=I0 ·exp(- ∫ µ ds)
“Line Integral”∫ µ ds = - ln(I/ I0)
Koefisien atenuasi, nilai CT
Ι0
Ι
µ
16
Always Thinking Ahead.
16
Always Thinking Ahead.
Proyeksi (Projection)
PT. SIEMENS INDONESIA
(c) Daniel Kartawiguna, 2006 [email protected] 9
17
Always Thinking Ahead.
17
Always Thinking Ahead.
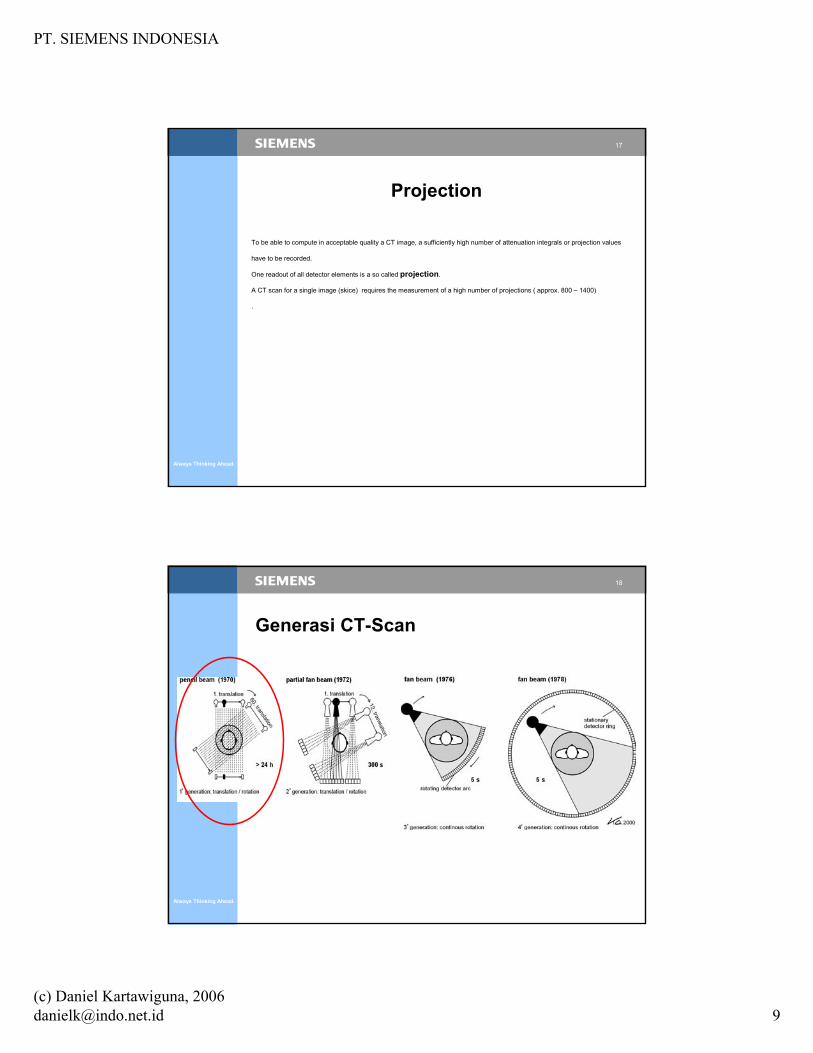
Projection
To be able to compute in acceptable quality a CT image, a sufficiently high number of attenuation integrals or projection values
have to be recorded.
One readout of all detector elements is a so called projection.
A CT scan for a single image (skice) requires the measurement of a high number of projections ( approx. 800 – 1400)
.
18
Always Thinking Ahead.
18
Always Thinking Ahead.
Generasi CT-Scan

PT. SIEMENS INDONESIA
(c) Daniel Kartawiguna, 2006 [email protected] 10
19
Always Thinking Ahead.
19
Always Thinking Ahead.
Prinsip dasar akuisisi data
Parallel beam geometry(1st generation scanner)
Tabung sinar-X
Berkas sinar-X
Detektor sinar-X
Obyek pemeriksaan
20
Always Thinking Ahead.
20
Always Thinking Ahead.
Raw data (Data Mentah)
Sequence ofattenuation profiles
time(projections)
attenuation profile(channels)
1. projection

PT. SIEMENS INDONESIA
(c) Daniel Kartawiguna, 2006 [email protected] 11
21
Always Thinking Ahead.
21
Always Thinking Ahead.
time(projections)
2. projection
attenuation profile(channels)
Raw data (Data Mentah)
Sequence ofattenuation profiles
22
Always Thinking Ahead.
22
Always Thinking Ahead.
time(projections)
Full rotation → CT raw data
attenuation profile(channels)
Raw data (Data Mentah)
Sequence ofattenuation profiles
PT. SIEMENS INDONESIA
(c) Daniel Kartawiguna, 2006 [email protected] 12
23
Always Thinking Ahead.
23
Always Thinking Ahead.
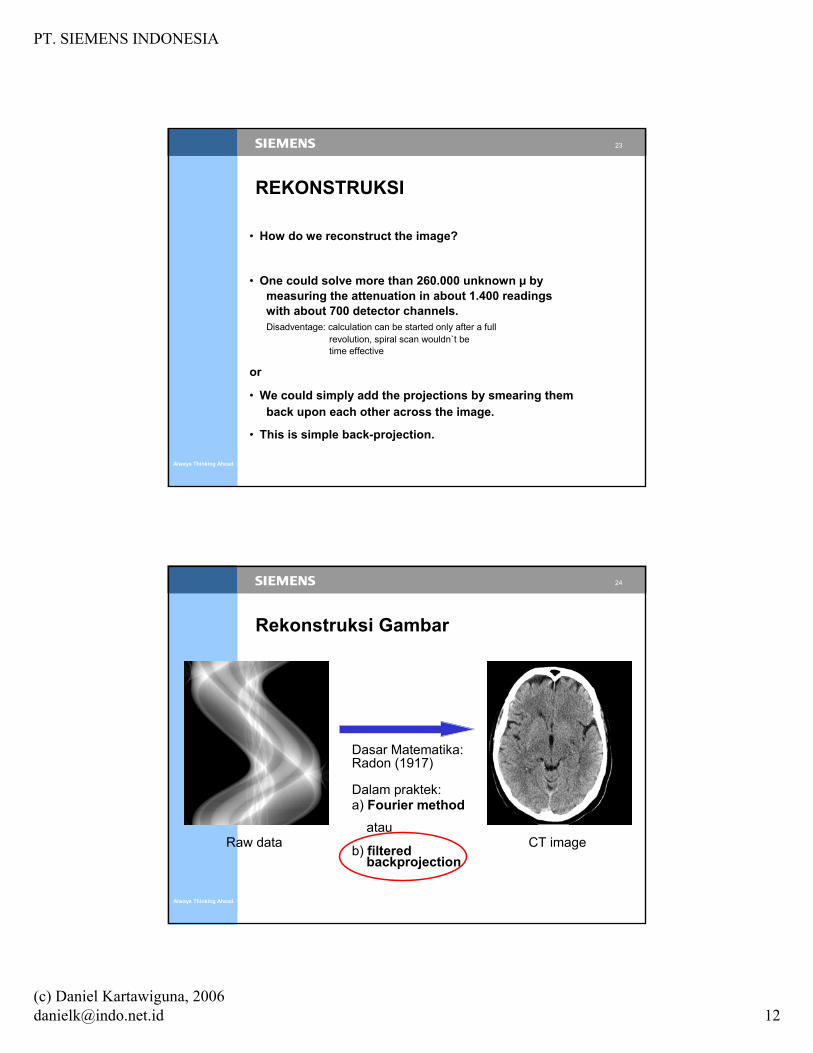
• How do we reconstruct the image?
• One could solve more than 260.000 unknown µ by measuring the attenuation in about 1.400 readingswith about 700 detector channels.Disadventage: calculation can be started only after a full
revolution, spiral scan wouldn`t be time effective
or
• We could simply add the projections by smearing them back upon each other across the image.
• This is simple back-projection.
REKONSTRUKSI
24
Always Thinking Ahead.
24
Always Thinking Ahead.
Rekonstruksi Gambar
Raw data CT image
Dasar Matematika:Radon (1917)
Dalam praktek:a) Fourier method
atau
b) filteredbackprojection

PT. SIEMENS INDONESIA
(c) Daniel Kartawiguna, 2006 [email protected] 13
25
Always Thinking Ahead.
25
Always Thinking Ahead.
Unfiltered Backprojection
Scanned object
Reconstructed object
using projection(s)12348163264128
nice reconstruction,
but not very accurate...
26
Always Thinking Ahead.
26
Always Thinking Ahead.
Solution: Filter
Attenuation profileof a cylinder
Filteredattenuation profile
Filter:convolution kernels

PT. SIEMENS INDONESIA
(c) Daniel Kartawiguna, 2006 [email protected] 14
27
Always Thinking Ahead.
27
Always Thinking Ahead.
Filtered Backprojection
Scanned object This
reconstructionlooks much
better ...
Reconstructed object
using projection(s)12348163264128
28
Always Thinking Ahead.
28
Always Thinking Ahead.
Convolution Kernel
sharp kernel
smooth kernel

PT. SIEMENS INDONESIA
(c) Daniel Kartawiguna, 2006 [email protected] 15
29
Always Thinking Ahead.
29
Always Thinking Ahead.
Convolution kernel
30
Always Thinking Ahead.
30
Always Thinking Ahead.
Convolution kernel
The original profile ( = 1 projection) is multiplicated with the convolution kernel; the result is the concolved projection.
Different convolution kernel provide different image sharpness.
The use of a smoothing kernel reduces the noise in the image and improves low contrast resolution.
The use of an edge enhancing kernel improves high contrast resolution, but increases the noise in the image.

PT. SIEMENS INDONESIA
(c) Daniel Kartawiguna, 2006 [email protected] 16
31
Always Thinking Ahead.
31
Always Thinking Ahead.
Convolution Kernel (lanjutan)
• Ketajaman
• Noise
• Batas
Not independent:sharp image → more noiseless noise → smoother image
Kernel akan menentukan
32
Always Thinking Ahead.
32
Always Thinking Ahead.
Simple back-projection w/o and with convolution

PT. SIEMENS INDONESIA
(c) Daniel Kartawiguna, 2006 [email protected] 17
33
Always Thinking Ahead.
33
Always Thinking Ahead.
Simple back-projection w/o and withconvolution
It is necessary to carry out measurements in all directions, i.e. at least over an angular range of 180 0, and to determine many
narrowly spaced data points for each projection.
For simple backprojection each projection value is added to all the picture elements in the computer memory along the
direction in which it has been measured.
The farreaching signal contributions due to the backprojection process lead to an unsharp image, which is insufficient for the
diagnosis of cpmplex structures.
To avoid this unsharpening each projection has to be convoluted before backprojection with a mathematical function, the
concolution kernel. This constitutes a pointwise multiplication of the convolution kernel and the attenuation profile and addition
of the resulting values. In essence, this represents a high pass filtering procedure which generates over- and undershoots at
object boundaries. For a positive signal, negative undershoots are generated.
Concolution additionally offers the possibility to influence image characteristics by the choice and design of the concolution
kernel – from soft or smoothing to sharp or edge enhancing.
34
Always Thinking Ahead.
34
Always Thinking Ahead.
Perangkat Keras Sistem CT-Scan
Bagian luar...
Konsol
Komputer
Meja
Gantry
Generator• Generator• Konsol• Komputer
• Gantry• Meja

PT. SIEMENS INDONESIA
(c) Daniel Kartawiguna, 2006 [email protected] 18
35
Always Thinking Ahead.
35
Always Thinking Ahead.
Bagian dalam ...
• Tabung
Tabung
Detektor
• Detektor
* Data Acquisitions System (Sistem Akuisisi Data)
DAS• DAS*
Perangkat Keras Sistem CT-Scan
36
Always Thinking Ahead.
36
Always Thinking Ahead.
CARA KERJA PESAWAT CT SCAN
Rekonstruksi + post processingRekonstruksi + post processing
DetektorDetektor
Sumber Radiasi Sinar-XSumber Radiasi Sinar-X

PT. SIEMENS INDONESIA
(c) Daniel Kartawiguna, 2006 [email protected] 19
37
Always Thinking Ahead.
37
Always Thinking Ahead.
Overview over a CT system
Image ProcessingImage Processing
38
Always Thinking Ahead.
38
Always Thinking Ahead.
Overview over a CT systemA modern CT can be divided into three parts:
System Control
Runs the Operating System software (VMS, UNIX or Win NT.)
Runs the Application software to provide a user interface (SOMARIS).
Supports Scan Control by distribution of scan parameters and instructions.
Scan Control
Usually microprocessor based. Directly controls the scanner hardware via firmware routines stored in PROM. It is responsible for the safety of the patient, operator and system hardware. It distributes parameters from the host to the other functional groups in the system. It serves as the interface for all communication between “system control” and the gantry.
Image Processing
This is a specialized array of computers that are responsible for the reception of data from “scan control” and the subsequent reconstruction of an image.

PT. SIEMENS INDONESIA
(c) Daniel Kartawiguna, 2006 [email protected] 20
39
Always Thinking Ahead.
39
Always Thinking Ahead.
Blockdiagram image processor
40
Always Thinking Ahead.
40
Always Thinking Ahead.
Blockdiagram image processor
An image processor consists on 4 functional blocks:
1: Pre- processor
2. Convolver
3. Backprojector
4. Imager
The data measurement system supplies the scan data in serial order to the receiver module, which is a part of the pre-processor.

PT. SIEMENS INDONESIA
(c) Daniel Kartawiguna, 2006 [email protected] 21
41
Always Thinking Ahead.
41
Always Thinking Ahead.
Blockdiagram pre- processor
42
Always Thinking Ahead.
42
Always Thinking Ahead.
Blockdiagram pre- processor
A pre- processor has to compensate the measured data for :
1) Electrical drifts
2) Dose variations
3) X-ray attenuation law
4) Beam hardening
5) Mechanical deviations of the scanning system
The input (measured data from the aquisition system) is called a reading, the output a projection.

PT. SIEMENS INDONESIA
(c) Daniel Kartawiguna, 2006 [email protected] 22
43
Always Thinking Ahead.
43
Always Thinking Ahead.
44
Always Thinking Ahead.
44
Always Thinking Ahead.
PGA decoding
The signals from the detector have a very wide range. To cover the whole dynamic range of input
signals, a
„Programmable Gain Amplifier“ (PGA) is used (also called FPA, floating point amplifier).
PGA: The PPA is an amplifier which selects its gain automatically. The selected gain can be 1, 8 or 64. The gain used is indicated by the two bits called `PGA Bits´.
PGA Decoding:In order to calculate the actual attenuation, the PGA bits are decoded in the SMI. This is done in the preprocessing step „PGA decoding“ (also called „FPA decoding“).
Amplification 64:If the signal from the detector was very small (i.e., high absorption in the scanfield), the amplifier will have used a factor of 64. The resulting data in the SMI will be the 14 bit from theADC, preceeded by many zeroes, in other words, a rather small numerical value.
Amplification 8:If the amplification was 8, the signal was larger. In the SMI, the 14 bit are shifted 3 bitto the left, equaling a multiplication by 8, or a larger numerical value.
Amplifiaction 1: If the signal from the detector was large (e.g., only air in the scanfield), thePGA will have used an amplification of 1. This will result in a large number in the SMI, because the 14 bit are shifted 6 bit to the left, equaling a multiplication by 64 or a rather large numerical value.

PT. SIEMENS INDONESIA
(c) Daniel Kartawiguna, 2006 [email protected] 23
45
Always Thinking Ahead.
45
Always Thinking Ahead.
Offset correction
46
Always Thinking Ahead.
46
Always Thinking Ahead.
Offset correction
Offset voltage :
In the DMS, ADCs are used that can´t measure negative voltages. This would falsify the measurement, if very small detector signals ( = high absorptions ) have to be measured. To avoid this, in the DMS an offset voltage is added to the signal, the signal is measured, and in the SMI the offset signal subtracted again, leaving the true value only.
Offsets are channel specific: Because the analogue offset may be slightlydifferent for each ADC, or, to be precise, even for every integrator board channel, the actual offset has to be measured prior to the scan for every channel.
Offset measurement:With each scan start, a measurement is started without X-ray and the data are stored in the image processor as offset data.

PT. SIEMENS INDONESIA
(c) Daniel Kartawiguna, 2006 [email protected] 24
47
Always Thinking Ahead.
47
Always Thinking Ahead.
Logarithmation
48
Always Thinking Ahead.
48
Always Thinking Ahead.
Logarithmation
Logarithmation is done because the attenuation of an X-ray beam follows an exponential law.
I = Io e - µ d
The calculation of the object attenuation „A“ requires the calculationof the logarithmic value of the measured radiation intensities I and I 0:
A= ln I 0 – ln I
The logarithmation is done using a table of log values.

PT. SIEMENS INDONESIA
(c) Daniel Kartawiguna, 2006 [email protected] 25
49
Always Thinking Ahead.
49
Always Thinking Ahead.
Normalization
50
Always Thinking Ahead.
50
Always Thinking Ahead.
Normalization
During the measurement, the intensity Io of the X-ray beam varies (exaggerated in the picture for clear visualization).
Monitor value: A monitor element measures the unattenuated radiation as a reference value.This value is called “Monitor value”.
Normalization : During the preprocessing step“Normalization” , this monitor value IM is substracted from each channel value I:
In 1/I – In 1/IM

PT. SIEMENS INDONESIA
(c) Daniel Kartawiguna, 2006 [email protected] 26
51
Always Thinking Ahead.
51
Always Thinking Ahead.
Calibration
52
Always Thinking Ahead.
52
Always Thinking Ahead.
Calibration
Each detector has a different sensitivity. This can vary with the time and must be compensated.
The channel specific sensitivity differences are compensated by calibration. Technically, that means taking an air scan and then subtracting the channel values obtained in air from the normalized channel values.
Then pre- processing step calibration requires the base calibration tables, that are measured during the last calibration.
During the last tune up, the differences of each combination of kV, mA, slice width etc. were measured, so that only the base calibration is required on a daily basis.
The other calibration tables for different settings of kV, mA etc are calculated from the difference tables and the base calibration table.
PT. SIEMENS INDONESIA
(c) Daniel Kartawiguna, 2006 [email protected] 27
53
Always Thinking Ahead.
53
Always Thinking Ahead.
Channel Correction
54
Always Thinking Ahead.
54
Always Thinking Ahead.
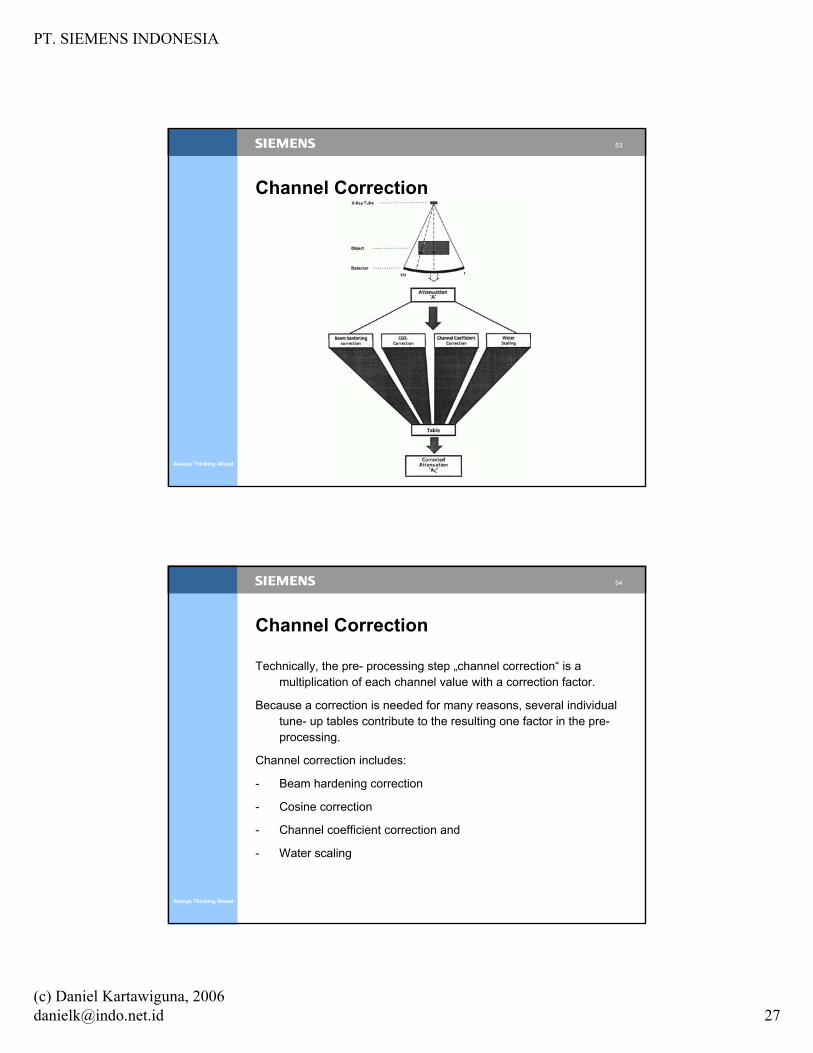
Channel Correction
Technically, the pre- processing step „channel correction“ is a multiplication of each channel value with a correction factor.
Because a correction is needed for many reasons, several individual tune- up tables contribute to the resulting one factor in the pre-processing.
Channel correction includes:
- Beam hardening correction
- Cosine correction
- Channel coefficient correction and
- Water scaling

PT. SIEMENS INDONESIA
(c) Daniel Kartawiguna, 2006 [email protected] 28
55
Always Thinking Ahead.
55
Always Thinking Ahead.
Beam – Hardening Correction
56
Always Thinking Ahead.
56
Always Thinking Ahead.
Beam – Hardening Correction
X-ray spectrum:
Tubes generate polychromatic radiation, i.e.different wavelength are contained in the spectrum.
Just as with visible light, the higher energies or shorter wavelength can penetrate the objects better than the softer part of the spectrum.
Beam hardening causes in homogenous objects (e.g. a water phantom) an inhomogeneity. That means, the CT values in the center are different from the outer values.
The correction is done by taking data of a reference phantom (mostly a 20cm water phantom) and the correction data are used during pre- processing step „beam hardening“ for the correction of the scan data.
PT. SIEMENS INDONESIA
(c) Daniel Kartawiguna, 2006 [email protected] 29
57
Always Thinking Ahead.
57
Always Thinking Ahead.
Cosine - Correction
58
Always Thinking Ahead.
58
Always Thinking Ahead.
Cosine - Correction
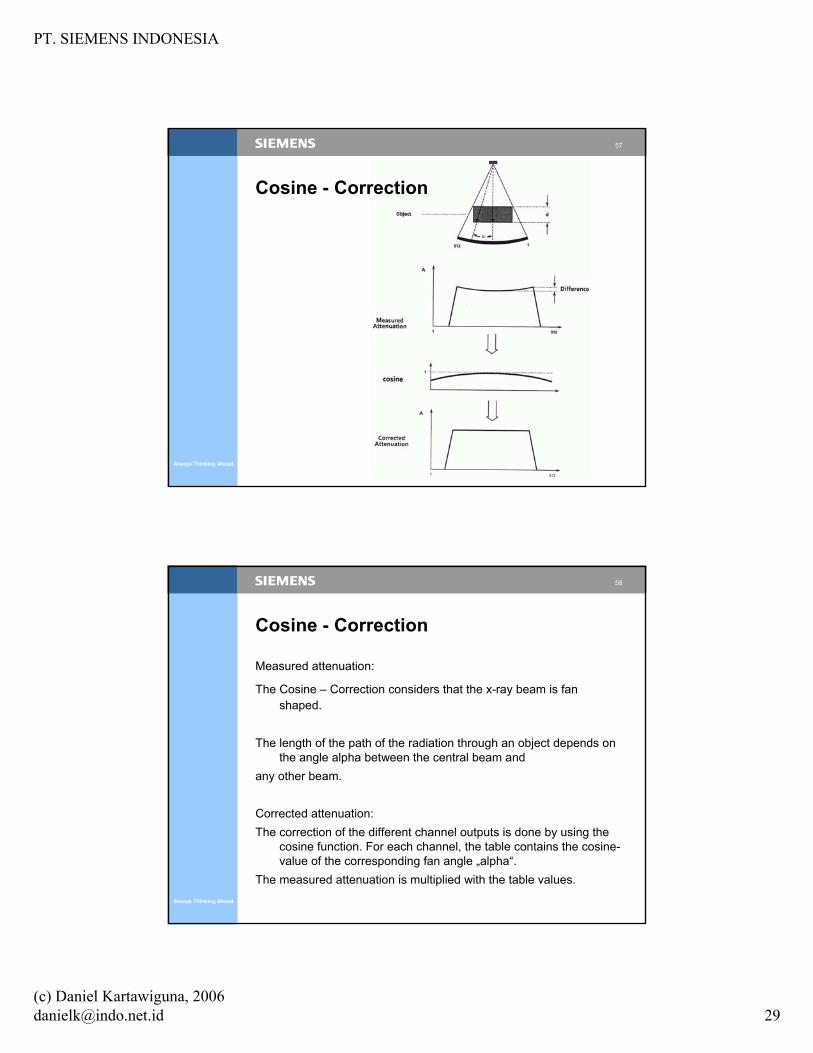
Measured attenuation:
The Cosine – Correction considers that the x-ray beam is fan shaped.
The length of the path of the radiation through an object depends on the angle alpha between the central beam and
any other beam.
Corrected attenuation:The correction of the different channel outputs is done by using the
cosine function. For each channel, the table contains the cosine-value of the corresponding fan angle „alpha“.
The measured attenuation is multiplied with the table values.

PT. SIEMENS INDONESIA
(c) Daniel Kartawiguna, 2006 [email protected] 30
59
Always Thinking Ahead.
59
Always Thinking Ahead.
Channel Coefficient Correction
60
Always Thinking Ahead.
60
Always Thinking Ahead.
Channel Coefficient Correction
Just like „Calibration“, the pre-processing step ´Channel Correction´compensates for sensitivity differences of the detector. The difference is that the Channel correction compensates for nonlinearities in the area of attenuated radiation, i.e., with an object is in the scan field.
Parameter:The parameters which determine the detected radiation energy are:
Tube VoltageSlice ThicknessObject Attenuation (Head or body)
Correction tables:The sensitivity compensation is done with values which are determined
during the tune-up.

PT. SIEMENS INDONESIA
(c) Daniel Kartawiguna, 2006 [email protected] 31
61
Always Thinking Ahead.
61
Always Thinking Ahead.
Water Scaling
62
Always Thinking Ahead.
62
Always Thinking Ahead.
Water Scaling
The water scaling sets CT value of water to 0 HU.
This factor depends on the energy received by the detector; the parameters for the scaling are:
- tube voltage- tube current- slice thickness

PT. SIEMENS INDONESIA
(c) Daniel Kartawiguna, 2006 [email protected] 32
63
Always Thinking Ahead.
63
Always Thinking Ahead.
Generasi Tomografi Komputer
“Generasi” digunakan untuk membedakan rancangankonfigurasi tabung-detektor pada CT.
64
Always Thinking Ahead.
64
Always Thinking Ahead.
Generasi ke-1: Pencil Beam

PT. SIEMENS INDONESIA
(c) Daniel Kartawiguna, 2006 [email protected] 33
65
Always Thinking Ahead.
65
Always Thinking Ahead.
Generasi ke-1
• Gerakan translasi dan rotasi• Berkas sinar-X berbentuk pensil (pencil beam)• Geometri berkas sinar paralel.• FOV (field of view) 24 cm.• Menggunakan 2 buah detektor sehingga sekali scan dapat
menghasilkan 2 irisan.• 160 berkas paralel/proyeksi.• 180 proyeksi dengan interval 1 derajat.• Detektor tidak dapat mendeteksi perbedaan intensitas sinar-X
yang sangat besar, oleh karena itu kepala yang diperiksa harusdikelilingi oleh kantong berisi air.
• Kristal NaI yang digunakan sebagai detektor memiliki waktu“afterglow” yang nyata.
• Keuntungan: pengaruh hamburan radiasi pada detektorditiadakan karena berkas sinar-X yang berbentuk pensil.
66
Always Thinking Ahead.
66
Always Thinking Ahead.
Generasi ke-2: Partial Fan Beam

PT. SIEMENS INDONESIA
(c) Daniel Kartawiguna, 2006 [email protected] 34
67
Always Thinking Ahead.
67
Always Thinking Ahead.
Generasi ke-2
• Menggunakan 30 linear array detector.• Kerugian: adanya pengaruh radiasi hamburan dan
meningkatnya intensitas kearah tepi dari berkas sinar-X yang berbentuk kipas. Hal ini diatasi dengan penambahanfilter dasi kupu-kupu pada jendela tabung sinar-X.
• Keuntungan: waktu scan lebih singkat, yaitu antara 18 hingga 30 detik/irisan.
68
Always Thinking Ahead.
68
Always Thinking Ahead.
Generasi ke-3: Fan Beam

PT. SIEMENS INDONESIA
(c) Daniel Kartawiguna, 2006 [email protected] 35
69
Always Thinking Ahead.
69
Always Thinking Ahead.
Konstruksi CT Generasi ke-3
70
Always Thinking Ahead.
70
Always Thinking Ahead.
Generasi ke-3: Rotasi/Rotasi, Fan Beam
• Konfigurasi rotasi/rotasi.• Berkas sinar-x berbentuk kipas (fan beam).• Menggunakan detektor array.• Waktu scan 1 detik.• Kekurangan: kemungkinan terjadinya ring artefact karena
adanya kerusakan kanal detektor.

PT. SIEMENS INDONESIA
(c) Daniel Kartawiguna, 2006 [email protected] 36
71
Always Thinking Ahead.
71
Always Thinking Ahead.
Generasi ke-4: Fan Beam + Detector Ring
72
Always Thinking Ahead.
72
Always Thinking Ahead.
Generasi ke-4: Rotasi/Diam
• Tabung sinar-X berputar dan detektor diam.• Detektor tersusun melingkar berbentuk lingkaran. • Sekitar 8000 buah detektor diperlukan.• Waktu scan 1 detik.• Kerugian: harga mahal, dosis radiasi pada pasien lebih
tinggi.• Keuntungan: tidak terjadi ring artefact.• Masalah: jarak antara tabung sinar-X dan elemen detektor
tidak semuanya sama -> diatasi dengan kalibrasi dannormalisasi saat scan.

PT. SIEMENS INDONESIA
(c) Daniel Kartawiguna, 2006 [email protected] 37
73
Always Thinking Ahead.
73
Always Thinking Ahead.
Generasi ke-5: Electron Beam Technique
Electron Beam Computed Tomography Scanner, waktu scan 50msDigunakan untuk scan jantung.
74
Always Thinking Ahead.
74
Always Thinking Ahead.
EBT Electron Beam TechniqueIn a conventional CT scanner, the x-ray tube moves round the patient, the x-ray beam is attenuated by the patient and the differences of the emergent beam are registered by a bank of detectors. This information is digitised and converted into a cross-sectional image. The exposure time for each slice is restricted by the time it takes physically to move the x-ray tube.
The Imatron CT Scanner has no x-ray tube but an electron gun which produces a beam of electrons at 130kV which is accelerated along a tube. The beam of electrons is focused, by an electro-magnetic coil, onto a small focal spot on a tungsten ring. This target area is then moved along the ring.
The x-rays are generated by this deceleration process and collimators define them into a fan-beam which ‘sweeps’ the patient. The x-ray density differences are registered by a bank of solid-state detectors and the output is digitised by the Data Acquisition System. Data is stored in the bulk memoryand the transferred to disc storage which is then converted into a cross-sectional image. There are no moving parts therefore exposure times can be reduced to 50ms per slice. Up to 17 slices per second can be taken, enabling the CT Scanner Unit to image moving structures such as the heart.

PT. SIEMENS INDONESIA
(c) Daniel Kartawiguna, 2006 [email protected] 38
75
Always Thinking Ahead.
75
Always Thinking Ahead.
EBT Electron Beam Technique 2
76
Always Thinking Ahead.
76
Always Thinking Ahead.
EBT Electron Beam Technique 3
Front
view
Side
view

PT. SIEMENS INDONESIA
(c) Daniel Kartawiguna, 2006 [email protected] 39
77
Always Thinking Ahead.
77
Always Thinking Ahead.
Generasi ke-6: Spiral atau Helical CT
• Teknologi Slip-Ring sekitar tahun 1990-an.• Akuisisi data dilakukan dengan meja yang bergerak
sementara tabung sinar-X berputar sehingga gerakantabung sinar-X membentuk pola spiral terhadap pasiensaat dilakukan akuisisi data.
• Diterapkan pada konfigurasi rancangan CT generasi ke-3 dan ke-4.
78
Always Thinking Ahead.
78
Always Thinking Ahead.
Teknologi Slip-ringAliran listrik disalurkan melalui sejumlah konduktorberbentuk cincin yang disusun secara paralel, sehingga tidak menggunakan kabel lagi.
Rotasi Gantry yang kontinuMerupakan syarat untuk CT-Scan spiral/helical
Non SlipNon Slip--ring ring ScannerScanner
SlipSlip--ring Scannerring Scanner

PT. SIEMENS INDONESIA
(c) Daniel Kartawiguna, 2006 [email protected] 40
79
Always Thinking Ahead.
79
Always Thinking Ahead.
Apakah yang dimaksud dengan “Spiral Scan” ? --
jawaban 4“C”
Continuously rotating tube/detector system
Continuously generating X-ray
Continuously table feed
Continuously data acquisition
CT Spiral dikelompokkan ke dalam CT generasi ke-6.
80
Always Thinking Ahead.
80
Always Thinking Ahead.
Memungkinkan rekonstruksigambar pada sembarang posisi(baik berurutan atau tumpangtindih) dalam daerah volum yang di-scan.
Jarak antar irisan disebutdengan “Increment”
A BVolum Data
Akuisisi Data secara kontinu

PT. SIEMENS INDONESIA
(c) Daniel Kartawiguna, 2006 [email protected] 41
81
Always Thinking Ahead.
81
Always Thinking Ahead.
{Increment
}Tebal Irisan
Increment = Increment = TebalTebal IrisanIrisanTidakTidak adaada tumpangtumpang tindihtindihTidakTidak adaada selasela
Rekonstruksi Gambar Secara Berurutan
82
Always Thinking Ahead.
82
Always Thinking Ahead.
{Increment
}
}}Overlap
}SliceThickness
Rekonstruksi Gambar secara TumpangTindih
Increment < Slice ThicknessIncrement < Slice ThicknessOverlap of slicesOverlap of slicesCloser image intervalCloser image intervalMore images createdMore images created

PT. SIEMENS INDONESIA
(c) Daniel Kartawiguna, 2006 [email protected] 42
83
Always Thinking Ahead.
83
Always Thinking Ahead.
Increment > Slice ThicknessIncrement > Slice ThicknessSelaSela antaraantara 2 2 potonganpotonganImages are further apartImages are further apartJumlahJumlah gambargambar yang yang lebihlebih sedikitsedikit..
Rekonstruksi Gambar dengan Antara/Sela
{Increment
}Slice Thickness
84
Always Thinking Ahead.
84
Always Thinking Ahead.
Standard CT / Slice ImagingStandard CT / Slice ImagingDeep InspirationDeep Inspiration Shallow InspirationShallow Inspiration
MisregistrationMisregistration due to differentdue to differentrespiratory levels between slicesrespiratory levels between slices
Partial Volume EffectPartial Volume Effect
Unable to Unable to resconstructresconstruct images atimages atarbitrary positionarbitrary position
Slice imaging is slowSlice imaging is slow

PT. SIEMENS INDONESIA
(c) Daniel Kartawiguna, 2006 [email protected] 43
85
Always Thinking Ahead.
85
Always Thinking Ahead.
Scan the whole region of Scan the whole region of interest in one breath hold interest in one breath hold
Reconstruction of overlapping Reconstruction of overlapping images without additional doseimages without additional dose
Retrospective reconstruction Retrospective reconstruction of slices in arbitrary position of slices in arbitrary position within the scanned volumewithin the scanned volume
No gaps since radiation alwaysNo gaps since radiation alwaystransmits the whole volumetransmits the whole volume
Spiral CT / Volume ImagingSpiral CT / Volume Imaging
86
Always Thinking Ahead.
86
Always Thinking Ahead.
Kuntungan Spiral CT
Melakukan scan satu bagian volume dengansekali tahan nafas.
Mengurangi efek partial volume.
Tidak ada celah.
Rekonstruksi gambar secara tumpang tindihdapat dilakukan tanpa tambahan dosis radiasi.
Meningkatkan kualitas data untuk keperluanrekonstruksi 3D (3D-rendering)
PT. SIEMENS INDONESIA
(c) Daniel Kartawiguna, 2006 [email protected] 44
87
Always Thinking Ahead.
87
Always Thinking Ahead.
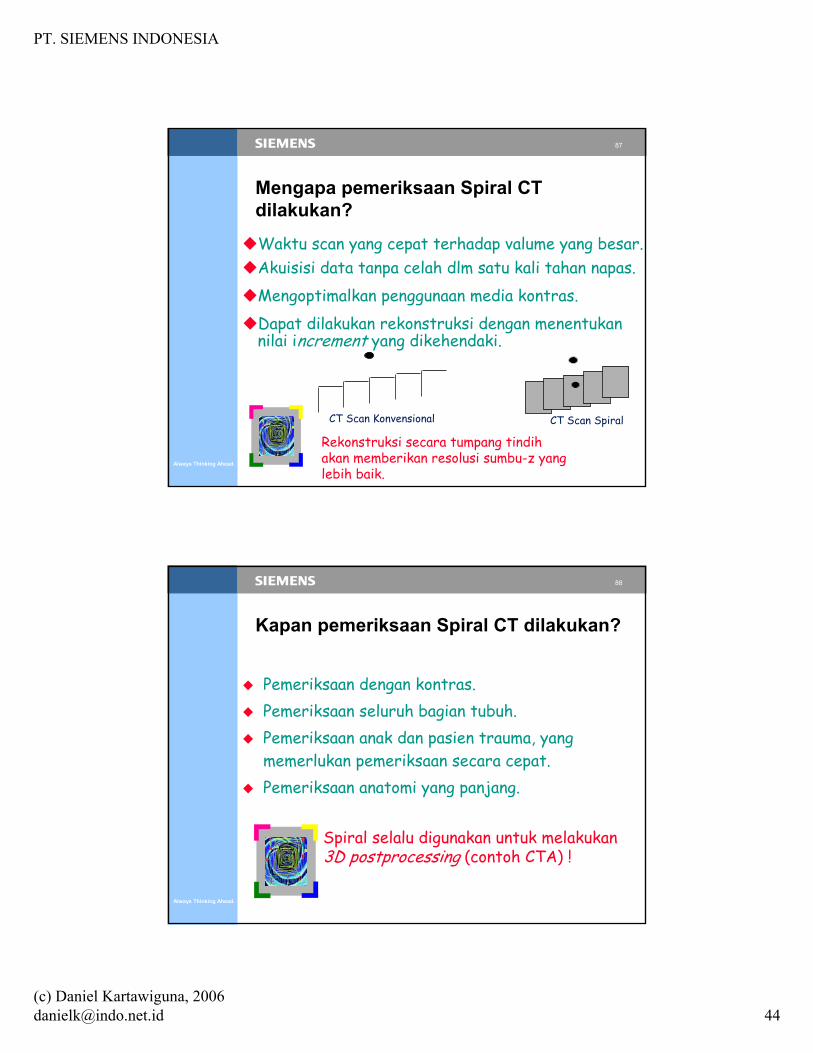
Mengapa pemeriksaan Spiral CT dilakukan?
Rekonstruksi secara tumpang tindihakan memberikan resolusi sumbu-z yang lebih baik.
CT Scan SpiralCT Scan Konvensional
Akuisisi data tanpa celah dlm satu kali tahan napas.Waktu scan yang cepat terhadap valume yang besar.
Mengoptimalkan penggunaan media kontras.Dapat dilakukan rekonstruksi dengan menentukannilai increment yang dikehendaki.
88
Always Thinking Ahead.
88
Always Thinking Ahead.
Kapan pemeriksaan Spiral CT dilakukan?
Pemeriksaan dengan kontras.Pemeriksaan seluruh bagian tubuh. Pemeriksaan anak dan pasien trauma, yang memerlukan pemeriksaan secara cepat.Pemeriksaan anatomi yang panjang.
Spiral selalu digunakan untuk melakukan3D postprocessing (contoh CTA) !
PT. SIEMENS INDONESIA
(c) Daniel Kartawiguna, 2006 [email protected] 45
89
Always Thinking Ahead.
89
Always Thinking Ahead.
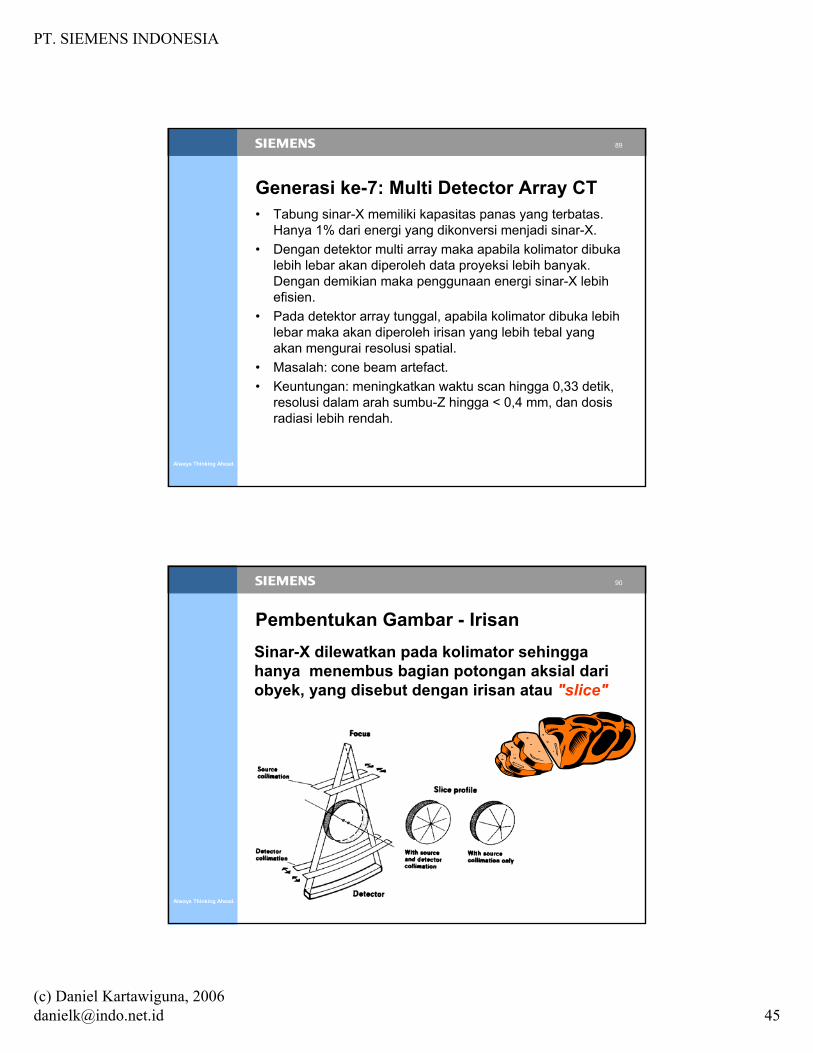
Generasi ke-7: Multi Detector Array CT• Tabung sinar-X memiliki kapasitas panas yang terbatas.
Hanya 1% dari energi yang dikonversi menjadi sinar-X.• Dengan detektor multi array maka apabila kolimator dibuka
lebih lebar akan diperoleh data proyeksi lebih banyak. Dengan demikian maka penggunaan energi sinar-X lebihefisien.
• Pada detektor array tunggal, apabila kolimator dibuka lebihlebar maka akan diperoleh irisan yang lebih tebal yang akan mengurai resolusi spatial.
• Masalah: cone beam artefact.• Keuntungan: meningkatkan waktu scan hingga 0,33 detik,
resolusi dalam arah sumbu-Z hingga < 0,4 mm, dan dosisradiasi lebih rendah.
90
Always Thinking Ahead.
90
Always Thinking Ahead.
Pembentukan Gambar - IrisanSinar-X dilewatkan pada kolimator sehinggahanya menembus bagian potongan aksial dariobyek, yang disebut dengan irisan atau "slice"

PT. SIEMENS INDONESIA
(c) Daniel Kartawiguna, 2006 [email protected] 46
91
Always Thinking Ahead.
91
Always Thinking Ahead.
Image Generation - „The Slice“
The geometry of a slice -
Imagine a line emanating from the top center of one’s head and extending through the body toward the feet. This is known as the “long axis” of the body (like a chicken on a rotisserie). When speaking of scanner geometry, the long axis of the patient is aligned to the “Z” axis of the gantry. It is shown as going into the gantry, the same direction as table feed.The picture above also shows that the X-ray source and detector system rotate around this same Z axis. The slice shown then represents a “transaxial” section, that is perpendicular to the long axis.
92
Always Thinking Ahead.
92
Always Thinking Ahead.
Patient Orientation
Z = caudo-cranial
X = left-right
Y = posterior-anterior

PT. SIEMENS INDONESIA
(c) Daniel Kartawiguna, 2006 [email protected] 47
93
Always Thinking Ahead.
93
Always Thinking Ahead.
Patient Orientation
Scanner Geometry
All the directions in a CT scanner follow a medical coordinate system rather than a mathematical one.
94
Always Thinking Ahead.
94
Always Thinking Ahead.
Irisan dari suatu obyekterbagi dalam elemenvolum yang kecil yang disebut dengan“voxels”.
Masing2 voxel memilikisuatu nilai tertentuyang menyatakanatenuasi rata-rata sinar-X oleh obyekpada posisi tersebut.
Elemen gambar dalambidang 2 dimensi disebut“pixels”
Pembentukan Gambar - “Voxel”
Nilai tersebut dikenaldengan namaHoundsfield Unit.

PT. SIEMENS INDONESIA
(c) Daniel Kartawiguna, 2006 [email protected] 48
95
Always Thinking Ahead.
95
Always Thinking Ahead.
Image Generation - The Voxel
About the VOXEL or Volume Element...
A voxel is an “intangible object”. The operator of the CT has some control over its size, yet never really thinks about. The width of a single detector element plays a primary role in setting the “face” dimensions (length and width) of a voxel. But a voxel is three dimensional, so it also has depth which runs in the direction of the “Z” plane. This dimension is determined by the thickness of the chosen slice - typically a whole number between 1 to 10 mm. This is selected by the operator. In theory, we can calculate the attenuation of the X-ray beam by a single voxel. This is carried out by making many measurements at different angular positions around the object. The “Image Processor” will take this information and process it further until it has a single numerical value that represents the density of a tiny piece of the object scanned. It then assigns a luminance value and position of where this data is to be deposited in an “image matrix”.
96
Always Thinking Ahead.
96
Always Thinking Ahead.
CT imageCT image

PT. SIEMENS INDONESIA
(c) Daniel Kartawiguna, 2006 [email protected] 49
97
Always Thinking Ahead.
97
Always Thinking Ahead.
CT image
CT = Computed tomography - perception in slices.
CT provides transverse slice images of the human body in digital form.
A coordinate system then results which basically conforms to the anatomical main axes and planes.
One volume part of the reconstructed image ( = voxel) is represented by the pixel size in (x, y)-plane and
the slice thickness (s) in z-axis.
CT image
98
Always Thinking Ahead.
98
Always Thinking Ahead.
Bilangan CT
I=I0 ·exp(- ∫ µ ds)
“Line Integral”∫ µ ds = - ln(I/ I0)
Koefisien atenuasi, nilai CT
Ι0
Ι
µ

PT. SIEMENS INDONESIA
(c) Daniel Kartawiguna, 2006 [email protected] 50
99
Always Thinking Ahead.
99
Always Thinking Ahead.
Dari µ ke Bilangan CT (CT number)
The distribution of µ was originally measured.
To get rid from the energy dependency of the linear attenuation coefficient, one takes
the adventage that most of the coefficients for different tissues show the same relative
dependence from energy.
S‘o a quotient of the 2 coefficients of 2 tissues should be energy independent in first
order.
Mr. Hounsfield had the great idea to scale the µ values relative to water by
CT number = µtissue - µwater
µwater
X 1000
100
Always Thinking Ahead.
100
Always Thinking Ahead.
Houndsfield Unit
Houndsfield Unit didefinisikan :
1000×−
=wat
watobjHUµ
µµ
HU = Houndsfield Unit (-1000 HU sampai +3000 HU)µobj = koefisien pelemahan objekµwat = koefisien pelemahan air

PT. SIEMENS INDONESIA
(c) Daniel Kartawiguna, 2006 [email protected] 51
101
Always Thinking Ahead.
101
Always Thinking Ahead.
CT numbers
•Water has CT number 0
•tissues more dense than water have a positive CT number
•tissues less dense than water have a negative CT number.
Water = 0 HU
Bone = +3000 HU
Air = - 1000 HU
Ct numbers
102
Always Thinking Ahead.
102
Always Thinking Ahead.
Houndsfield Unit
Water
Mamma
Air
Bone
Spleen
Fat
Pancreas
Lung
Kidneys
AdrenalGland
Blood
Heart
Liver
Intestine
Tumor
Bladder
3000
60
40
0
-100
-200
-900-1000
HU *
Rule of thumb: Nilai CT air adalah 0 dan udara1000. The relative values of the other tissues are calculated relative to that of water
Rule of thumb: Nilai CT air adalah 0 dan udara1000. The relative values of the other tissues are calculated relative to that of water
HU = Hounsfield Unit, also known as CT number

PT. SIEMENS INDONESIA
(c) Daniel Kartawiguna, 2006 [email protected] 52
103
Always Thinking Ahead.
103
Always Thinking Ahead.
CT number flexibility
• We can change the appearance of the image by varying thewindow width and level.
• This can spread a small range of CT numbers over a larger range of grey scale values.
• This makes it easy to detect very small changes in CT number.
CT number flexibility
104
Always Thinking Ahead.
104
Always Thinking Ahead.
Pembentukan Gambar - “Matrix”
35 36 3934 3331 34 33 35 3231 80 85 9078
Nilai koefisien pelemahan radiasi diukur kemudiandikodekan dan ditransfer ke komputer.Oleh komputer akan ditampilkan dalam gambar 2 dimensi yang disebut dengan matriks.
Ukuran matriks gambar : 80x80, 256x256, 512x512

PT. SIEMENS INDONESIA
(c) Daniel Kartawiguna, 2006 [email protected] 53
105
Always Thinking Ahead.
105
Always Thinking Ahead.
Image Generation - The Matrix
Image Processing -
This illustration implies the metamorphosis of a voxelinto a pixel. It starts out as a three dimensional volume of matter. We measure it’s ability to attenuate X-ray. This information then is sent to a special computer where it is processed along with other data and becomes a “number” that will specify a “light intensity”or luminance value on a CRT display. The area that is filled by this “light” is known as a pixel and it has only two dimensions - length and width. A group of pixels placed in a specific order, side by side, result in the image that we see it displayed on the monitor.
106
Always Thinking Ahead.
106
Always Thinking Ahead.
Pembentukan Gambar - A>D>A*
Nilai masing2 elemn matriks dikonversikan kedalamgambar hitam putih sesuai dengan grey scale-nya.
35 36 3934 3331 3433 35 3231 80 85 9078
*Analog - Digital - Analog
PT. SIEMENS INDONESIA
(c) Daniel Kartawiguna, 2006 [email protected] 54
107
Always Thinking Ahead.
107
Always Thinking Ahead.
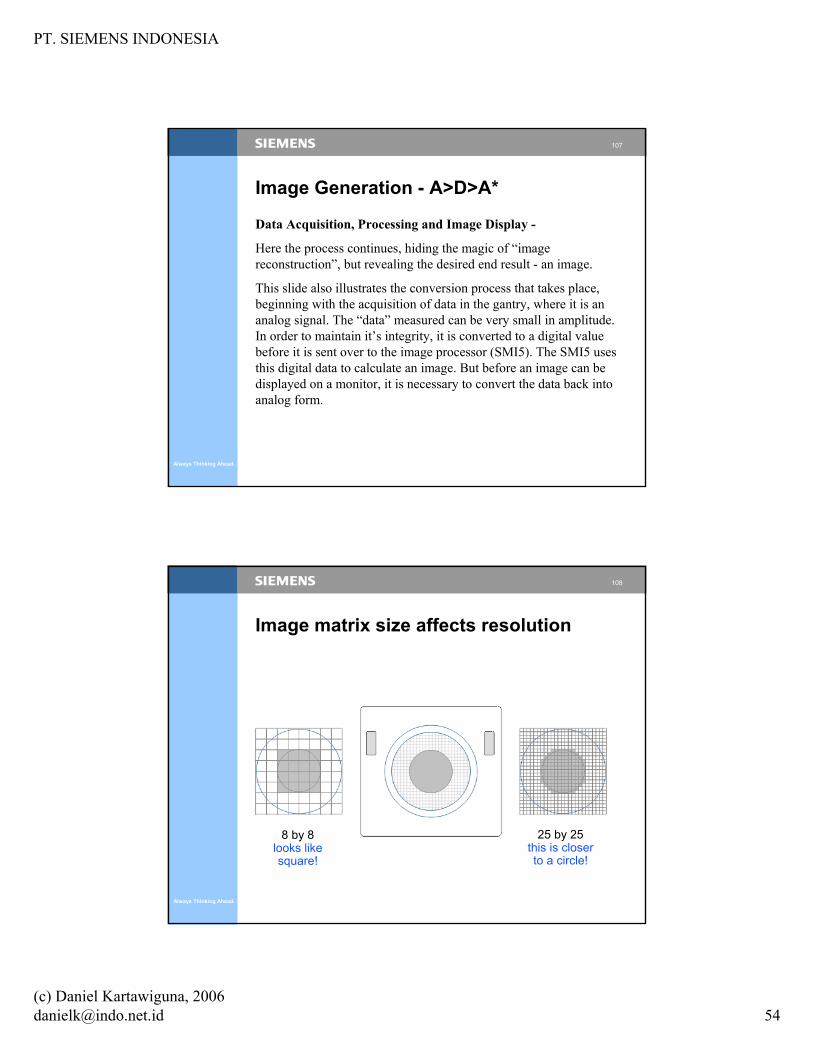
Image Generation - A>D>A*
Data Acquisition, Processing and Image Display -
Here the process continues, hiding the magic of “image reconstruction”, but revealing the desired end result - an image.
This slide also illustrates the conversion process that takes place, beginning with the acquisition of data in the gantry, where it is an analog signal. The “data” measured can be very small in amplitude. In order to maintain it’s integrity, it is converted to a digital value before it is sent over to the image processor (SMI5). The SMI5 uses this digital data to calculate an image. But before an image can be displayed on a monitor, it is necessary to convert the data back into analog form.
108
Always Thinking Ahead.
108
Always Thinking Ahead.
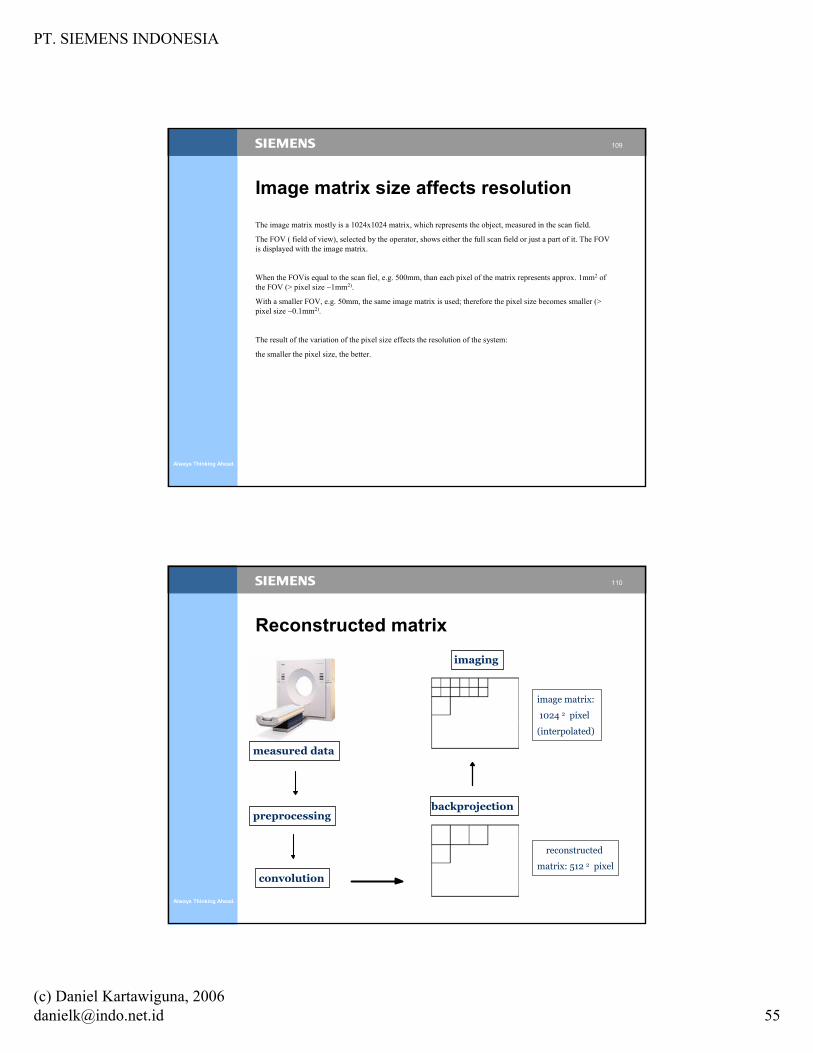
Image matrix size affects resolution
8 by 8looks likesquare!
25 by 25this is closerto a circle!
PT. SIEMENS INDONESIA
(c) Daniel Kartawiguna, 2006 [email protected] 55
109
Always Thinking Ahead.
109
Always Thinking Ahead.
Image matrix size affects resolution
The image matrix mostly is a 1024x1024 matrix, which represents the object, measured in the scan field.
The FOV ( field of view), selected by the operator, shows either the full scan field or just a part of it. The FOV is displayed with the image matrix.
When the FOVis equal to the scan fiel, e.g. 500mm, than each pixel of the matrix represents approx. 1mm2 of the FOV (> pixel size ~1mm2).
With a smaller FOV, e.g. 50mm, the same image matrix is used; therefore the pixel size becomes smaller (> pixel size ~0.1mm2).
The result of the variation of the pixel size effects the resolution of the system:
the smaller the pixel size, the better.
110
Always Thinking Ahead.
110
Always Thinking Ahead.
Reconstructed matrix
measured data
preprocessing
convolution
backprojection
reconstructed
matrix: 512 2 pixel
imaging
image matrix:
1024 2 pixel
(interpolated)

PT. SIEMENS INDONESIA
(c) Daniel Kartawiguna, 2006 [email protected] 56
111
Always Thinking Ahead.
111
Always Thinking Ahead.
Reconstructed matrix
The image processor writes all backprojected data into a 5122 matrix, which is the so called reconstructed matrix.
It is on most CT- system a 5122 matrix.
The pixel size, mentioned on previous page, is a function of the reconstructed matrix.
The imager, responsible for windowing and calculation of HU values, is supplied from the backprojector with the 5122 reconstructed matrix.
A linear interpolation from 5122 to 10242 pixels is done, before the digital data of the matrix are converted to analog and connected as RGB to the monitor.
112
Always Thinking Ahead.
112
Always Thinking Ahead.
Displayed matrix
imaging
image matrix:
1024 2 pixel
(interpolated)
PT. SIEMENS INDONESIA
(c) Daniel Kartawiguna, 2006 [email protected] 57
113
Always Thinking Ahead.
113
Always Thinking Ahead.
Displayed matrix
The displayed matrix is on most CT systems a 10242 interpolated matrix.
There are some systems working with smaller matrix sizes like 5122 or 3602, especially economic systems, to keep the price low.
114
Always Thinking Ahead.
114
Always Thinking Ahead.
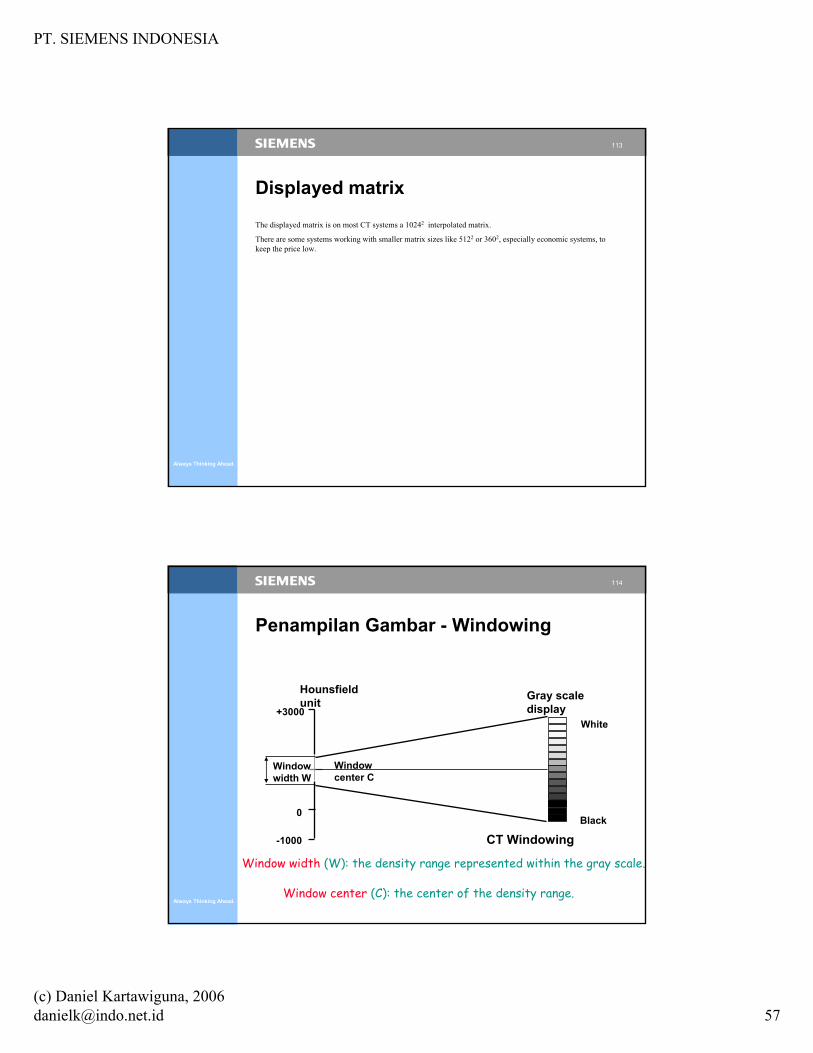
Penampilan Gambar - Windowing
Window width (W): the density range represented within the gray scale.
Window center (C): the center of the density range.
Hounsfieldunit
+3000
-1000
0
Window width W
Window center C
Gray scaledisplay
White
Black
CT Windowing

PT. SIEMENS INDONESIA
(c) Daniel Kartawiguna, 2006 [email protected] 58
115
Always Thinking Ahead.
115
Always Thinking Ahead.
Image Display - WindowingClose the window - I can’t see anything...
The human eye can only resolve about 40 shades of gray at best. The human body is made up of tissue containing mostly water, but also calcium, phosphorous, as well as other minerals. However, all soft tissue is not the same, even though it consists of the same basic building blocks. There is a difference in density between muscle and the liver, for example. The same goes for bone - you have a variety of bone density in your body from the cartilage in your nose to the calcium rich bone of your pelvis. All of these organs attenuate X-rays differently, so they appear to us as different gray levels in the reconstructed image. Remember, each shade or intensity value correlates to how effectively an object attenuates X-rays. Bright white means a very effective attenuater, such as dense bone. Black means the opposite or virtually no attenuation, such as air.
Our image display system is designed to display no more than 256 gray shades at one time, but the HU scale extends from -1000 to 3096 or 4096 values in total! You could say that each value corresponds to a unique intensity or “gray level”. When a doctor is looking for details in the liver, he may be looking for small density changes. In order to see these small changes, we use a device called “windowing”. Since the liver only represents a very small portion of the HU scale, we choose a “center value” that corresponds to about the mean value of that organ and “open” the window just enough to see the desired detail. The maximum number of gray shades will not exceed 256 regardless of the window setting!
116
Always Thinking Ahead.
116
Always Thinking Ahead.
Pengaruh Windowing pada gambarNilai densitas CT didefinisikan berkisar antara -1000 hingga +3000, tetapi mata manusia paling baik hanya dapatmembedakan 30 - 40 tingkat terang gelap saja.
Dengan demikian pengatruan pilihan windwosharus disesuaikan dengan struktur yang akandilihat.
Lung Window Mediastinum Window

PT. SIEMENS INDONESIA
(c) Daniel Kartawiguna, 2006 [email protected] 59
117
Always Thinking Ahead.
117
Always Thinking Ahead.
Image Display - Windowing
Lung Window Mediastinum Window
Narrow Window Width Broad Window Width
Lebar window Sempit : Gambar memiliki tingkat kontrasyang baik, tetapi struktur diluardaerah window tidak terlihatdengan jelas.
Lebar window Luas : Perbedaan densitas yang kecil akan nampak homogendan mungkin akantersamar/tidak terlihat.
118
Always Thinking Ahead.
118
Always Thinking Ahead.
Teknik Double Window
Lung Window Mediastinum Window
Narrow Window Width Broad Window WidthHounsfieldunit
+3000
-1000
0
Window 1
Gray scaledisplay
White
Black
CT WindowingWindow 2
Digunakan untuk menampilkan dua jenis jaringanyang memiliki nilai densitas sangat berbeda, sepertiparu2 & mediastinum.

PT. SIEMENS INDONESIA
(c) Daniel Kartawiguna, 2006 [email protected] 60
119
Always Thinking Ahead.
119
Always Thinking Ahead.
Hasil Penggunaan Double Windows
Lung Window Mediastinum Window
Narrow Window Width
Untuk melihatparu2 danmediastinumsecara bersama-sama dalam satugambar.
*Penggunaan Double window tidak direkomendasikan untukdiagnosa.
120
Always Thinking Ahead.
120
Always Thinking Ahead.
Pengaruh Windowing pada Gambar
Narrow Window Width
Lung Window Mediastinum WindowDouble Window
Gambar 2: Hanyaparu2 yang terlihat.
Gambar 1: Paru2, dindingtoraks & mediastinum terlihat.
Gambar 3: Hanya dindingthorax & mediastinum Yang dapatterlihat.
PT. SIEMENS INDONESIA
(c) Daniel Kartawiguna, 2006 [email protected] 61
121
Always Thinking Ahead.
121
Always Thinking Ahead.
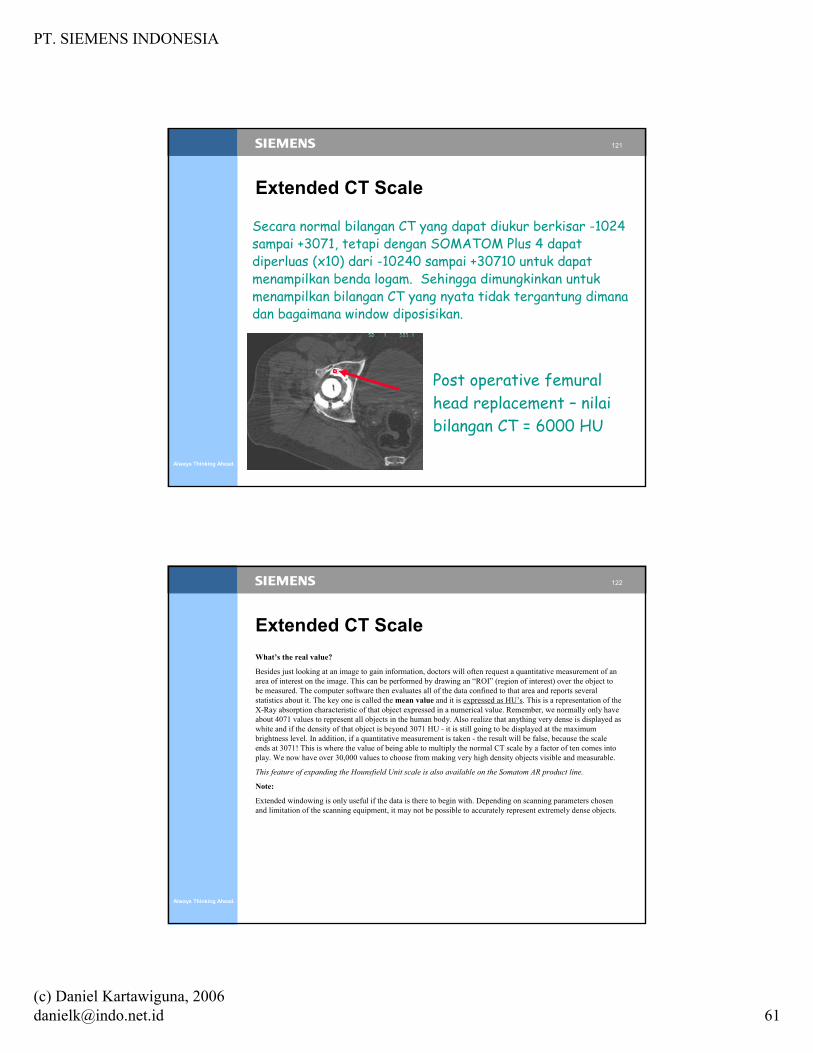
Extended CT Scale
Secara normal bilangan CT yang dapat diukur berkisar -1024 sampai +3071, tetapi dengan SOMATOM Plus 4 dapatdiperluas (x10) dari -10240 sampai +30710 untuk dapatmenampilkan benda logam. Sehingga dimungkinkan untukmenampilkan bilangan CT yang nyata tidak tergantung dimanadan bagaimana window diposisikan.
Post operative femuralhead replacement – nilaibilangan CT = 6000 HU
122
Always Thinking Ahead.
122
Always Thinking Ahead.
Extended CT ScaleWhat’s the real value?
Besides just looking at an image to gain information, doctors will often request a quantitative measurement of an area of interest on the image. This can be performed by drawing an “ROI” (region of interest) over the object to be measured. The computer software then evaluates all of the data confined to that area and reports several statistics about it. The key one is called the mean value and it is expressed as HU’s. This is a representation of the X-Ray absorption characteristic of that object expressed in a numerical value. Remember, we normally only have about 4071 values to represent all objects in the human body. Also realize that anything very dense is displayed as white and if the density of that object is beyond 3071 HU - it is still going to be displayed at the maximum brightness level. In addition, if a quantitative measurement is taken - the result will be false, because the scale ends at 3071! This is where the value of being able to multiply the normal CT scale by a factor of ten comes into play. We now have over 30,000 values to choose from making very high density objects visible and measurable.
This feature of expanding the Hounsfield Unit scale is also available on the Somatom AR product line.
Note:
Extended windowing is only useful if the data is there to begin with. Depending on scanning parameters chosen and limitation of the scanning equipment, it may not be possible to accurately represent extremely dense objects.

PT. SIEMENS INDONESIA
(c) Daniel Kartawiguna, 2006 [email protected] 62
123
Always Thinking Ahead.
123
Always Thinking Ahead.
POKOK BAHASAN1.Tomografi Komputer dan Sejarah
Perkembangannya2.Prinsip Tomografi Komputer3.Komponen2 Tomografi Komputer4.Sistem Tomografi Komputer yang
dikembangkan oleh SIEMENS5.Kalibrasi6.Pemeriksaan Kualitas Gambar
124
Always Thinking Ahead.
124
Always Thinking Ahead.
POKOK BAHASAN1.Tomografi Komputer dan Sejarah
Perkembangannya2.Prinsip Tomografi Komputer3.Komponen2 Tomografi Komputer4.Sistem Tomografi Komputer yang
dikembangkan oleh SIEMENS5.Kalibrasi6.Pemeriksaan Kualitas Gambar

PT. SIEMENS INDONESIA
(c) Daniel Kartawiguna, 2006 [email protected] 63
125
Always Thinking Ahead.
125
Always Thinking Ahead.
POKOK BAHASAN1.Tomografi Komputer dan Sejarah
Perkembangannya2.Prinsip Tomografi Komputer3.Komponen2 Tomografi Komputer4.Sistem Tomografi Komputer yang
dikembangkan oleh SIEMENS5.Kalibrasi6.Pemeriksaan Kualitas Gambar
126
Always Thinking Ahead.
126
Always Thinking Ahead.
POKOK BAHASAN1.Tomografi Komputer dan Sejarah
Perkembangannya2.Prinsip Tomografi Komputer3.Komponen2 Tomografi Komputer4.Sistem Tomografi Komputer yang
dikembangkan oleh SIEMENS5.Kalibrasi6.Pemeriksaan Kualitas Gambar
PT. SIEMENS INDONESIA
(c) Daniel Kartawiguna, 2006 [email protected] 64
127
Always Thinking Ahead.
127
Always Thinking Ahead.
128
Always Thinking Ahead.
128
Always Thinking Ahead.