west sulawesi province eng -...
TRANSCRIPT
KUTAIKARTANEGARA
PEN AJAMPA SERUTARA
KOTABALIKPAPAN
KOTASAMARIND A
DONGGA LASIGI
KOTAPALU
SID ENRENGRAPPA NG
PIN RANG
ENREKAN G
LUWU
TA NATORA JA
LUWUUTARA
TORA JAUTARA
MA JENE
POLEWALIMANDAR
MA MASA
MA MUJU
MA MUJUUTARA
Palu
Mamuju
Kasongan
Palu
Banawa
Sigi Biromaru
Mamuju
Majene
Mamasa
Pasangkayu
Tobadak
Polewali
Enrekang
Makale
Rantepao
01 - 56 - 2526 - 5051 - 100101 - 500501 - 2,5002,501 - 5,0005,000 - 130,000
PopulationPopulation counts at 1km resolution
Transportation
Toll roadPrimary roadSecondary roadPortAirport
Province CapitalDistrict Capital
Other
VolcanoWater/LakeCoastline/River
Administrative Boundary
Legend:
ProvinceDistrict
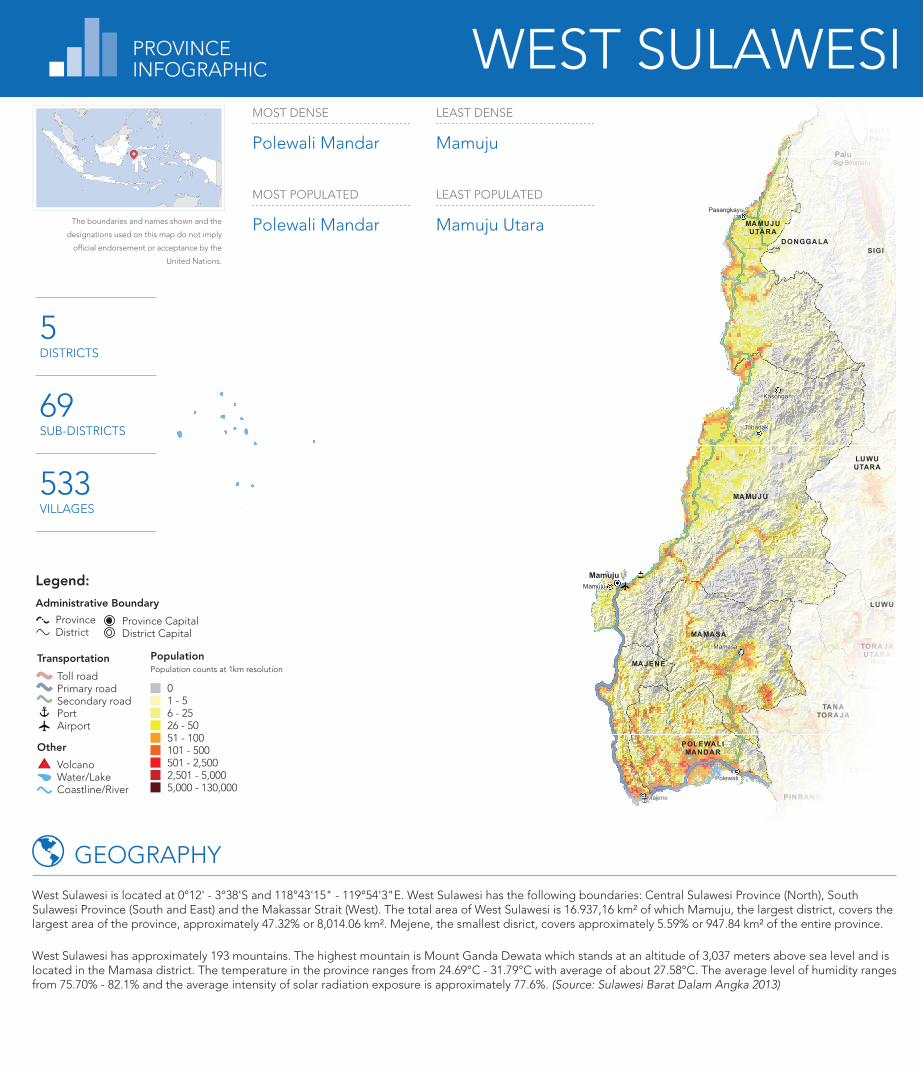
5DISTRICTS
69SUB-DISTRICTS
533VILLAGES
LEAST POPULATED
Mamuju Utara
MOST DENSE
Polewali Mandar
MOST POPULATED
Polewali Mandar
LEAST DENSE
Mamuju
GEOGRAPHY
West Sulawesi is located at 0°12' - 3°38'S and 118°43'15" - 119°54'3"E. West Sulawesi has the following boundaries: Central Sulawesi Province (North), South Sulawesi Province (South and East) and the Makassar Strait (West). The total area of West Sulawesi is 16.937,16 km² of which Mamuju, the largest district, covers the largest area of the province, approximately 47.32% or 8,014.06 km². Mejene, the smallest disrict, covers approximately 5.59% or 947.84 km² of the entire province.
West Sulawesi has approximately 193 mountains. The highest mountain is Mount Ganda Dewata which stands at an altitude of 3,037 meters above sea level and is located in the Mamasa district. The temperature in the province ranges from 24.69°C - 31.79°C with average of about 27.58°C. The average level of humidity ranges from 75.70% - 82.1% and the average intensity of solar radiation exposure is approximately 77.6%. (Source: Sulawesi Barat Dalam Angka 2013)
The boundaries and names shown and the
designations used on this map do not imply
official endorsement or acceptance by the
United Nations.
PROVINCEINFOGRAPHIC WEST SULAWESI

POPULATION
24
WATER & SANITATION
Private Public OthersShared
SANITATION TYPES
63.93% 36.07%
25.43% 11.84% 2.19%
7.29%
14.53%7.67%
8.94% 10.81%
WATER SOURCES
0.42%
10.31%0.56%
Protected well
Drilled well/pump
Unprotected wellRiverRain
Unprotected spring
Packaged water
Subscribed water
Protected springRefilled water
Retailed waterClean Drinking Water Sources Not Clean Drinking Water Sources
Percentage of households based on the usage of water resources
44.67%
5.33%
46.08%3.92%
HEALTH
HEALTH FACILITIES
MEDICAL STAFF
134 63 1,123674
DENTIST MIDWIFEDOCTOR OTHERS
PUSKESMAS PUSTUHOSPITAL POSYANDU OTHERS
85 2048 2,320 353
NATURAL DISASTER (2008-2012)
FOOD SECURITY IN 2009
Priority 1 DistrictsPriority 2 DistrictsPriority 3 Districts
Priority 4 DistrictsPriority 5 DistrictsPriority 6 DistrictsNo Data/Urban Area
The prevalence of food security is based on the WFP Food Security and Vulnerability Atlas. Vulnerability to food insecurity was determined based on nine indicators which are related to food availability, food access, food utilization and nutrition. The map was produced by combining the indicators into a composite food security index. Areas in red shades are less food secure compared to areas in green shades. The map highlights the prevalence of food insecurity at the district level and it should be noted that not all household living in dark red (priority 1) districts are food insecure, and conversely that not all household living in green (priority 6) districts are food secure.
VULNERABILITYTO FOOD INSECURITY
LIVELIHOOD
EDUCATION
EDUCATIONAL ATTAINMENT LITERACY RATE
State-owned public schoolsInclude private schoolsMadrasah
KIND
ERGA
RTEN
ELEM
ENTA
RY
JUNI
OR
SENI
OR (I
NCL.
SMK)
MAD
RASA
H
SCHOOL FACILITIES
0
200
400
600
800
1000
Senior
11.05%
Vocational
1.19%
Not graduatedfrom Elementary
25.77%
Elementary
29.66%
Junior
13.28%
Diploma
1.57%
Undergraduate
2.58%
Postgraduate
0.16%Never attendingschool
14.75%
83.25% From Total Population
Highest contributor for GDP:
1. Agriculture, Veterinary, Forestry, and Fishery (50.08%)2. Services (18.24%)3. Trading, Hotel, dan Restaurant (13.04%)
ServicesFinance, Leasing and Services companyOthers
Transportation and CommunicationTrading, Hotel, dan Restaurant
Processing IndustryElectricity, Gas and Clean waterConstruction
MiningAgriculture, Veterinary, Forestry, and Fishery
97.02% 1.88%
Note: The livelihood under 1% are not displayed on the chart.
1.10%
Source: SUSENAS year 2011, BPS
Source: Census year 2010, BPS
Source: Census year 2010, BPS
Source: PDRB 2012, based on dated price
Source: Census year 2010, BPS
DATA SOURCES
PROVINCE BPBD CONTACT DETAILS: Jl. H. Andi Depu No. 33,
Mamuju.
Phone. (0426) 22058,
Fax. (0426) 22058
Landscan Global Population Databaseshttp://web.ornl.gov/sci/ landscan/
Road Networkhttp://maps.navigasi.net
Administrative Boundaryhttp://bps.go.id
Food Security and Airporthttp://www.wfp.org/countries/ indonesia
Admin Capitalhttp://geospasial.bnpb.go.id
SRTM Relief Backgroundhttp://www2.jpl.nasa.gov/srtm/
Port, Volcano, Coastline and Riverhttp://geospasial.bnpb.go.id
Population, Water & Sanitation, Education, Health, Vulnerable Groups, Livelihood, Natural Disasterhttp://dibi.bnpb.go.id/
This products is prepared by:
0-4
5-9
10-14
15-19
20-24
25-29
30-34
35-39
40-44
45-49
50-54
55-59
60-64
65-69
70-74
75+
0 20 40 60 80020406080 (in thousand)
TOTAL HOUSEHOLD
290,070
TOTAL POPULATION
1,158,277
MALE
581,31650.19% from Total Population
Sex Ratio
100.75
FEMALE
576,96149.81% from Total Population
2015
1,282,200
2020
1,405,000
2025
1,527,800
POPULATION PROJECTION
Total Fertility Rate
Infant Mortality Rate (Male + Female)
Dependency Ratio (%)
EO (Male + Female)
56.00
2.99
63.90
51.10
52.70
2.80
66.00
42.10
53.80
2.92
65.10
45.90
22.88%Urban Population
77.12%Rural Population
2008 2009 2010 2011 2012
8191827
DROUGHT 8
HIGH TIDE 3
LANDSLIDE 4
FLOOD & LANDSLIDE 2
EARTHQUAKE 2
WHIRLWIND 10
FLOOD 25
DISABLE
From Total Population
0.23%Visual
0.20%Hearing
0.18%Walking
0.16%Memory impairment
0.03%Not able to taking care
of themselves