vol. 9, no. 2, 2019 p-issn: 2087-2038 e-issn:2461-1182
TRANSCRIPT

Diterbitkan oleh Fakultas Ekonomi dan Bisnis Universitas Islam Negeri Syarif Hidayatullah Jakarta. Jurnal berkala Ilmiah ini fokus dalam kajian bisnis dan manajemen. Esensi terbit dua kali dalam satu tahun. Esensi: Jurnal Bisnis dan Manajemen telah terindeks pada Directory of Open Access Journal (DOAJ), CrossRef, SINTA, ISJD LIPI, IPI, Moraref, BASE, dll.
Pemimpin Redaksi:Ismawati Haribowo
Redaktur:AmilinM. Arief MufrainiM. Nur Rianto Al Arif
Redaksi Ahli:Abdul Hamid (UIN Syarif Hidayatullah Jakarta)Ahmad Rodoni (UIN Syarif Hidayatullah Jakarta)Achmad Sudiro (Universitas Brawijaya)Bayu Taufiq Possumah (Universiti Malaysia Trengganu)Christantius Dwiatmadja (Universitas Kristen Satya Wacana)Harjum Muharam (Universitas Diponegoro)Murniati Mukhlisin (STEI Tazkia)Nurul Huda (Universitas YARSI)Suliyanto (Universitas Jenderal Soedirman)Sutan Emir Hidayat (University College of Bahrain)Tulus Suryanto (IAIN Raden Intan Lampung)Unggul Purwohedi (Universitas Negeri Jakarta)
PenyuntingMuhammad Daniyal Al Athar
Desain GrafisHamyen Mashudi
SekretariatMarwiyatiAhmad Ghozali
Alamat RedaksiGedung 2, Lt. 3 Fakultas Ekonomi dan Bisnis UIN Syarif Hidayatullah Jakarta
Jl. Ibn Sina IV, Ciputat, Tangerang Selatan, Banten. Telp. (021) 22744610Email: [email protected], Website: http://journal.uinjkt.ac.id/index.php/esensi
Vol. 9, No. 2, 2019 P-ISSN: 2087-2038 E-ISSN:2461-1182
Daftar Isi
The Effect of Augmented Reality Shopping Applications on Purchase Intention ............133Leonnard, Annisa S Paramita, Jasmine J Maulidiani
The Effect of Electronic Payment Systems on Financial Performance of Microfinance Banks in Niger State................................................................................................................143Musa Abdullahi Sakanko, Joseph David
The Impact of Financial Inclusion on Public Financial Services Education through Financial Technology in Sleman Regency, Indonesia ..........................................................................155I Made Laut Mertha Jaya
Karakteristik Perusahaan Terhadap Luas Pengungkapan Corporate Social Responsibility ....175Aryo Prakoso, Aulia Ayu Dewinta
Factors Influence Corporate Social Responsibility Disclosure ..........................................185Wike Mardiana, Anik Irawati
Does Transfer Motivation Succeed in Mediating in the Context of Training Transfer? ....191Dida Sovia Wirdani, Nury Ariani Wulansari
Reaksi Pasar terhadap Pengumuman Penawaran Saham Terbatas di Indonesia .............201Bambang Sutrisno, Andry Priharta
Mobile Display Advertising: Perilaku Niat Pembelian Konsumen pada High Involvement vs Low Involvement Product .......................................................................................................209Jiwangga Hadi Nata, Aries Kurniawan
Mampukah Kecerdasan Spiritual Memoderasi Hubungan Faktor Demografi dalam Mengelola Keuangan Pribadi Mahasiswa? ..................................................................................................225Nurul Humairo, Indah Yuliana
Pengaruh Perencanaan Pajak dan Profitabilitas Terhadap Nilai Perusahaan dengan BOD Diversity sebagai Variabel Moderasi .....................................................................................235Yuli Dwi Astuti, Giawan Nur Fitria
Leonnard1*, Annisa S Paramita2, Jasmine J Maulidiani3
1, 2, 3 Sekolah Tinggi Manajemen [email protected], [email protected], [email protected]*Corresponding author
AbstractAugmented reality is a new technological breakthrough that helps e-commerce delivers an online shopping experience with quality of offline shopping. This is possible due to the capability of augmented reality technology that allows consumers to interact and to try products through the virtual world. This technology has not been widely adopted by e-commerce in Indonesia. In this study, we analyzed the effect of this technology on purchase intention through e-consumer experience in the form of perceived enjoyment and usefulness to 89 consumers. Our findings revealed that virtual presence significantly affects the enjoyment and usefulness directly and indirectly to purchase intention. In addition, the device also significantly affects the enjoyment and usefulness directly. Finally, the usefulness is proven to significantly affect purchase intention.Keywords: augmented reality; e-commerce; purchase intention; PLS-SEM
AbstrakAugmented reality adalah terobosan teknologi baru yang membantu e-commerce memberikan pengalaman belanja online dengan kualitas belanja offline. Hal ini dimungkinkan karena kemampuan teknologi augmented reality yang memungkinkan konsumen berinteraksi dan mencoba produk melalui dunia virtual. Teknologi ini belum banyak diadopsi oleh e-commerce di Indonesia. Dalam penelitian ini, kami menganalisis pengaruh teknologi ini terhadap minat pembelian melalui pengalaman konsumen elektronik dalam bentuk kesenangan yang dirasakan dan manfaatnya bagi 89 konsumen. Temuan kami mengungkapkan bahwa kehadiran virtual secara signifikan mempengaruhi aspek kesenangan dan kegunaan secara langsung maupun tidak langsung terhadap minat pembelian. Selain itu, perangkat ini juga secara signifikan mempengaruhi aspek kesenangan dan kegunaannya secara langsung. Terakhir, aspek manfaat terbukti secara signifikan mempengaruhi minat pembelian.Kata kunci: augmented reality; e-commerce; minat pembelian; PLS-SEM
The Effect of Augmented Reality Shopping Applications on Purchase Intention
First draft: June 15, 2019; Revision: August 10, 2019; Accepted: September 5, 2019http://journal.uinjkt.ac.id/index.php/esensiDOI: https://doi.org/10.15408/ess.v9i2.9724
Esensi: Jurnal Bisnis dan ManajemenVolume 9 (2), 2019
P-ISSN: 2087-2038; E-ISSN:2461-1182Halaman 133 - 142
Vol. 9, No. 2, 2019Esensi: Jurnal Bisnis dan Manajemen
134 http://journal.uinjkt.ac.id/index.php/esensiDOI: https://doi.org/10.15408/ess.v9i2.9724
INTRODUCTION The emergence of e-commerce has changed the way producers sell their products
by making use of technology, selling at competitive prices, and reaching wider consumer segmentation through communication and transactions via the internet (Desti & Shanthi, 2015). These advantages have granted e-commerce a very significant and emerging development of e-commerce websites offering a wide range of products. However, these developments have not been able to completely cover for the on-site shopping experiences (Lu & Smith, 2008). On-site shopping gives an edge where consumers actually can interact with the product directly. They are able to see, to touch, and to try the product directly. Even consumers can also interact with the seller or the shop assistant to inquire any information about the product. These experiences are not fully acquired by consumers when they shop through e-commerce. As a result, it is often found that consumers are disappointed when they reach the product in their hands.
Therefore augmented reality is one of the new breakthroughs that offer solutions to the above problems through technology that can bring virtual world into the real world. Through this technology, consumers are able to do online shopping with on-site shopping experience. Since, application of augmented reality in e-commerce is still relatively new, studies that analyze the augmented reality in relation to the factors that encourage consumers to use the technology and its impact on purchase intention is still limited. Prior studies have analyzed the impact of AR on e-commerce, including technology effectiveness, consumer experience and satisfaction (Desti & Shanthi, 2015; Rese et al., 2017; Yim et al., 2017; Zhu et al., 2004). However, the analysis of the effect on purchase intention is still modest. Purchase intention is the next stage of consumer satisfaction. This variable measures the desire of consumers to make purchases in the future. The variable is a measure of actual buying behavior (Morrison, 1979). Therefore, in this study, we focus on the impact on purchase intention of products.
Augmented reality is an integration between the real world and the virtual world. This technology has greatly helped consumers to see the real world of virtual worlds that are incorporated into the real world. This technology provides a breakthrough way to interact with virtual objects that cannot be accessed directly by consumers (Azuma, 1997). This technology has proven to provide many advantages in e-commerce, including increasing sales, developing brand, and shaping consumer perceptions (Desti & Shanthi, 2015). In online shopping experience, this technology enables consumer to try on products through virtual worlds (Ma & Choi, 2007).
A consumer experience of augmented reality in e-commerce is very important in influencing their evaluations and purchasing decisions. Interactivity and vividness are two augmented reality qualities that influence consumer evaluation (Ariely, 2000; Yim et al., 2017). Furthermore, the term virtual presence as an indicator to evaluate the level of reality of the virtual world offered by augmented reality (Slater & Steed, 2000). Virtual presence is proven to improve the quality of consumer experience (Tussyadiah et al., 2018). In addition to the virtual presence, another important factor in improving the quality of consumer experiences is the device used to increase consumer experiences of augmented reality (Nincarean et al., 2013; Rapaccini et al., 2014). A high quality
135
The Effect of Augmented Reality Shopping Applications on Purchase IntentionLeonnard
http://journal.uinjkt.ac.id/index.php/esensiDOI: https://doi.org/10.15408/ess.v9i2.9724
experiences will lead to high perceived technology usefulness and enjoyment (Van Noort et al., 2012).
Usefulness is an indicator to measure how effective and efficient technology is used to help consumers find and obtain the information they need, evaluate products and make purchases (Kim & Forsythe, 2008). Usefulness is also an important indicator that explains the Electronic Technology Acceptance Model (TAM) (Davis, 1989). In addition to the usefulness, another indicator that explains TAM is enjoyment (Davis et al., 1992). Enjoyment measure aspects of pleasure and enjoyment of technology use (Childers et al., 2001). Both of these variables proved significant consumer shopping behavior and purchase intentions (He et al, 2018; Heijden, 2000; Huang & Hsu Liu, 2014; Poushneh & Vasquez-Parraga, 2017).
METHODS Randomly collected data were conducted with 89 consumers of e-commerce, aged
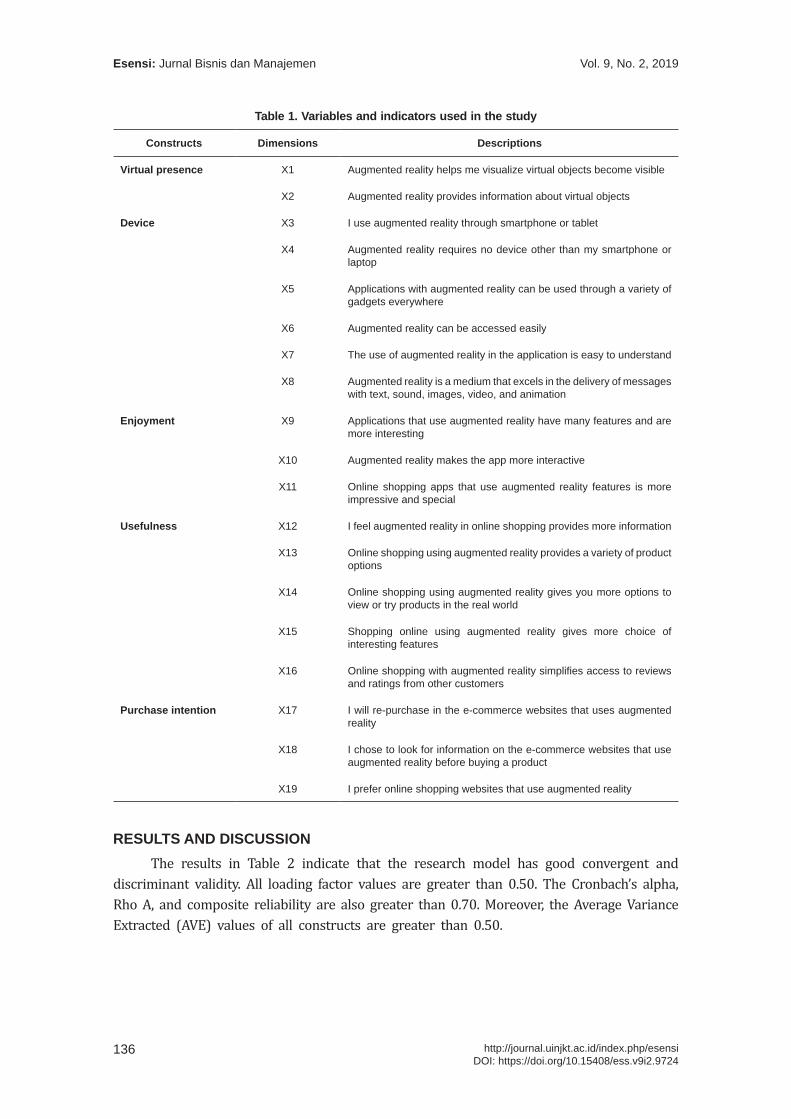
between 15 and 35 years old and worked as high school and university students (73 people), employees (11 people), entrepreneurs (3 people), housewives (1 person) and others (1 person) at South Jakarta, Indonesia. Surveys were distributed through online google forms. To analyze the impact of augmented reality on e-commerce purchase intention, the indicators used are virtual presence, device, perceived usefulness, perceived enjoyment, and purchase intention. The quality of augmented reality is measured through virtual presence and device (Ariely, 2000; Slater & Steed, 2000; Yim et al., 2017) as well as the virtual presence (Yim et al., 2017) and the device (Nincarean et al., 2013; Rapaccini et al., 2014). The consumer experience is measured through perceived usefulness (Yim et al., 2017) and perceived enjoyment indicators (Chang, Sun, Pan, & Wang, 2015; Mathwick et al., 2001). Finally, purchase intention is employed as an endogenous latent variable (He et al., 2018). All of the measurements are obtained on a five-point Likert scale. The indicators used can be observed in Table 1.
The Partial Least Square path modeling (PLS-PM) was performed to test the research hypotheses by using the SmartPLS 3.0 software. The small sample size will result in a biased estimation of the covariance-based path modeling so that maximum likelihood functionality was not possible. Therefore, the use of PLS-PM is considered very appropriate for small sample quantities (<100) (Hoyle, 1999). The stages of analysis using this method consist of outer model analysis, inner model analysis, and hypothesis testing.
Outer model analysis is used to evaluate whether the measurement scales used are valid and reliable. It consists of convergent validity test, discriminant validity test, and undimensionality test. The inner model analysis is used to evaluate whether the structural model formed is robust. The analysis consists of evaluating the coefficient of determination (R2), predictive relevance (q2), and Goodness of Fit (GoF). Finally, hypothesis testing is performed by evaluating the value of t-statistics and coefficients with a hypothesis based on the theory and previous studies.
Vol. 9, No. 2, 2019Esensi: Jurnal Bisnis dan Manajemen
136 http://journal.uinjkt.ac.id/index.php/esensiDOI: https://doi.org/10.15408/ess.v9i2.9724
Table 1. Variables and indicators used in the study
Constructs Dimensions Descriptions
Virtual presence X1 Augmented reality helps me visualize virtual objects become visible
X2 Augmented reality provides information about virtual objects
Device X3 I use augmented reality through smartphone or tablet
X4 Augmented reality requires no device other than my smartphone or laptop
X5 Applications with augmented reality can be used through a variety of gadgets everywhere
X6 Augmented reality can be accessed easily
X7 The use of augmented reality in the application is easy to understand
X8 Augmented reality is a medium that excels in the delivery of messages with text, sound, images, video, and animation
Enjoyment X9 Applications that use augmented reality have many features and are more interesting
X10 Augmented reality makes the app more interactive
X11 Online shopping apps that use augmented reality features is more impressive and special
Usefulness X12 I feel augmented reality in online shopping provides more information
X13 Online shopping using augmented reality provides a variety of product options
X14 Online shopping using augmented reality gives you more options to view or try products in the real world
X15 Shopping online using augmented reality gives more choice of interesting features
X16 Online shopping with augmented reality simplifies access to reviews and ratings from other customers
Purchase intention X17 I will re-purchase in the e-commerce websites that uses augmented reality
X18 I chose to look for information on the e-commerce websites that use augmented reality before buying a product
X19 I prefer online shopping websites that use augmented reality
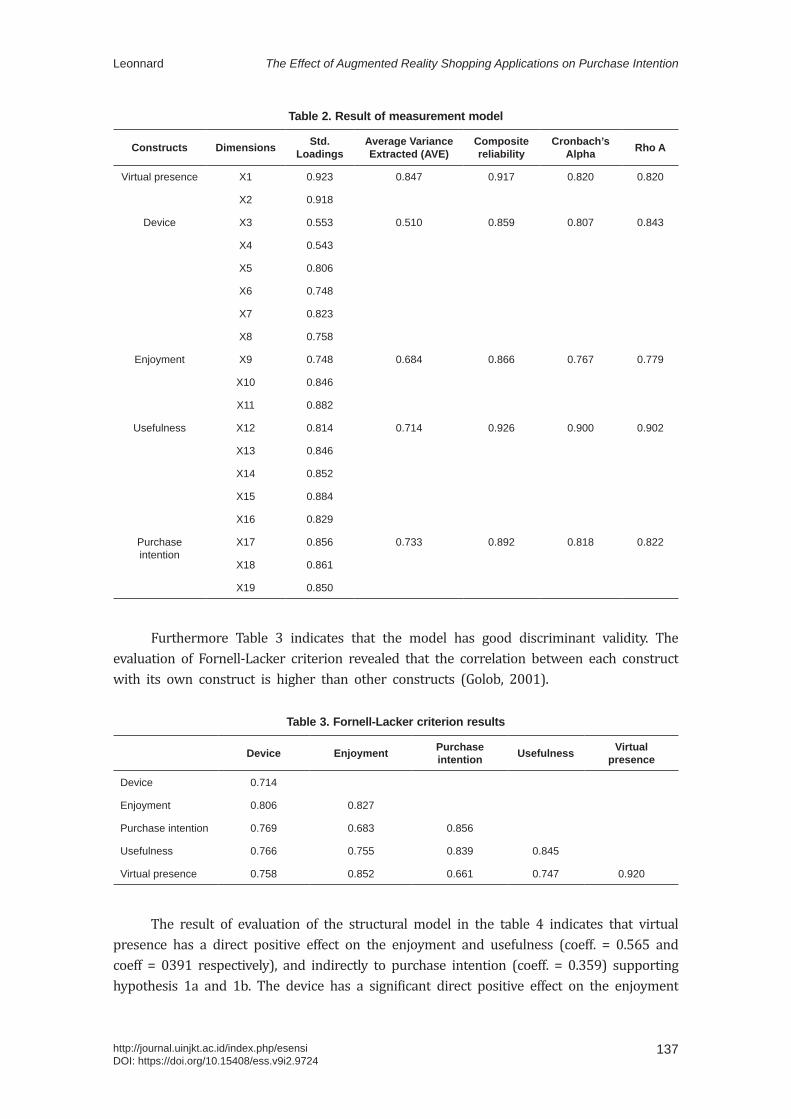
RESULTS AND DISCUSSION The results in Table 2 indicate that the research model has good convergent and
discriminant validity. All loading factor values are greater than 0.50. The Cronbach’s alpha, Rho A, and composite reliability are also greater than 0.70. Moreover, the Average Variance Extracted (AVE) values of all constructs are greater than 0.50.
137
The Effect of Augmented Reality Shopping Applications on Purchase IntentionLeonnard
http://journal.uinjkt.ac.id/index.php/esensiDOI: https://doi.org/10.15408/ess.v9i2.9724
Table 2. Result of measurement model
Constructs Dimensions Std. Loadings
Average Variance Extracted (AVE)
Composite reliability
Cronbach’s Alpha Rho A
Virtual presence X1 0.923 0.847 0.917 0.820 0.820
X2 0.918
Device X3 0.553 0.510 0.859 0.807 0.843
X4 0.543
X5 0.806
X6 0.748
X7 0.823
X8 0.758
Enjoyment X9 0.748 0.684 0.866 0.767 0.779
X10 0.846
X11 0.882
Usefulness X12 0.814 0.714 0.926 0.900 0.902
X13 0.846
X14 0.852
X15 0.884
X16 0.829
Purchase intention
X17 0.856 0.733 0.892 0.818 0.822
X18 0.861
X19 0.850
Furthermore Table 3 indicates that the model has good discriminant validity. The evaluation of Fornell-Lacker criterion revealed that the correlation between each construct with its own construct is higher than other constructs (Golob, 2001).
Table 3. Fornell-Lacker criterion results
Device Enjoyment Purchase intention Usefulness Virtual
presence
Device 0.714
Enjoyment 0.806 0.827
Purchase intention 0.769 0.683 0.856
Usefulness 0.766 0.755 0.839 0.845
Virtual presence 0.758 0.852 0.661 0.747 0.920
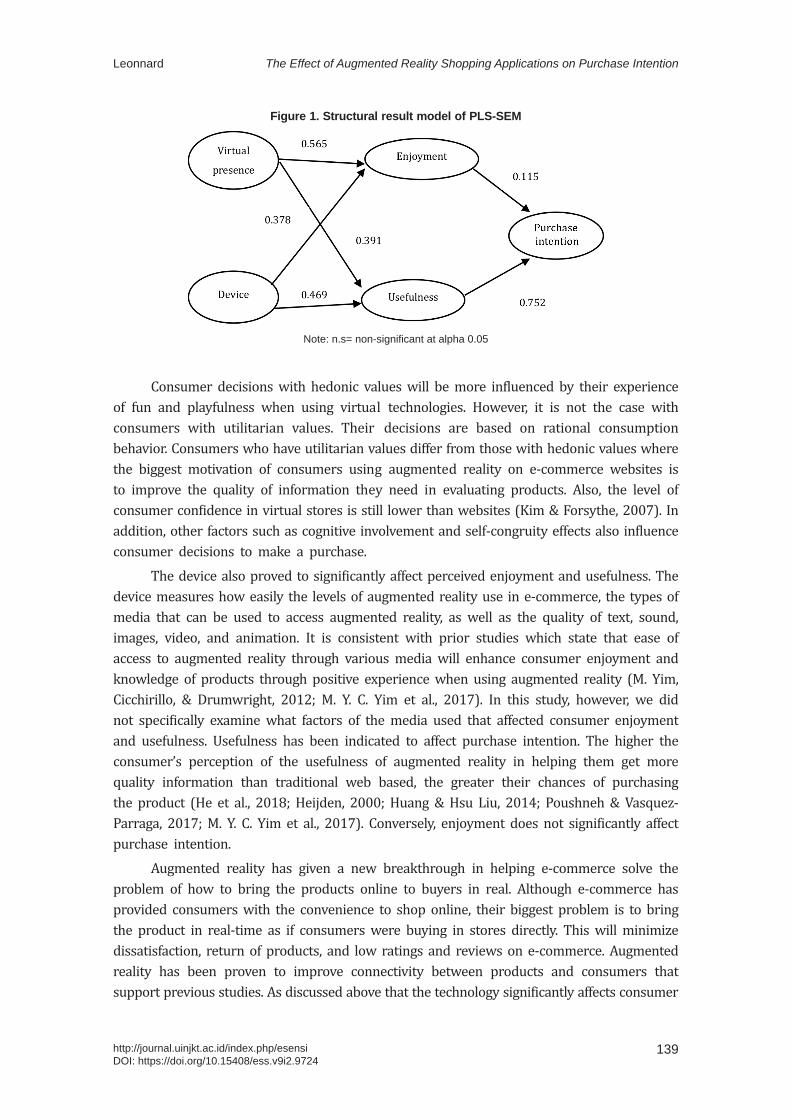
The result of evaluation of the structural model in the table 4 indicates that virtual presence has a direct positive effect on the enjoyment and usefulness (coeff. = 0.565 and coeff = 0391 respectively), and indirectly to purchase intention (coeff. = 0.359) supporting hypothesis 1a and 1b. The device has a significant direct positive effect on the enjoyment

Vol. 9, No. 2, 2019Esensi: Jurnal Bisnis dan Manajemen
138 http://journal.uinjkt.ac.id/index.php/esensiDOI: https://doi.org/10.15408/ess.v9i2.9724
and usefulness (coeff. = 0.378 and coeff. = 0.469 respectively), but does not significantly affect purchase intention indirectly (coeff. = 0.397) supporting hypotheses 2a and 2b. Finally, usefulness has been indicated to have a positive effect on purchase intention (coeff. = 0.752) in favor of hypothesis 3.
Table 4. Direct, indirect, and total effects of PLS-SEM
Direct effect Indirect effect Total effect
Virtual presence -> Enjoyment 0.565 - 0.565***
Virtual presence -> Usefulness 0.391 - 0.391**
Virtual presence -> Purchase intention - 0.359 0.359**
Device -> Enjoyment 0.378 - 0.378***
Device -> Usefulness 0.469 - 0.469***
Device -> Purchase intention - 0.397 0.397***
Enjoyment -> Purchase intention 0.115 - 0.115 n.s
Usefulness -> Purchase intention 0.752 - 0.752***
Note: n.s=non-significant at alpha 0.05
This study examined the effect of augmented reality on consumer purchases in e-commerce. The result of data processing indicates that virtual presence affects perceived enjoyment and usefulness. We assumed that the augmented reality used by e-commerce on this research site already has a good virtual quality (Slater & Steed, 2000). The high quality devices are able to produce perceived enjoyment. This is in accordance with the prior study, which states that the enjoyment level perceived by consumers is higher in the virtual stores than in physical stores (Lee & Chung, 2008). Likewise with the effect on usefulness to the consumer (van Noort et al., 2012). In addition, the result also gives us information that augmented reality has been accepted as a new technology by consumers. It supports Electronic Technology Acceptance Model (TAM) (Davis, 1989). The relationship between constructs in the model is indicated in the Figure 1.
The variable also has an indirect effect on purchase intention through perceived enjoyment and usefulness. The desire of consumers to pay for products is no longer because of the quality and characteristics of these products, but because of their experience using virtual reality applications (Li & Meshkova, 2013). It applies especially to female consumers. However, in this study, enjoyment is not being able to generate purchases. It can be caused by the virtuality level, whether it allows consumers to simulate the product in whole or only in part. In addition, it also depends on the type of consumers, whether they have hedonic or utilitarian values (Kim & Forsythe, 2007; Merle, Senecal, & St-Onge, 2012).
139
The Effect of Augmented Reality Shopping Applications on Purchase IntentionLeonnard
http://journal.uinjkt.ac.id/index.php/esensiDOI: https://doi.org/10.15408/ess.v9i2.9724
Figure 1. Structural result model of PLS-SEM
Note: n.s= non-significant at alpha 0.05
Consumer decisions with hedonic values will be more influenced by their experience of fun and playfulness when using virtual technologies. However, it is not the case with consumers with utilitarian values. Their decisions are based on rational consumption behavior. Consumers who have utilitarian values differ from those with hedonic values where the biggest motivation of consumers using augmented reality on e-commerce websites is to improve the quality of information they need in evaluating products. Also, the level of consumer confidence in virtual stores is still lower than websites (Kim & Forsythe, 2007). In addition, other factors such as cognitive involvement and self-congruity effects also influence consumer decisions to make a purchase.
The device also proved to significantly affect perceived enjoyment and usefulness. The device measures how easily the levels of augmented reality use in e-commerce, the types of media that can be used to access augmented reality, as well as the quality of text, sound, images, video, and animation. It is consistent with prior studies which state that ease of access to augmented reality through various media will enhance consumer enjoyment and knowledge of products through positive experience when using augmented reality (M. Yim, Cicchirillo, & Drumwright, 2012; M. Y. C. Yim et al., 2017). In this study, however, we did not specifically examine what factors of the media used that affected consumer enjoyment and usefulness. Usefulness has been indicated to affect purchase intention. The higher the consumer’s perception of the usefulness of augmented reality in helping them get more quality information than traditional web based, the greater their chances of purchasing the product (He et al., 2018; Heijden, 2000; Huang & Hsu Liu, 2014; Poushneh & Vasquez-Parraga, 2017; M. Y. C. Yim et al., 2017). Conversely, enjoyment does not significantly affect purchase intention.
Augmented reality has given a new breakthrough in helping e-commerce solve the problem of how to bring the products online to buyers in real. Although e-commerce has provided consumers with the convenience to shop online, their biggest problem is to bring the product in real-time as if consumers were buying in stores directly. This will minimize dissatisfaction, return of products, and low ratings and reviews on e-commerce. Augmented reality has been proven to improve connectivity between products and consumers that support previous studies. As discussed above that the technology significantly affects consumer
Vol. 9, No. 2, 2019Esensi: Jurnal Bisnis dan Manajemen
140 http://journal.uinjkt.ac.id/index.php/esensiDOI: https://doi.org/10.15408/ess.v9i2.9724
perceptions of product enjoyment and usefulness. However, the influence of this technology on consumer buying behavior is still being debated.
CONCLUSIONThis study confirms previous studies that analyzed the effect of augmented reality on
purchase intention. The results of data analysis indicate that virtual presence significantly affects the enjoyment and usefulness directly and indirectly to purchase intention. Devices significantly affect the enjoyment and usefulness directly and usefulness proved to significantly affects purchase intention. Conversely, enjoyment does not significantly affect purchase intention. It can be affected by many factors, including types of consumers, cognitive involvement and self-congruence. In addition, the characteristics of consumers are also important to consider. Most of the respondents of this study are high school and university students, therefore, the interpretation of the results should be performed carefully. It is because students are more receptive and adaptable to new technologies, but it is not applied to adults and parents. In addition, in making a purchase decision, they may depend on their parents’ decision. In addition, the results are still prevalent in all types of products that have adapted augmented reality technology to their websites. Each product may have different characteristics and the test results for each variable in this research model will possibly distinct.
REFERENCESAriely, D. (2000). Information Control in Buying Behvaiour. . Journal of Consumer Research, 27(2),
233-248Azuma, R. T. A. (1997). Survey of Augmented Reality. Presence: Teleoperators and Virtual
Environments. https://doi.org/10.1162/pres.1997.6.4.355Chang, S. C., Sun, C. C., Pan, L. Y., & Wang, M. Y. (2015). An Extended TAM to Explore
Behavioural Intention of Consumers to Use M-Commerce. Journal of Information and Knowledge Management, 14(2), 1–16.
Childers, T. L., Carr, C. L., Peck, J., & Carson, S. (2001). Hedonic and utilitarian motivations for online retail shopping behavior. Journal of Retailing. https://doi.org/10.1016/S0022-4359(01)00056-2
Davis, F. D. (1989). Preparation of Rutile TiO 2 Films by RF Magnetron Sputtering Related content Role of He Gas Mixture on the Growth of Anatase and Rutile TiO 2 Films in RF Magnetron Sputtering Kunio Okimura and Akira Shibata - Deposition of High-Quality TiO 2 Films by RF M. Japanese Journal of Applied Physics Kunio Okimura et Al Jpn. J. Appl. Phys, 34(September). https://doi.org/10.2307/249008
Davis, F. D., Bagozzi, R. P., & Warshaw, P. R. (1992). Extrinsic and Intrinsic Motivation to Use Computers in the Workplace. Journal of Applied Social Psychology, 22(14), 1111–1132.
Desti, K., & Shanthi, R. (2015). The Impact of Augmented Reality on E-commerce. Journal of Marketing and Consumer Research, 64–73.
Golob, A. (2001). UC Irvine Recent Work Title Structural Equation Modeling for Travel Behavior Research. Retrieved from https://escholarship.org/content/qt56t8j1n6/qt56t8j1n6.pdf
141
The Effect of Augmented Reality Shopping Applications on Purchase IntentionLeonnard
http://journal.uinjkt.ac.id/index.php/esensiDOI: https://doi.org/10.15408/ess.v9i2.9724
He, Z., Wu, L., & Li, X. (Robert). (2018). When art meets tech: The role of augmented reality in enhancing museum experiences and purchase intentions. Tourism Management, 68, 127–139. https://doi.org/10.1016/j.tourman.2018.03.003
Heijden, H. Van Der. (2000). E-Tam: a revision of the Technology Acceptance Model to explain website revisits (No. 0029).
Hoyle, R. H. (1999). Structural Equation Modeling Analysis with Small Samples using Partial Lesst Squares. Statistical Strategies for Small Sample Research, (March), 34.
Huang, T.-L., & Hsu Liu, F. (2014). Formation of augmented-reality interactive technology’s persuasive effects from the perspective of experiential value. Internet Research. https://doi.org/10.1108/IntR-07-2012-0133
Kim, J., & Forsythe, S. (2007). Adoption of Virtual Try-on Technology for Online Apparel Shopping. Journal of Interactive Marketing, 21(3), 2–21. https://doi.org/10.1002/dir
Lee, K. C., & Chung, N. (2008). Empirical analysis of consumer reaction to the virtual reality shopping mall. Computers in Human Behavior, 24(1), 88–104. https://doi.org/10.1016/j.chb.2007.01.018
Li, T., & Meshkova, Z. (2013). Examining the impact of rich media on consumer willingness to pay in online stores. Electronic Commerce Research and Applications, 12(6), 449–461. https://doi.org/10.1016/j.elerap.2013.07.001
Lu, Y., & Smith, S. (2008). Augmented Reality E-Commerce: How the Technology Benefits People’s Lives. Human Computer Interaction. https://doi.org/10.5772/6301
Ma, J. Y., & Choi, J. S. (2007). The virtuality and reality of Augmented reality. Journal of Multimedia, 2(1), 32–37. https://doi.org/10.4304/jmm.2.1.32-37
Mathwick, C., Malhotra, N., & Rigdon, E. (2001). Experiential value: Conceptualization, measurement and application in the catalog and Internet shopping environment. Journal of Retailing, 77(1), 39–56.
Merle, A., Senecal, S., & St-Onge, A. (2012). Whether and how virtual try-on influences consumer responses to an apparel web site. International Journal of Electronic Commerce, 16(3), 41–64.
Morrison, D. G. (1979). Purchase intentions and purchase behavior. Journal of marketing, 43(2), 65-74.
Nincarean, D., Alia, M. B., Halim, N. D. A., & Rahman, M. H. A. (2013). Mobile Augmented Reality: The Potential for Education. Procedia - Social and Behavioral Sciences, 103, 657–664.
Poushneh, A., & Vasquez-Parraga, A. Z. (2017). Discernible impact of augmented reality on retail customer’s experience, satisfaction and willingness to buy. Journal of Retailing and Consumer Services, 34(October 2016), 229–234. https://doi.org/10.1016/j.jretconser.2016.10.005
Rapaccini, M., Porcelli, I., Espí�ndola, D. B., & Pereira, C. E. (2014). Evaluating the use of mobile collaborative augmented reality within field service networks: the case of Océ Italia – Canon Group. Production and Manufacturing Research, 2(1), 738–755. https://doi.org/10.1080/21693277.2014.943430
Vol. 9, No. 2, 2019Esensi: Jurnal Bisnis dan Manajemen
142 http://journal.uinjkt.ac.id/index.php/esensiDOI: https://doi.org/10.15408/ess.v9i2.9724
Rese, A., Baier, D., Geyer-Schulz, A., & Schreiber, S. (2017). How augmented reality apps are accepted by consumers: A comparative analysis using scales and opinions. Technological Forecasting and Social Change, 124, 306–319.
Slater, M., & Steed, A. (2000). A Virtual Presence Counter can’t make changes. Presence: Teleoperators and Virtual Environments. https://doi.org/10.1162/105474600566925
Tussyadiah, I. P., Wang, D., Jung, T. H., & tom Dieck, M. C. (2018). Virtual reality, presence, and attitude change: Empirical evidence from tourism. Tourism Management, 66, 140–154. https://doi.org/10.1016/j.tourman.2017.12.003
van Noort, G., Voorveld, H. A. M., & van Reijmersdal, E. A. (2012). Interactivity in Brand Web Sites: Cognitive, Affective, and Behavioral Responses Explained by Consumers’ Online Flow Experience. Journal of Interactive Marketing, 26(4), 223–234. https://doi.org/10.1016/j.intmar.2011.11.002
Yim, M., Cicchirillo, V., & Drumwright, M. (2012). The impact of stereoscopic three-dimensional (3-D) advertising. Journal of Advertising, 41(2), 113–128.
Yim, M. Y. C., Chu, S. C., & Sauer, P. L. (2017). Is Augmented Reality Technology an Effective Tool for E-commerce? An Interactivity and Vividness Perspective. Journal of Interactive Marketing, 39, 89–103.
Zhu, W., Owen, C., Li, H., & Lee, J. (2004). Personalized in-store e-commerce with the promopad: an augmented reality shopping assistant. Electronic Journal for E-commerce Tools and Applications, 1(3), 1-19
Musa Abdullahi Sakanko1*, Joseph David2
1University of Jos, Nigeria2Ibrahim Badamasi Babangida University Lapai, [email protected], [email protected]*Corresponding author
AbstractThis study employs the cross sectional survey research design and the descriptive and ordinary least square regressions to examine the impact of Electronic-Payment Systems on the financial performance of Microfinance Banks and Institutions in Niger state, Nigeria. The results of the analysis indicate the presence of e-payment systems in the bank, which enjoys impressive acceptability, due to its ease of use and convenience. In addition, ATM facility, Internet payment options, e-payment cards, and mobile banking platforms shows a significant positive impact on the financial performance of COE-Minna microfinance bank. In essence, the improvement and review of e-payment platforms’ security, so as to attract more users, coupled with the reduction of charges associated with the use of the platforms as well as sensitization of potential users were recommended.Keywords: e-payment systems, financial performance, microfinance banks
AbstrakStudi ini menggunakan desain penelitian survei cross sectional dan regresi deskriptif, serta regresi OLS untuk menguji dampak Sistem Pembayaran Elektronik terhadap kinerja keuangan Bank dan Lembaga Keuangan Mikro di negara bagian Niger, Nigeria. Hasil analisis menunjukkan adanya sistem pembayaran elektronik di bank, yang menikmati penerimaan yang mengesankan, karena kemudahan penggunaan dan kemudahannya. Selain itu, fasilitas ATM, opsi pembayaran Internet, kartu pembayaran elektronik, dan platform mobile banking menunjukkan dampak positif yang signifikan terhadap kinerja keuangan bank mikro COE-Minna. Intinya, perbaikan dan peninjauan keamanan platform pembayaran elektronik, sehingga menarik lebih banyak pengguna, ditambah dengan pengurangan biaya yang terkait dengan penggunaan platform serta sensitivitas pengguna potensial direkomendasikan.Kata kunci: sistem pembayaran elektronik, kinerja keuangan, bank keuangan mikro
The Effect of Electronic Payment Systems on Financial Performance of Microfinance Banks in Niger State
First draft: July 20, 2019; Revision: September 5, 2019; Accepted: September 30, 2019http://journal.uinjkt.ac.id/index.php/esensiDOI: https://doi.org/10.15408/ess.v9i2.12273
Esensi: Jurnal Bisnis dan ManajemenVolume 9 (2), 2019
P-ISSN: 2087-2038; E-ISSN:2461-1182Halaman 143 - 154
Vol. 9, No. 2, 2019Esensi: Jurnal Bisnis dan Manajemen
144 http://journal.uinjkt.ac.id/index.php/esensiDOI: https://doi.org/10.15408/ess.v9i2.12273
INTRODUCTIONThe emergence of Information and Communication Technology (ICT) had completely
changed the lives and modus operandi of individuals and organizations respectively (Kabir et al., 2015). Its advent together with Digital technologies has made great evolutionary development in finance, economics, operational costs and enhanced organizational performance (Slozko & Pello, 2015, cited in Kabir et al., 2015). This development coupled with global proliferation of the internet and its rapid usage over the years is responsible for the dynamic change in business transactions in the business world, from the traditional cash-based transactions to electronic-based payments (Mohamad et al., 2009, cited in Kabir, Saidin & Ahmim, 2015), and the facilitation of electronic commerce in global business environment (Fernandes, 2013, cited in Kabir et al., 2015).
In business and financial transactions generally, the introduction of Electronic-based payment system (EPS)—exchange of an electronic worth of payment from the buyer to the seller by means of an online payment channel that permits clients to remotely access and deal with their financial accounts and exchanges over an electronic system (Teoh et al., 2013)—has shifted financial operations from the traditional relatively stable environment to an electronic-based operation, without visiting a brick-and-mortar institution (Asiimwe, 2015), which guarantees faster transactions, due to reduction of queues at points of sales; improve hygiene (eliminating the bacterial spread through handling notes and coins); increased sales; ease in cash collection (elimination of time spent on collecting, counting and sorting cash); and managing of staff entitlements (Ugwueze & Nwezeaku, 2016). The benefits of the adoption of electronic based payment systems also includes the facilitation of secured and faster access to capital resources (Khan et al., 2017), faster pay-outs, better tracking, transparent transactions, reduced time use, cost and time savings, increased number of clients, more service for customers, greater efficiency, enhancement of bank’s reputation (Yang et al., 2018), larger customer coverage, international products and services, promotion and branding, increase in customer satisfaction and personalized relationship with customers, and easier documentation and transaction tracking (Ugwueze & Nwezeaku, 2016), increased trust between sellers and buyers (Fatonah et al., 2018), ease-up of difficulties and securities associated with the conventional cash-based and cheque payment systems, and the added advantage of pliability in usage which placed the electronic-based payment system options on a celebrated stride than the paper-based payment options (Khan et al., 2017), thus decreasing the relative importance of using cash as the only means of exchange.
In the banking sector, the adoption of Electronic-based payment system is associated with improvement in the efficiency of banks in provision of financial services (Yang et al., 2018), in term of increased customer satisfaction and personalized relationship with customers, easier documentation and transaction tracking, reduced transfer/processing fees, increase of processing transaction time, offering of multiple payment options and giving of immediate notification on all transactions on the part of customers (Ugwueze & Nwezeaku, 2016), convenience, speed of transfer (Oyetayo & Fatokun, 2015), reduced risk, and cost control on the part of the banking public. Furthermore, aside from relieving the means of making monetary exchanges (Khan, et al., 2017) and processing transactions (Junadi, 2015, cited in Fatona et al., 2018), it has been asserted that the greater usage of instruments and
145
The Effect of Electronic Payment Systems on Financial PerformanceMusa Abdullahi Sakanko
http://journal.uinjkt.ac.id/index.php/esensiDOI: https://doi.org/10.15408/ess.v9i2.12273
facilities of Electronic Payment Systems (EPS) such as credit cards, card fees, debit cards, e-money, online credit card payment, electronic-cash (E-cash), electronic-checks (E-checks), small payments, electronic-wallet (E-wallet), value systems online stored, digitally collecting balance systems, wireless payment systems, digital check payment systems, Automated Teller Machine (ATM), Point-of-Sale (POS) terminal, among others (Hsiao-Cheng et al., 2002; Fatonah et al., 2018), has the tendency of enhancing financial performance—the measure of achievement on the goals, policies and operations stipulated in monetary terms (King’ori et al., 2017)—of banks and financial institutions, especially in countries with more developed retail payment services like ATMs, and POS terminals, among others (Titko et al., 2016).
However, though it has been empirically proven that the adoption of electronic-based payment system in the delivery of financial services has a significant positive effect on the financial performance of conventional banks and financial institutions (see Asiimwe, 2015; Barasa et al., 2017; Kombe & Wafula, 2015; Yang, et al., 2018; Mateka et al., 2016; Siddik et al., 2016; Mawutor, 2014; Yasin, 2018; Njoroge & Mugambi, 2018; David & Kaulihowa, 2018; Abaenewe et al., 2013; Ugwueze & Nwezeaku, 2016; Chimaobi, 2018), due to its obvious cheapness, in comparison to physical branches delivery, which most often results in the reduction of operational cost, in form of reduced and better utilized workforce, equipment, space and operational savings (Yang, et al., 2018).
However, it is vague if the adoption of electronic payment systems also influences the financial performance of Microfinance Banks (MFBs) and Institutions—specialized institutions that provide and make financial services available such as savings, micro-credit, among others accessible to the poor and low income groups or individual, who are conventionally not served by the standard formal financial sector, both in the rural and urban areas (Ahmed, 2014), even in the absence of securities, thereby making even the poorest in the economy financially included (Sakanko et al., 2019)—due to the inherent characteristics of its customers, and the growth of the institution, which does not favour the implementation and usage of electronic-based payment systems whom are very critical in the economy, due to
For instance, in Nigeria, like most developing economics which Microfinance Banks are prevalent, the groups of people that mostly patronizes Microfinance Banks (MFBs) include, artisans, traders, farmers, Small and Medium Scale Enterprises (SMEs), and more generally low-income earners and poor individuals, whom are mostly uneducated or semi-educated, unlike in the standard banks and financial institutions. Hence, the introduction and adoption of electronic-payment systems in MFBs might discourage most potential customers from accessing the financial services of the financial institution, due to the lack of trust in the technology, complexity of the technology, as well as the perceived risk in using electronic-based payment technologies in comparison to the traditional cash-based payment system, which ultimately tends to affect the financial performance of the MFBs in form of Return On Asset (ROA), Net Interest Margin (NIM), Return On Equity (ROE), Profit After Tax (PAT), among other financial indicators.
While customer’s ability to subscribe to the electronic-based payment services depend on several factors such as user-friendly interface, level of Internet experience, types of services provided, attitude and perception, access and delivery time (Asiimwe, 2015), however, aside from issues of perceived level of illiteracy and poverty, which is inherent among most
Vol. 9, No. 2, 2019Esensi: Jurnal Bisnis dan Manajemen
146 http://journal.uinjkt.ac.id/index.php/esensiDOI: https://doi.org/10.15408/ess.v9i2.12273
MFBs’ customers, which tends to barricade the use of e-payment gateways and facilities, issues such risk exposure (security); fraudulent practices (Abaenewe et al., 2013); lack of anonymity (transaction details are stored on payment database/absence of privacy); necessity of internet access; restrictions (daily maximum transaction restrictions); the risk of being hacked (Oyetayo & Fatokun, 2015); special charges which the use of e-payment systems such as POS terminals and ATM, among others, attracts, which are usually higher than those associated with traditional payment systems (Ugwueze, & Nwezeaku, 2016); coupled with the difficulties associated with accessing and acquiring e-payment and internet facilities; poor telecommunication network; poor electronic payments and inter-bank connectivity; absence of effective legal system (Ajisegiri & Oyebisi, 2014); and epileptic power supply, among others, which abound in e-payment systems, specifically in developing countries, tend to generally discourage the use of e-payment system in favour of the traditional payment system.
Empirically, though research has addressed the potential impact of the internet on different industries including the banking industry (Asiimwe, 2015), however, research on the effect of electronic-based payment systems on financial performance in the banking sector has been largely targeted on the conventional commercial banks (see Barasa et al., 2017; Kombe & Wafula, 2015; Matekaet al., 2016; Ogare, 2013; Njoroge & Mugambi, 2018; David & Kaulihowa, 2018; Mawutor, 2014; Yasin, 2018; Yang et al., 2018; Siddik et al., 2016; Bantegeye, 2017; Abaenewe et al., 2013; Ugwueze & Nwezeaku, 2016; Chimaobi, 2018; Oyewole et al., 2013; Harelimana, 2018), while neglecting its (electronic payment systems) impact on the financial performance of Microfinance banks (MFBs).
Notwithstanding, very few studies also examined the effect of electronic-based payment systems on the financial performance of Microfinance Banks (and Institutions). For instance, Harelimana, (2017a) examines the impact of ICT utilization on the financial performance of microfinance institutions in Rwanda, with the case study of Réseau Interdiocesain de microfinance (RIM) Ltd, within the period of 5 years (2011-2015). Employing descriptive survey using both qualitative and quantitative methods for a total sample size of 132, collected using purposive and simple random sampling, results indicate that ICT has a significant impact on financial sustainability and profitability, financial efficiency and productivity, and portfolio quality. In addition, correlation result shows that ICT usage has a significant positive impact on financial sustainability and profitability, although the strength of the impact is low, due to the low level of investments in ICT among microfinance institutions. Similarly, Harelimana (2017b) investigates the impact of mobile banking in financial performance of Unguka Microfinance Bank Ltd, within the period of 2012-2016. Results revealed that mobile banking products offered by Unguka Bank Ltd (Fund Transfer between Accounts, Bill Payment, order for cheque books and bank statements, and mobile money) has a significant positive effect on the financial performance (revenue) of Unguka Ltd in the last three years. In contrast, Atavachi (2013) adopt a descriptive survey design to assess the effect of electronic banking on financial performance of nine registered deposit taking micro-finance institutions in Kenya as at June 2013. The results indicate the existence of a negative relationship between electronic banking and financial performance of deposit taking microfinance institutions in Kenya.
Unequivocally, there is an obvious absence of study on the impact of electronic payment
147
The Effect of Electronic Payment Systems on Financial PerformanceMusa Abdullahi Sakanko
http://journal.uinjkt.ac.id/index.php/esensiDOI: https://doi.org/10.15408/ess.v9i2.12273
systems on the financial performance of microfinance banks (and institutions) in Nigeria. However, this study will add to existing studies on electronic-based payment systems and financial performance, by explicitly examining the effect of the adoption and implementation of electronic-payment systems on the financial performance of microfinance banks (and institutions) in Niger state, Nigeria, with respect to the ROA, ROE, NIM, PAT, among other financial performance indicators.
METHODFor the purpose of this study, the survey research design is adopted, specifically, the
cross sectional survey research design. The method enables the collection of data at one point in time. The choice of the design is due to the inability to access the annual financial statement of the study area (COE-Minna Microfinance Bank Ltd. Niger state), coupled with the short period of time in which electronic-based payment system was adopted in the bank. Due to the location of the researcher, time and budgetary limitations, the target population for this study includes all employees/staffs of COE-Minna Microfinance Bank Ltd Niger State, irrespective of cadre. The rationale behind this is to capture all the staffs of the bank, due to the tendencies of being aware of the financial performance of the bank at the adoption of different payment systems. However, considering the size of the population (23), all the staffs which are drawn from the operations, marketing, credit and audit departments will serve as the sample size.
To effectively examine the individual characteristics and responses of the respondents (staffs of the bank), the descriptive statistics will be employed. In addition, to empirically examine the nature and impact of electronic payment systems’ adoption on financial performance of Microfinance bank, the Ordinary Least Square (OLS) technique will be employed. The econometrics model to be estimated is expressed as;
(1)Where; FinPer denotes Financial Performance; EPayS is the Vector of Electronic Payment Systems employed in the MFB. Equally, µi is the error term; i is number of observation; a0 denotes intercept of the equation; and b1 is the slope coefficient of the explanatory variable(s).
To measure financial performance, in term of ROI, ROA, NIM a PAT, weighted average of the financial performance (based on staffs’ response) of the bank during the period under review will be employed. The response of the respondents based on the financial performance of the bank takes the value 3 if growing; 2 if static; 1 if declining; and 0 if unknown, and ranked 4, 3, 2, and 1 respectively. Though subjective, it is assumed that with the nature of the size of the bank, the staffs will not be unaware of the financial status of the bank. Equally, electronic payment system was measured with the use of close-ended question taking the value 1 if an indicated e-payment system is in place and 0 if otherwise.
RESULTS AND DISCUSSION This study observed 20 respondents, which are staffs of COE-Minna Microfinance Bank.
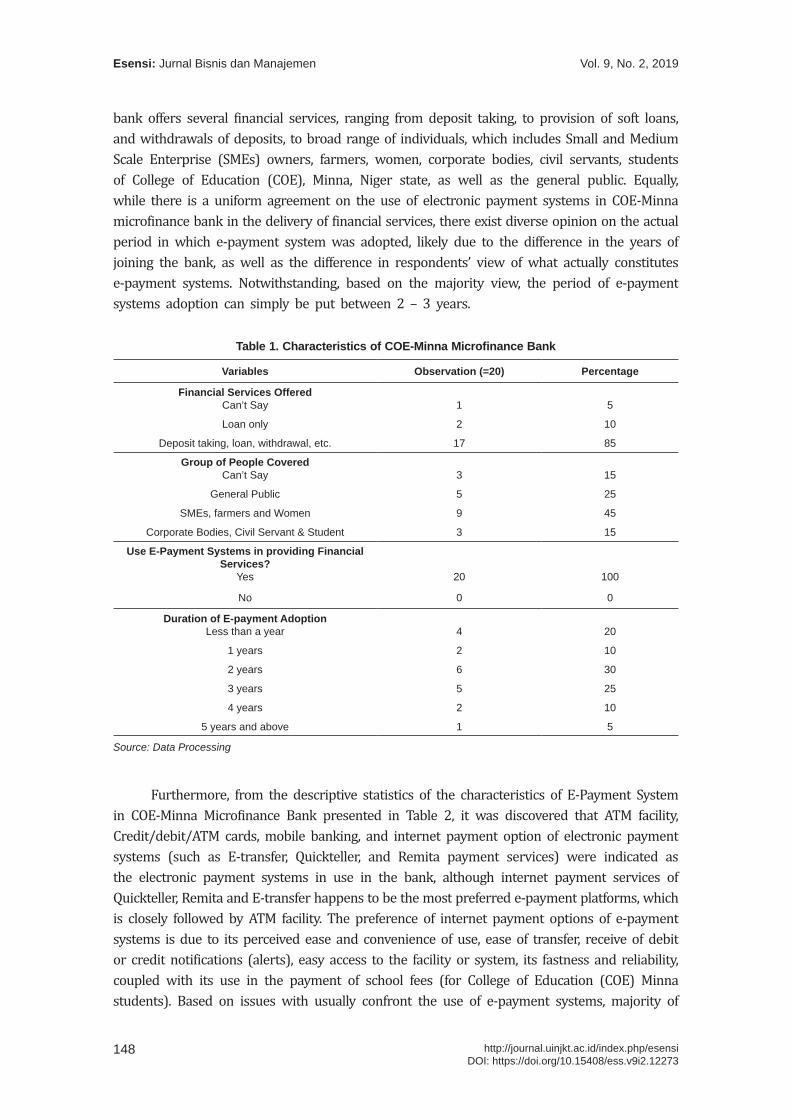
From the result of the descriptive statistics of the characteristics of COE-Minna Microfinance Bank presented in Table 1, based on the response of the staffs, it is shown that the microfinance
Vol. 9, No. 2, 2019Esensi: Jurnal Bisnis dan Manajemen
148 http://journal.uinjkt.ac.id/index.php/esensiDOI: https://doi.org/10.15408/ess.v9i2.12273
bank offers several financial services, ranging from deposit taking, to provision of soft loans, and withdrawals of deposits, to broad range of individuals, which includes Small and Medium Scale Enterprise (SMEs) owners, farmers, women, corporate bodies, civil servants, students of College of Education (COE), Minna, Niger state, as well as the general public. Equally, while there is a uniform agreement on the use of electronic payment systems in COE-Minna microfinance bank in the delivery of financial services, there exist diverse opinion on the actual period in which e-payment system was adopted, likely due to the difference in the years of joining the bank, as well as the difference in respondents’ view of what actually constitutes e-payment systems. Notwithstanding, based on the majority view, the period of e-payment systems adoption can simply be put between 2 – 3 years.
Table 1. Characteristics of COE-Minna Microfinance Bank
Variables Observation (=20) Percentage
Financial Services Offered Can’t Say 1 5
Loan only 2 10
Deposit taking, loan, withdrawal, etc. 17 85
Group of People Covered Can’t Say 3 15
General Public 5 25
SMEs, farmers and Women 9 45
Corporate Bodies, Civil Servant & Student 3 15
Use E-Payment Systems in providing Financial Services?
Yes 20 100
No 0 0
Duration of E-payment AdoptionLess than a year 4 20
1 years 2 10
2 years 6 30
3 years 5 25
4 years 2 10
5 years and above 1 5
Source: Data Processing
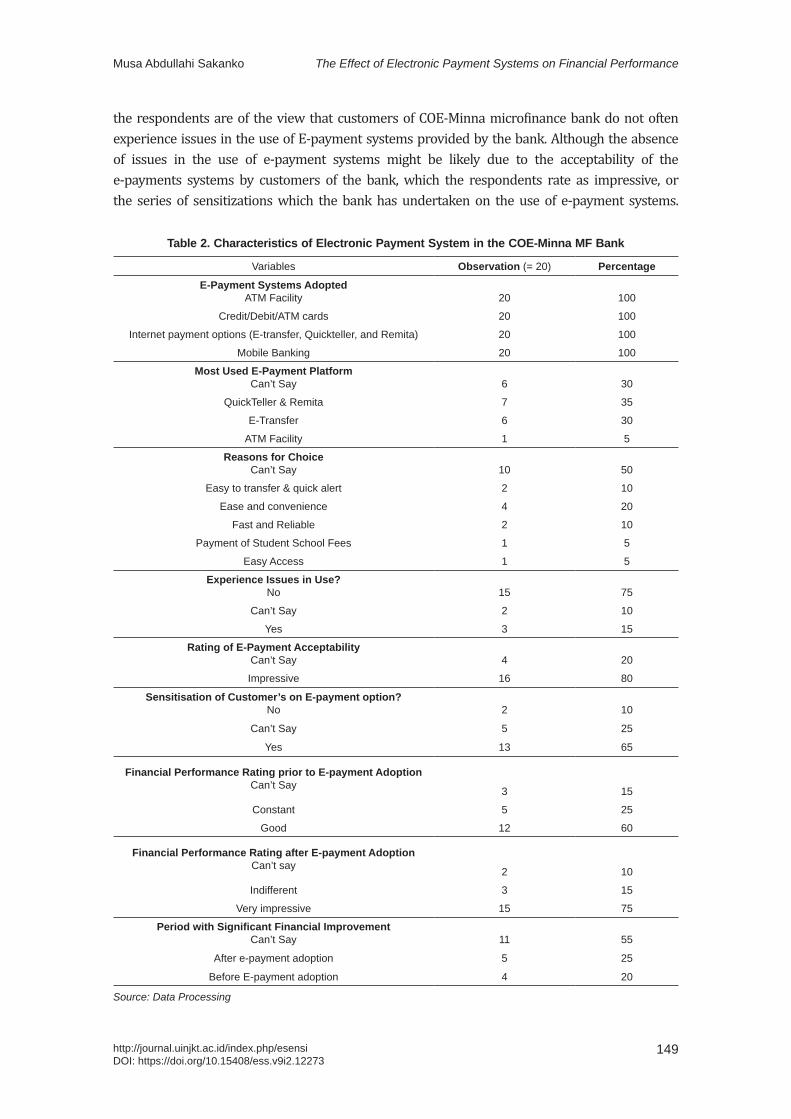
Furthermore, from the descriptive statistics of the characteristics of E-Payment System in COE-Minna Microfinance Bank presented in Table 2, it was discovered that ATM facility, Credit/debit/ATM cards, mobile banking, and internet payment option of electronic payment systems (such as E-transfer, Quickteller, and Remita payment services) were indicated as the electronic payment systems in use in the bank, although internet payment services of Quickteller, Remita and E-transfer happens to be the most preferred e-payment platforms, which is closely followed by ATM facility. The preference of internet payment options of e-payment systems is due to its perceived ease and convenience of use, ease of transfer, receive of debit or credit notifications (alerts), easy access to the facility or system, its fastness and reliability, coupled with its use in the payment of school fees (for College of Education (COE) Minna students). Based on issues with usually confront the use of e-payment systems, majority of
149
The Effect of Electronic Payment Systems on Financial PerformanceMusa Abdullahi Sakanko
http://journal.uinjkt.ac.id/index.php/esensiDOI: https://doi.org/10.15408/ess.v9i2.12273
the respondents are of the view that customers of COE-Minna microfinance bank do not often experience issues in the use of E-payment systems provided by the bank. Although the absence of issues in the use of e-payment systems might be likely due to the acceptability of the e-payments systems by customers of the bank, which the respondents rate as impressive, or the series of sensitizations which the bank has undertaken on the use of e-payment systems.
Table 2. Characteristics of Electronic Payment System in the COE-Minna MF Bank
Variables Observation (= 20) Percentage
E-Payment Systems AdoptedATM Facility 20 100
Credit/Debit/ATM cards 20 100
Internet payment options (E-transfer, Quickteller, and Remita) 20 100
Mobile Banking 20 100
Most Used E-Payment PlatformCan’t Say 6 30
QuickTeller & Remita 7 35
E-Transfer 6 30
ATM Facility 1 5
Reasons for ChoiceCan’t Say 10 50
Easy to transfer & quick alert 2 10
Ease and convenience 4 20
Fast and Reliable 2 10
Payment of Student School Fees 1 5
Easy Access 1 5
Experience Issues in Use?No 15 75
Can’t Say 2 10
Yes 3 15
Rating of E-Payment Acceptability Can’t Say 4 20
Impressive 16 80
Sensitisation of Customer’s on E-payment option?No 2 10
Can’t Say 5 25
Yes 13 65
Financial Performance Rating prior to E-payment AdoptionCan’t Say 3 15
Constant 5 25
Good 12 60
Financial Performance Rating after E-payment Adoption Can’t say 2 10
Indifferent 3 15
Very impressive 15 75
Period with Significant Financial ImprovementCan’t Say 11 55
After e-payment adoption 5 25
Before E-payment adoption 4 20
Source: Data Processing
Vol. 9, No. 2, 2019Esensi: Jurnal Bisnis dan Manajemen
150 http://journal.uinjkt.ac.id/index.php/esensiDOI: https://doi.org/10.15408/ess.v9i2.12273
In addition, with respect to the financial performance of COE-Minna, in term of ROE, ROA, NIM, and PAT, and in-line with the response of the staffs of the bank, it is observed that there exists a significant improvement in the financial performance of the bank after the adoption of e-payment system, in comparison to the period before the adoption of e-payment systems. Although significant number of the staffs are unsure whether there actually exists a significant difference in the bank’s financial performance prior and after the adoption of e-payment system, majority of the staffs were certain in the decrease in the bank’s operational cost, coupled with additional revenue accrued as a results of special charges in the use of the e-payment systems.
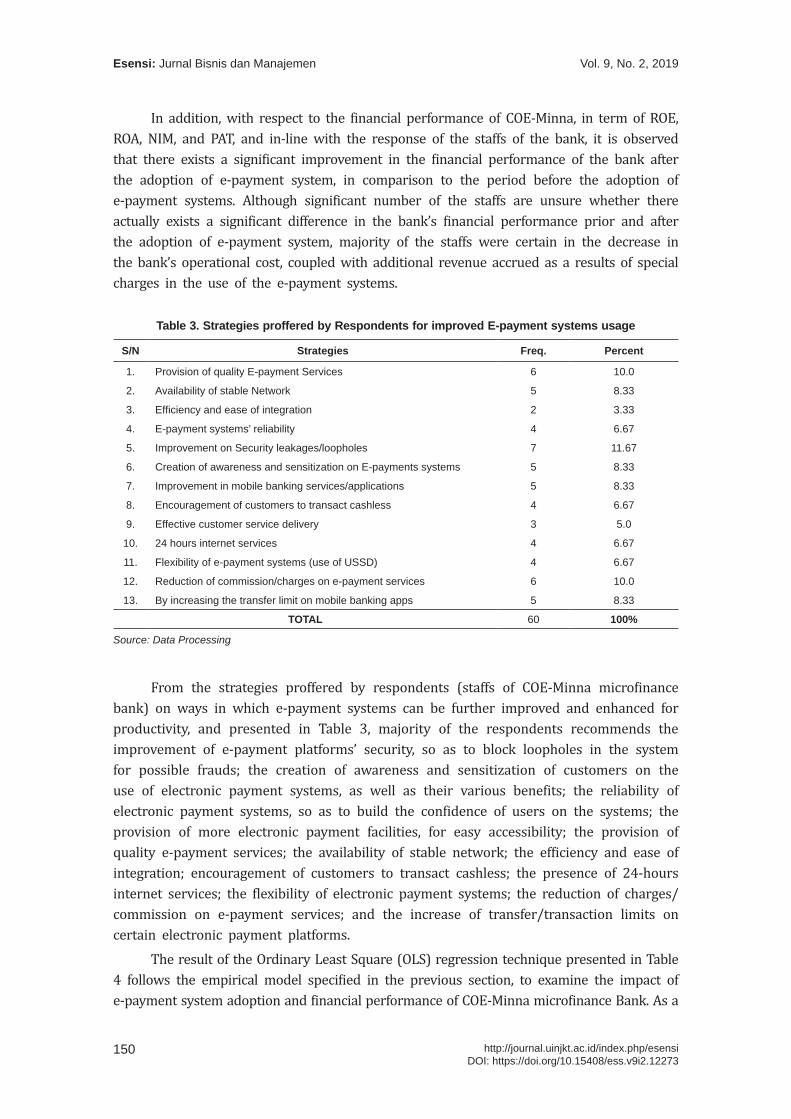
Table 3. Strategies proffered by Respondents for improved E-payment systems usage
S/N Strategies Freq. Percent
1. Provision of quality E-payment Services 6 10.0
2. Availability of stable Network 5 8.33
3. Efficiency and ease of integration 2 3.33
4. E-payment systems’ reliability 4 6.67
5. Improvement on Security leakages/loopholes 7 11.67
6. Creation of awareness and sensitization on E-payments systems 5 8.33
7. Improvement in mobile banking services/applications 5 8.33
8. Encouragement of customers to transact cashless 4 6.67
9. Effective customer service delivery 3 5.0
10. 24 hours internet services 4 6.67
11. Flexibility of e-payment systems (use of USSD) 4 6.67
12. Reduction of commission/charges on e-payment services 6 10.0
13. By increasing the transfer limit on mobile banking apps 5 8.33
TOTAL 60 100%
Source: Data Processing
From the strategies proffered by respondents (staffs of COE-Minna microfinance bank) on ways in which e-payment systems can be further improved and enhanced for productivity, and presented in Table 3, majority of the respondents recommends the improvement of e-payment platforms’ security, so as to block loopholes in the system for possible frauds; the creation of awareness and sensitization of customers on the use of electronic payment systems, as well as their various benefits; the reliability of electronic payment systems, so as to build the confidence of users on the systems; the provision of more electronic payment facilities, for easy accessibility; the provision of quality e-payment services; the availability of stable network; the efficiency and ease of integration; encouragement of customers to transact cashless; the presence of 24-hours internet services; the flexibility of electronic payment systems; the reduction of charges/commission on e-payment services; and the increase of transfer/transaction limits on certain electronic payment platforms.
The result of the Ordinary Least Square (OLS) regression technique presented in Table 4 follows the empirical model specified in the previous section, to examine the impact of e-payment system adoption and financial performance of COE-Minna microfinance Bank. As a

151
The Effect of Electronic Payment Systems on Financial PerformanceMusa Abdullahi Sakanko
http://journal.uinjkt.ac.id/index.php/esensiDOI: https://doi.org/10.15408/ess.v9i2.12273
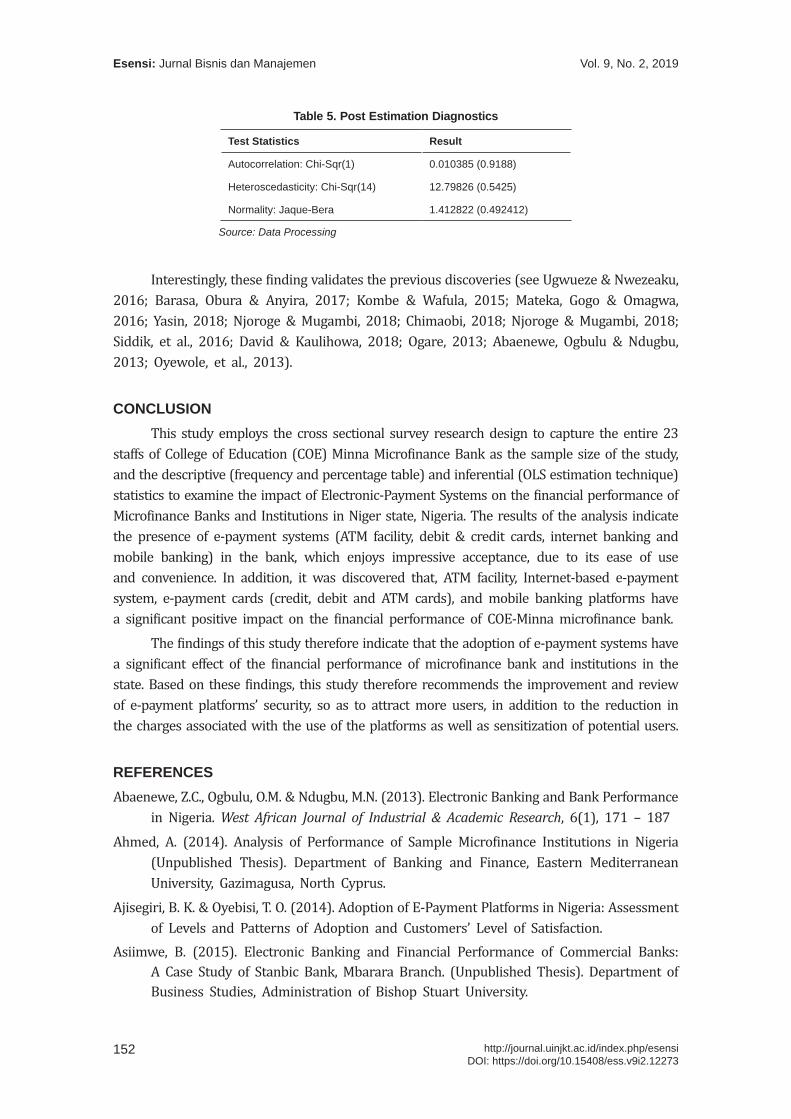
measure of goodness of fit, the value of the R2, in addition to the f-statistics jointly indicates the correctness of the model. Similarly, the diagnostics results reported in Table 5 shows that the model passes the diagnostic tests including serial cor relation (Durbin-Watson stat. and Breusch-Godfrey Serial correlation LM test), normality (Jaque-Bera) and heterosce dasticity (ARCH LM test), indicating the absence of serial/autocorrelation and heteroscedasticity in the model, coupled with the normal distribution of the mean and variance of the error term. In addition, the plot of the Cumulative Sum of Recursive Residuals (CUSUM) and Cumulative Sum of Squares of Recursive Residuals (CUSUMQ) which lies within the 5% significant lines/critical boundaries, therefore confirms the stability of the model.
Table 4. Estimation Result
Variable Coefficient Std. Error t-Statistic Prob.
Constant 0.017562 0.123370 0.142351 0.8883
ARM 0.136137 0.066143 2.058222 0.0591
CARD 0.167866 0.077475 2.166712 0.0392
INTPAY 0.289953 0.103690 2.796346 0.0115
MBANK 0.175900 0.076620 2.295751 0.0332
TELBANK 0.061300 0.085195 0.719524 0.4806
R-squared 0.429036 F-statistic 2.855411
Adjusted R-squared 0.278782 Durbin-Watson stat 2.013236
Source: Data Processing
From the estimation result presented in Table 4, it is shown that Automated Teller Machine (ATM) facility have a positive and statistically significant effect on the financial performance of the microfinance bank. This implies that for a percent change in the use of ATM and POS (Point-Of-Sale) facilities, the financial performance of the microfinance bank will increase by 14 percent. Furthermore, the adoption of credit and debit cards and mobile banking have a positive and statistically significant effect on the financial performance of COE-Minna microfinance bank, at 5 percent significance level. This indicates that for a percent increase in the use of credit and debit cards services as well as the services of mobile banking by customers, it tends to increase the financial performance of the microfinance bank by 17 percent and 18 percent, respectively. In addition, the use and adoption of internet payment (Remita, E-Transfer and Quickteller) options of e-payment systems indicates a strong and statistically significant positive relationship with financial performance of COE-Minna microfinance bank. The implication of this is that for a percent increase in the use of the internet payment option of the system, the financial performance of the bank will grow by 29 percent. Although statistically insignificant, telephone banking also shows a potential positive relationship with financial performance of the bank. The insignificance of the telephone banking is not unconnected with absence of the e-payment service in the bank.
Vol. 9, No. 2, 2019Esensi: Jurnal Bisnis dan Manajemen
152 http://journal.uinjkt.ac.id/index.php/esensiDOI: https://doi.org/10.15408/ess.v9i2.12273
Table 5. Post Estimation Diagnostics
Test Statistics Result
Autocorrelation: Chi-Sqr(1) 0.010385 (0.9188)
Heteroscedasticity: Chi-Sqr(14) 12.79826 (0.5425)
Normality: Jaque-Bera 1.412822 (0.492412)
Source: Data Processing
Interestingly, these finding validates the previous discoveries (see Ugwueze & Nwezeaku, 2016; Barasa, Obura & Anyira, 2017; Kombe & Wafula, 2015; Mateka, Gogo & Omagwa, 2016; Yasin, 2018; Njoroge & Mugambi, 2018; Chimaobi, 2018; Njoroge & Mugambi, 2018; Siddik, et al., 2016; David & Kaulihowa, 2018; Ogare, 2013; Abaenewe, Ogbulu & Ndugbu, 2013; Oyewole, et al., 2013).
CONCLUSION This study employs the cross sectional survey research design to capture the entire 23
staffs of College of Education (COE) Minna Microfinance Bank as the sample size of the study, and the descriptive (frequency and percentage table) and inferential (OLS estimation technique) statistics to examine the impact of Electronic-Payment Systems on the financial performance of Microfinance Banks and Institutions in Niger state, Nigeria. The results of the analysis indicate the presence of e-payment systems (ATM facility, debit & credit cards, internet banking and mobile banking) in the bank, which enjoys impressive acceptance, due to its ease of use and convenience. In addition, it was discovered that, ATM facility, Internet-based e-payment system, e-payment cards (credit, debit and ATM cards), and mobile banking platforms have a significant positive impact on the financial performance of COE-Minna microfinance bank.
The findings of this study therefore indicate that the adoption of e-payment systems have a significant effect of the financial performance of microfinance bank and institutions in the state. Based on these findings, this study therefore recommends the improvement and review of e-payment platforms’ security, so as to attract more users, in addition to the reduction in the charges associated with the use of the platforms as well as sensitization of potential users.
REFERENCESAbaenewe, Z.C., Ogbulu, O.M. & Ndugbu, M.N. (2013). Electronic Banking and Bank Performance
in Nigeria. West African Journal of Industrial & Academic Research, 6(1), 171 – 187Ahmed, A. (2014). Analysis of Performance of Sample Microfinance Institutions in Nigeria
(Unpublished Thesis). Department of Banking and Finance, Eastern Mediterranean University, Gazimagusa, North Cyprus.
Ajisegiri, B. K. & Oyebisi, T. O. (2014). Adoption of E-Payment Platforms in Nigeria: Assessment of Levels and Patterns of Adoption and Customers’ Level of Satisfaction.
Asiimwe, B. (2015). Electronic Banking and Financial Performance of Commercial Banks: A Case Study of Stanbic Bank, Mbarara Branch. (Unpublished Thesis). Department of Business Studies, Administration of Bishop Stuart University.

153
The Effect of Electronic Payment Systems on Financial PerformanceMusa Abdullahi Sakanko
http://journal.uinjkt.ac.id/index.php/esensiDOI: https://doi.org/10.15408/ess.v9i2.12273
Atavachi, B.S. (2013). Effect of Electronic Banking on Financial Performance of Deposit Taking Micro-Finance Institutions in Kenya (Unpublished Thesis). University of Nairobi.
Barasa, C., Obura, W.O. & Anyira, F.A. (2017). Effect of Internet Banking On Financial Performance of Commercial Banks in Kisumu City- Kenya. Saudi Journal of Business and Management Studies, 2(10), 904 – 912. DOI: 10.21276/sjbms.2017.2.10.6
Chimaobi, C.M. (2018). Impact of Internet Banking on Profitability of Commercial Banks in Nigeria: A Study of Zenith Bank Plc [2005 – 2017] (Unpublished Thesis). Godfrey Okoye University Ugwuomu Nike, Enugu.
David, L. & Kaulihowa, T. (2018). The Impact of E- Banking on Commercial Banks’ Performance in Namibia. International Journal of Economics and Financial Research, 4(10), 313-321.
Fatonah, S., Yulandari, A. & Wibowo, F.W. (2018). A Review of E-Payment System in E-Commerce. Journal of Physics: Conference Series 1140. doi:10.1088/1742-6596/1140/1/012033
Fernandes, L. (2013). Fraud in Electronic Payment Transactions:Threat and Countermeasures. Asia Pacific Journal of Marketing and Management Review, 2 (3), 23-32. Cited in Kabir, M.A. & Saidin, S.Z. & Ahmi, A. (2015). Adoption of e-Payment Systems: A Review of Literature. Proceedings of the International Conference on E-Commerce, 112 – 120.
Harelimana, J.B. (2018). The Role of Electronic Payment System on the Financial Performance of Financial Institutions in Rwanda. Global Journal of Management and Business Research: C Finance, 18(1), 52 – 60.
Harelimana, J.B. (2017a). The Impact of Information Communication and Technology Utilization on the Financial Performance of Microfinance Institutions in RwandaCase Study: Reseau Interdiocesain De Microfinance (Rim) Ltd, Rwanda(2011 – 2015). Management and Organizational Studies, 4 (2), 13 – 28. doi:10.5430/mos.v4n2p13.
Harelimana, J.B. (2017b). Impact of Mobile Banking on Financial Performance of Unguka Microfinance Bank Ltd, Rwanda. Global Journal of Management and Business Research: (C) Finance, 17(4), 44 – 56.
Hsiao-Cheng Y., Kuo-Hua H., & Pei-Jen K. (2002). Electronic payment systems: An Analysis and Comparison of Types. Technology in Society, 24, 331–347.
Junadi, S. (2015). A Model of factors influencing consumer’s intention to use e-Payment system in Indonesia. Cited in Fatonah, S., Yulandari, A. &Wibowo, F.W. (2018). A Review of E-Payment System in E-Commerce. Journal of Physics: Conference Series 1140.
Kabir, M.A., Saidin, S.Z. & Ahmi, A. (2015). Adoption of e-Payment Systems: A Review of Literature. Proceedings of the International Conference on E-Commerce, 112 – 120.
Khan, B.U.I., Olanrewaju, R. F., Baba, A.M., Langoo, A.A. & Assad, S. (2017). A Compendious Study of Online Payment Systems: Past Developments, Present Impact, and Future Considerations. International Journal of Advanced Computer Science and Applications (IJACSA), 8(5), 256 – 271.
King’ori, S.N., Kioko, W.C. & Shikumo, H.D. (2017). Determinants of Financial Performance of Microfinance Banks inKenya. Research Journal of Finance and Accounting, 8(16), 1 – 8.
Kombe, S.K. & Wafula, M.K. (2015). Effects of Internet Banking on the Financial Performance of Commercial Banks in Kenya a Case of Kenya Commercial Bank. International Journal of Scientific and Research Publications, 5(5), 1-9.
Mateka, M., Gogo, J. & Omagwa, J. (2016). Effects of Internet Banking on Financial Performance of Listed Commercial Banks in Kenya. American Journal of Finance, 1(2), 53 – 71.
Vol. 9, No. 2, 2019Esensi: Jurnal Bisnis dan Manajemen
154 http://journal.uinjkt.ac.id/index.php/esensiDOI: https://doi.org/10.15408/ess.v9i2.12273
Mawutor, J.K.M. (2014). Impact of E-Banking on the Profitability of Banks in Ghana. Research Journal of Finance and Accounting, 5(22), 53 – 63.
Mohamad, A., Haroon, A. & Najiran, A. (2009). Development ofElectronic Money and its Impact on the Central Bank Roleand Monetary Policy. Issues in Information Science and Information Technology. 6(1), 339-344. Cited in Kabir, M.A. &Saidin, S.Z. &Ahmi, A. (2015). Adoption of e-Payment Systems: A Review of Literature. Proceedings of the International Conference on E-Commerce, 112 – 120.
Njoroge, M. N. & Mugambi, F. (2018). Effect of electronic banking on financial performance in Kenyan commercial banks: Case of Equity bank in its Nairobi Central Business District Branches, Kenya. International Academic Journal of Economics and Finance, 3(2), 197-215
Ogare, H.O. (2013). The Effect of Electronic Banking on the Financial Performance of Commercial Banks in Kenya (Unpublished Thesis). University of Nairobi.
Oyetayo, O. & Fatokun, J. (2015). Cash and Electronic Based Transactions in Nigeria: The Role of a National Aggregator. JORIND, 13(2).
Oyewole, O. S., Abba, M., El-Maude, J. G., & Arikpo, I. A. (2013). E-banking and bank performance: Evidence from Nigeria. International Journal of Scientific Engineering and Technology, 2(8), 766-771.
Sakanko, M.A., Abu, N., & David, J. (2019). Financial Inclusion: A Panacea for National Development in Nigeria. Proceedings of proposed Conference on Emerging Socio-Economics and Political Challenges and National Development, Sept. 22–24, 2019. Faculty of Social Sciences, Federal University Lafia, Nigeria.
Siddik, M.N.A., Sun, G., Kabiraj, S., Shanmugan, J. & Yanjuan, C. (2016). Impacts of E-Banking On Performance Of Banks In A Developing Economy: Empirical Evidence From Bangladesh. Journal of Business Economics and Management, 2016 Volume 17(6): 1066–1080. doi:10.3846/16111699.2015.1068219
Slozko, O. & Pelo, A. (2015). Problems and Risks of Digital Technologies Introduction into E-Payments. Transformations in Business and Economics, 14(1), 42-59. Cited in Kabir, M.A. & Saidin, S.Z. & Ahmi, A. (2015). Adoption of e-Payment Systems: A Review of Literature. Proceedings of the International Conference on E-Commerce, 112 – 120.
Titko, J., Skvarciany, V. & Jureviciene, D.(2015). Drivers of bank profitability: Case of Latvia and Lithuania. Intellectual Economics, 9, 120–129.
Ugwueze, A.C. & Nwezeaku, N. C. (2016). E-Banking and Commercial Bank Performance in Nigeria: A Cointegration and Causality Approach. International Journal of e-Education, e-Business, e-Management and e-Learning, 6(3), 175 – 185. doi: 10.17706/ijeeee.2016.6.3.175-185
Yang, S., Li, Z., Ma, Y. & Chen, X. (2018). Does Electronic Banking Really Improve Bank Performance? Evidence in China. International Journal of Economics and Finance, 10(2), 82 – 94. DOI: 10.5539/ijef.v10n2p82
Yasin, M. A. (2018). Impact of Internet Banking on Financial Performance: Empirical Evidence from Commercial Banks of Ethiopia. Journal of Information Engineering and Applications, Vol.8, No.6, 1 – 8.
I Made Laut Mertha JayaSekolah Tinggi Ilmu Ekonomi Bisnis dan [email protected]
AbstractThe purpose of this study is to know the impact of financial inclusion on public financial services education through financial technology. This research was conducted in Sleman Regency because the area was quite large in Yogyakarta, and was ranked third. This type of research is quantitative research. Data collection methods used are questionnaires and literature studies. Data analyses used in this study are the validity test, reliability test, descriptive statistical test, and SEM (Structural Equation Modeling) analysis test. The results of this study found that financial inclusion has been proven to have no impact on public financial services education. However, financial inclusion has proven to have a significant impact on financial technology in Sleman Regency in 2018. In addition, financial inclusion through financial technology has also proven to have a positive impact on public financial service education in Sleman Regency in 2018.Keywords: financial inclusion, financial technology, public financial services education
AbstrakTujuan dari penelitian ini adalah untuk mengetahui dampak inklusi keuangan pada pendidikan layanan keuangan publik melalui teknologi keuangan. Penelitian ini dilakukan di Kabupaten Sleman karena wilayahnya cukup besar di Yogyakarta, dan berada di peringkat ketiga. Jenis penelitian ini adalah penelitian kuantitatif. Metode pengumpulan data yang digunakan adalah kuesioner dan studi literatur. Analisis data yang digunakan dalam penelitian ini adalah uji validitas, uji reliabilitas, uji statistik deskriptif, dan uji analisis SEM (Structural Equation Modeling). Hasil penelitian ini menemukan bahwa inklusi keuangan telah terbukti tidak berdampak pada pendidikan layanan keuangan publik. Namun, inklusi keuangan telah terbukti memiliki dampak signifikan pada teknologi keuangan di Kabupaten Sleman pada tahun 2018. Selain itu, inklusi keuangan melalui teknologi keuangan juga terbukti memiliki dampak positif pada pendidikan layanan keuangan publik di Kabupaten Sleman pada tahun 2018.Kata kunci: keuangan inklusi, teknologi keuangan, pendidikan layanan keuangan publik
The Impact of Financial Inclusion on Public Financial Services Education through Financial Technology in Sleman Regency, Indonesia
First draft: August 20, 2019; Revision: September 30, 2019; Accepted: October 20, 2019http://journal.uinjkt.ac.id/index.php/esensiDOI: https://doi.org/10.15408/ess.v9i2.13576
Esensi: Jurnal Bisnis dan ManajemenVolume 9 (2), 2019
P-ISSN: 2087-2038; E-ISSN:2461-1182Halaman 155 - 174
Vol. 9, No. 2, 2019Esensi: Jurnal Bisnis dan Manajemen
156 http://journal.uinjkt.ac.id/index.php/esensiDOI: https://doi.org/10.15408/ess.v9i2.13576
INTRODUCTIONFinancial Inclusion after the economic crisis occurred in 2008 adversely affected the
financial stability in Indonesia. When the financial stability of a country is unstable and does not perform efficiently, it can cause the fund allocation process to not work well. According to Bank Indonesia (2014), financial inclusion is all efforts made to remove all forms of obstacles that are reviewed based on price and non-price aspects to maximize the benefits and access to services of formal financial institutions for the community. The Inclusive Financial goals are: First, achieve economic growth through equal distribution of income; Second, poverty alleviation; Third, financial system stability (Bank Indonesia, 2014).
Meanwhile, the general goal of financial inclusion is to spread the economic growth in several regions in one country. This policy is widely used in countries that have a low annual gross income level, and most of the populations still live in remote areas, they do not have legal identity document, and many people still live in urban suburbs, so they generally belong to “unbanked” society.
Unbanked society is all citizens who do not have traditional bank accounts or access to banking services. This is because they have gained very low level of education, so they only work in the informal business sector, and live with minimum financial conditions. So, this condition also has an impact on the difficulties to fulfill their life needs. On the other hand, they also have difficulty in obtaining access to banking services because they are in the community which is classified as the “unbanked”. Generally they do not believe in the banking system. Another factor is the financial service infrastructure system that is still limited to reach them.
Based on the results of a survey conducted by the World Bank (2010), it shows that Indonesian family who are having access to formal financial institutions is only 49% (percent). Similar things were also found by Bank Indonesia in the Family Balance Sheet Survey (2011), which shows that the percentage of family who save in formal financial institution and non-financial institutions are only 48 % (percent). So, people who have no savings at all (unbanked) either at the bank or at Non-bank financial institutions are still relatively very high at 51-52% (percent). For those reasons, it is clear that the informal sector actually serves more customers than the banking sector. These results led to the ideas that the government should immediately set the inclusive financial strategies, and encourage economic activity among the society who have not enjoyed financial services yet to accelerate income equity and poverty alleviation in Indonesia.
An inclusive financial inclusion strategy is described in 6 pillars, namely; financial education, public financial facilities, a map of financial information, supporting policies/regulation, intermediation and distribution facilities, and consumer’s protection (Bank Indonesia, 2014). In building a sustainable inclusive financial program, Bank of Indonesia, the ministries, and other related institutions should make a great team and coordination in order to make some development, priority determination and program implementation. In addition, monitoring activities and program evaluation are needed regularly. So, the improvement of access for the unbanked people to get financial services can be maximally achieved.
The survey results of Mc Kinsey & Company (2015) concluded that since 2011
157
The Impact of Financial Inclusion on Public FinancialI Made Laut Mertha Jaya
http://journal.uinjkt.ac.id/index.php/esensiDOI: https://doi.org/10.15408/ess.v9i2.13576
the adoption of digital-banking services has been increased rapidly throughout Asia. The customers switch to use computers, smart phones and tablets in their interactions with banks. So, the activity of visiting the branch office and talking via telephone lines to enjoy banking services began to decrease.
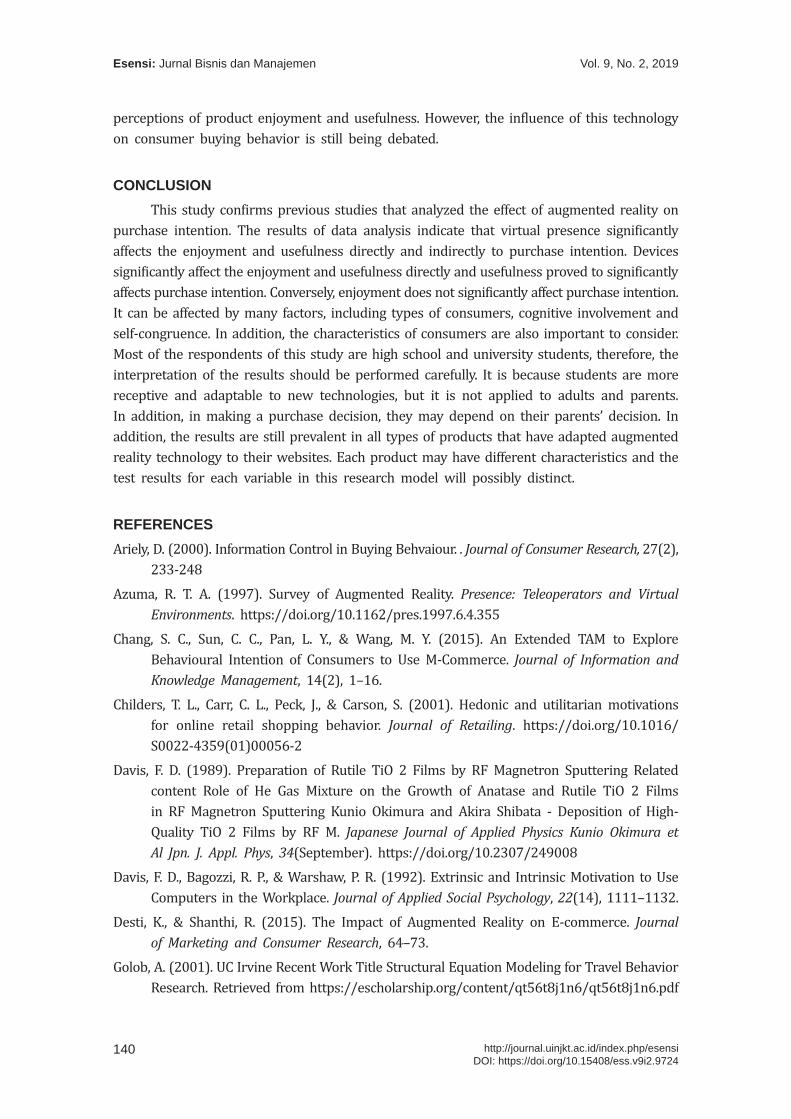
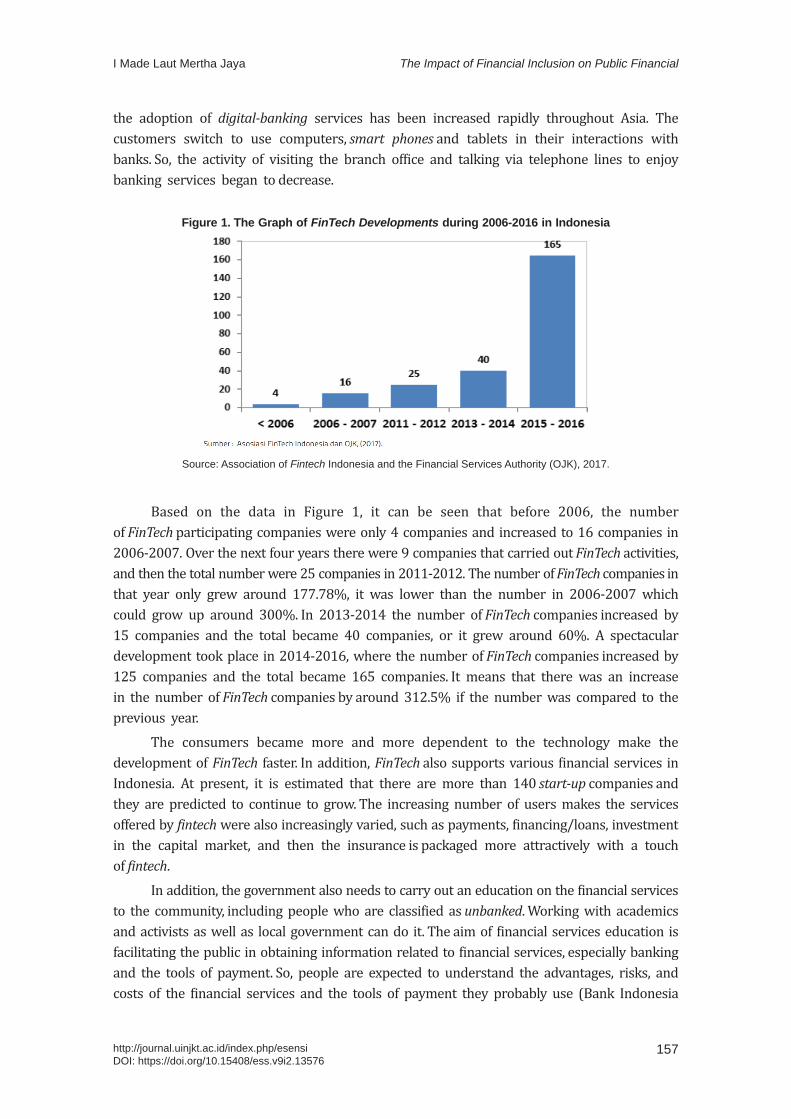
Figure 1. The Graph of FinTech Developments during 2006-2016 in Indonesia
Source: Association of Fintech Indonesia and the Financial Services Authority (OJK), 2017.
Based on the data in Figure 1, it can be seen that before 2006, the number of FinTech participating companies were only 4 companies and increased to 16 companies in 2006-2007. Over the next four years there were 9 companies that carried out FinTech activities, and then the total number were 25 companies in 2011-2012. The number of FinTech companies in that year only grew around 177.78%, it was lower than the number in 2006-2007 which could grow up around 300%. In 2013-2014 the number of FinTech companies increased by 15 companies and the total became 40 companies, or it grew around 60%. A spectacular development took place in 2014-2016, where the number of FinTech companies increased by 125 companies and the total became 165 companies. It means that there was an increase in the number of FinTech companies by around 312.5% if the number was compared to the previous year.
The consumers became more and more dependent to the technology make the development of FinTech faster. In addition, FinTech also supports various financial services in Indonesia. At present, it is estimated that there are more than 140 start-up companies and they are predicted to continue to grow. The increasing number of users makes the services offered by fintech were also increasingly varied, such as payments, financing/loans, investment in the capital market, and then the insurance is packaged more attractively with a touch of fintech.
In addition, the government also needs to carry out an education on the financial services to the community, including people who are classified as unbanked. Working with academics and activists as well as local government can do it. The aim of financial services education is facilitating the public in obtaining information related to financial services, especially banking and the tools of payment. So, people are expected to understand the advantages, risks, and costs of the financial services and the tools of payment they probably use (Bank Indonesia

Vol. 9, No. 2, 2019Esensi: Jurnal Bisnis dan Manajemen
158 http://journal.uinjkt.ac.id/index.php/esensiDOI: https://doi.org/10.15408/ess.v9i2.13576
2018). Financial education is considered as one of the strategies to be able to improve capability in managing finance which begins with an improvement of understanding (knowledge) and public awareness about financial products and services.
This research was conducted in Sleman Regency because the area is quite large, and it has got the third rank. The administrative area of Sleman Regency reaches 574.82 km2. Furthermore, Sleman Regency has a large population which is around 1,141,718 people and spread over 17 sub districts, 86 villages and they are divided into 59 villages that are categorized as urban, and 27 villages are still rural (Sleman Regency statistics, 2016:1). However, other data stated that the amount of savings made by the people in Sleman Regency is still smaller than the loan amount. It is verified by statistical data from Sleman Regency in 2016 which showed that the amount of savings is 92,312,087 million and the number of loans is 140,129,269 million. Thus, it can be concluded that knowledge and awareness about finance as an indicator of financial education is still quite low. The government along with the team should provide knowledge as the indicators of financial education mentioned previously in very simple way and clearly so the people will understand and apply them easily.
Based on the description above, then further studies are needed to be able to provide empirical evidence of the effects of financial inclusion on public financial services education through FinTech in the community in Sleman Regency. So, the purpose of this research is to know the effect of financial inclusion on public financial services education through financial technology.
THEORETICAL FRAMEWORKDifferent types of development elements can improve markets, the financial system
naturally influences the allocation of resources throughout time and spaces. The existence of Bank increases the acceleration of information about the company and the manager will change it into the form of credit allocation. Financial System has some advantages such as it can handle investment information, capital allocation, investment control, and it can also draw management report of a company. In addition, the financial system is also able to facilitate trade, diversification and risk management, mobilize savings, and facilitate the exchange of goods and services.
Thiel (2001) explains that by using the approach of financial institution relations with information and costs of asymmetric agents can provide a more prominent role of the financial system in achieving efficient capital allocation. Financial institutions tend to accumulate specialized knowledge in evaluating and monitoring investment projects that have comparative advantages for evaluating risks and designing financial contracts. In certain cases, bank industry activities can get some benefits from the ongoing information. Thus, increasing the efficiency of the financial system can lead to the growth of a country’s Gross Domestic Product (GDP).
Economic growth is a growth of long-term capacity to provide various economic goods to meet the needs of its population. It also determined by the possibility of advances and adjustments in technology, institution, and ideology toward the existing sequences

159
The Impact of Financial Inclusion on Public FinancialI Made Laut Mertha Jaya
http://journal.uinjkt.ac.id/index.php/esensiDOI: https://doi.org/10.15408/ess.v9i2.13576
(Kuznet, 1971). Institutional development can be reviewed through the financial industry sector. If the establishment of a system is done in a very good order, it can support the accomplishment of economic transaction funding for economic actors. The financial system consists of units of financial institutions such as banking institutions and other financial institutions, and markets that interact each other with the aim of channeling funds for investment, and they will provide payment system facilities for productive activities (Beck, et al, 2000; Buckland, et al, 2005).
Modigliani (1986) argues that the understanding on the conception of economic growth emphasizes behavioral finance portfolio in terms of investment and savings. It is stated in The life-cycle permanent income theory of consumption and saving. This view describes the choice of how to maintain a stable standard of living in dealing with various income changes in a person’s life time. It also illustrates the relationship between income, consumption and savings. The life cycle hypothesis involves individuals in planning consumption and savings behavior in the long term, as described in the following figure.
The financial system functions to channel funds from savers to borrowers to pay for the productive activities. There are 3 (three) ways in channeling funds from savers to borrowers, namely: First, direct Finance, the owner of the funds (surplus units) directly lend the fund to the borrower (deficit unit) without the intervention of a financial intermediary, so there will be a submission of evidence of debt, such as bonds, stocks, or promissory note to the owner of the funds. The evidence is primary securities.
Second, semi direct finance, the process to transfer the funds borrowed from surplus unit to deficit unit will be assisted by an individual or institution intermediary. There are two ways to do this process, it is through an investment bank or broker/dealer. If you use the services of an investment bank, then the transaction is known as the primary market. The Primary Market is a financial market that issues first-time securities and it is sold to the first buyer, and it is called IPO (Initial Public Offering). If the process is done by the broker / dealer services, the transaction is known as the secondary market (secondary market), which is a financial market that sells securities and has been issued by the exchange. Brokers are agents of investors who bring together buyers and sellers of securities, while dealers are those who link up the buyers and sellers of securities by buying and selling at the time of the transaction.
Third, indirect finance, the transfer process of loan from surplus units to deficit unit through a financial intermediary, such as banks, insurance companies, retirement funds, securities financing, and mutual funds. Formal financial institutions, both banks and non-banks, have an important role in the financial system to make the financial structure foundation accessible to the public and economic actors (Cheng and Degryse, 2006).
Financial inclusion is a trend after the crisis occurred in 2008. It is based on the impact of the crisis for the groups called in the bottom of the pyramid. This group is generally unbanked and actually recorded very high outside the developed countries. Financial inclusion according to World Bank (2008) cited by Supartoyo et al (2013) is a comprehensive activity that aims to eliminate all form of obstacles both in the form of price and non price in providing the access for the community to use or utilize formal financial services.
A financial inclusion exists because there is financial exclusion. According to the World
Vol. 9, No. 2, 2019Esensi: Jurnal Bisnis dan Manajemen
160 http://journal.uinjkt.ac.id/index.php/esensiDOI: https://doi.org/10.15408/ess.v9i2.13576
Bank (2005), around 3 billion people in the world do not have access to formal financial services. Financial exceptions include savings, credit, banking transactions, and insurance (World Bank, 2005). Financial exclusion is the inability to access formal financial institutions due to various obstacles, such as conditions, prices, marketing, and obstacles from the perceptions of individuals and other entities.
Financial inclusion is one of the strategies to encourage economic growth through equal distribution of income, poverty alleviation and financial system stability. Low financial inclusion will cause high-income inequality (Kempson et al., 2004). Thus, countries that have low levels of inequality tend to have relatively high financial inclusion (Buckland et al, 2005). The level of financial inclusion can increase in response to a country’s prosperity and inequality reduction. The informal sector is also able to contribute a large share of employment in some underdeveloped countries that do not facilitate the process of financial inclusion (ILO, 2002). In developed countries, the formal financial sector serves the majority of the population, while in developing countries, especially low income groups have simple access to formal and informal financial institutions (Peachy and Roe, 2004). Thus, financial inclusion is not an option, but becomes a necessity and banking is the main driver that is able to implement it (Nengsih, 2015).
Education concept is an investment (education as Investments) and has been growing rapidly. Some countries believe that the development of the education sector must be built before other sectors. The concept of investing in human capital (human capital investment) that can support economic growth has actually begun to be considered since the era of Adam Smith (1776) and classical economists before the 19th century that emphasized the importance of investing in human skills. A speech entitled “Investments in Human Capital” is the basic theory of modern human capital. The main message of the speech is simple, it shows that the process of acquiring knowledge and skills through education is not a form of consumption that will spend the budget, but an investment.
In developed countries, a paradigm that calls the education as a consumptive aspect has shifted. Education becomes Human Capital Investment and it is one of the main sectors. Therefore, the government’s attention to the development of the education sector began to increase starting from budget for the education sector that was not lower than other sectors anymore, so that the success of education investment correlated with the progress of its macro development.
Education and socialization of Financial Literacy is currently still held by the Financial Services Authority (OJK), which has established regulations for Financial Service Providers (PUJK). However, the number of PUJK that submitted the Education Plan report was only 438 PUJK out of 2,333 PUJK in Indonesia or around 15.78%. It shows that the level of obedience to the requirements of education and consumer protection is still low. Educational activities that have been carried out still have misunderstanding between educational activities and marketing, so the purpose of Financial Literacy education is often not achieved (OJK, 2015).
The level of financial literacy of each person is different. Huston (2010) explains that some factors such as habits, cognitive, economy, family, peers, communities, and institutions can affect the financial habits (financial behavior) of a person. Meanwhile, Monticone (2010) explains that the financial literacy level of a person is influenced by demographic characteristics

161
The Impact of Financial Inclusion on Public FinancialI Made Laut Mertha Jaya
http://journal.uinjkt.ac.id/index.php/esensiDOI: https://doi.org/10.15408/ess.v9i2.13576
(gender, ethnicity, education and cognitive abilities), family background, wealth, and time preference. Capuano and Ramsay (2011) explain that personal factors (intelligence and cognitive abilities), social and economy can influence a person’s financial literacy and financial behavior. So an individual can be said to be financial literate when someone has the knowledge and ability to apply that knowledge.
FinTech is defined as technological innovation in terms of financial services that can generate business models, applications, processes or products with material effects associated with the provision of financial services (FSB, 2017a). The evolution of FinTech was originated from credit card innovation in the 1960s, debit cards and the terminal that provides cash such as automatic teller machine / ATM in the 1970s (Arner et al, 2015; FSB, 2107b). Then it is followed by the existence of telephone banking in the 1980s and various financial products following the capital market deregulation and bonds in the 1990s. Next, Internet banking appears which drives the existence of branchless banking and banking activities carried out remotely. These changes make the transaction in the bank office and face-to-face interaction between the customers and the bank officers are no longer necessary. In addition, there is high technology of mobile devices that make financial transactions easier.
The change has encouraged the beginning of direct financing and direct intermediation, which predicted to replace indirect, expensive and inefficient financial intermediation (FSB, 2017b). There are two main factors that bring the evolution in financial technology innovation (Bernanke, 2009; Awrey, 2013; De Haan, et al, 2015; FSB, 2017a; and 2107b), they are demand and supply side.
The factors that were originated from the demand side consist of: First, consumers’ preference change which influences consumers’ demand towards innovation. Easy internet access and internet network users’ ability to make a real time transaction has built high expectations especially about the comfort, speed, cheaper cost, and ease of using financial services. On the other hand, preference changes also occur because of the influence of demographic factors that affect the demand such as bigger acceptance from the group who originally grow with the digital technology (digital natives) and the millennial.
Second, technological evolution. Technology innovation in financial services has growth rapidly. The development is carrying out new ways and also taking advantages of different business models, for example business models that use big data technology, artificial technology (AI), machine learning, cloud computing and biometrics. In addition, different innovation is also applied to another new technology, it is DLT (He, et al., 2017 and Griffoli, 2017). Business models and new technology applications are possibly creating a lot of new actors in the financial service sectors. Famous magazine, the Economist (Issue 9 May 2015) states that technological advances in the field of financial services have the potential to democratize finance. The combination of a number of technologies along with devices access that are on the consumers’ hand, such as mobile phones and other mobile devices that connect to the Internet have added a new dimension to the digital world. Greater connectivity allows new forms of service provision.
The main targets of inclusive financial programs in Indonesia are migrant workers and people who live in remote areas. This inclusive finance program starts from the category of unbanked community groups, this group consists of productive workers but they are still poor,
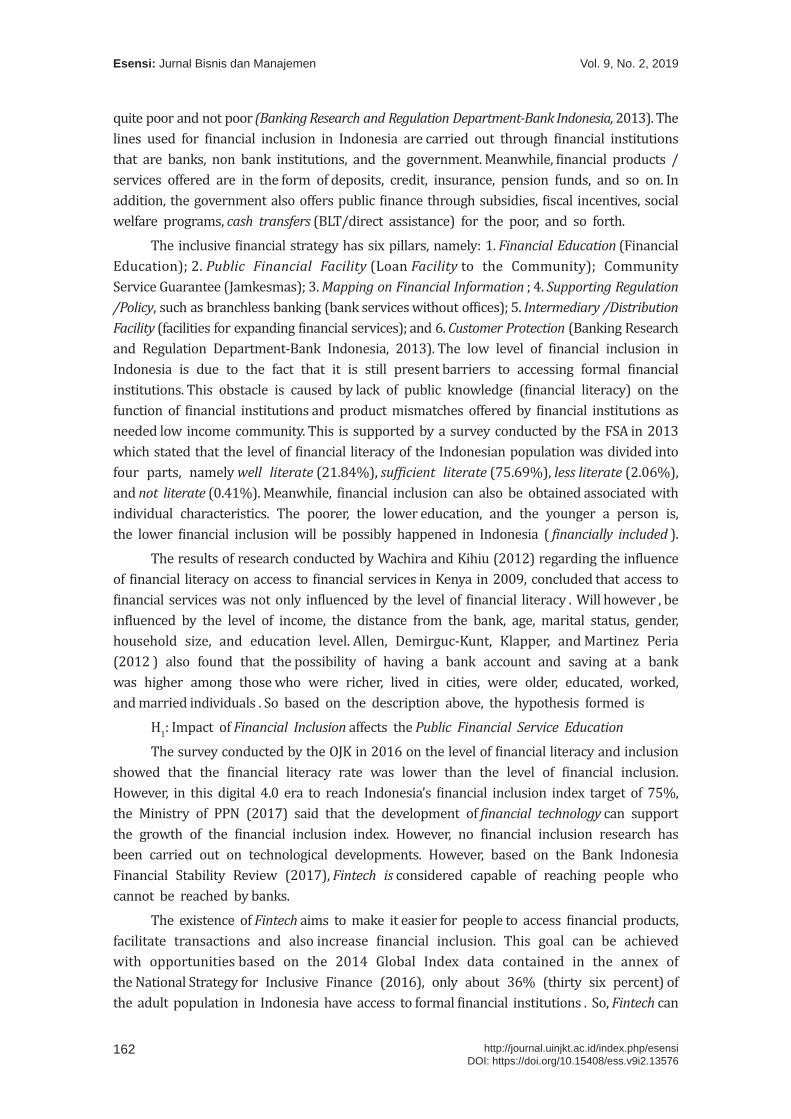
Vol. 9, No. 2, 2019Esensi: Jurnal Bisnis dan Manajemen
162 http://journal.uinjkt.ac.id/index.php/esensiDOI: https://doi.org/10.15408/ess.v9i2.13576
quite poor and not poor (Banking Research and Regulation Department-Bank Indonesia, 2013). The lines used for financial inclusion in Indonesia are carried out through financial institutions that are banks, non bank institutions, and the government. Meanwhile, financial products / services offered are in the form of deposits, credit, insurance, pension funds, and so on. In addition, the government also offers public finance through subsidies, fiscal incentives, social welfare programs, cash transfers (BLT/direct assistance) for the poor, and so forth.
The inclusive financial strategy has six pillars, namely: 1. Financial Education (Financial Education); 2. Public Financial Facility (Loan Facility to the Community); Community Service Guarantee (Jamkesmas); 3. Mapping on Financial Information ; 4. Supporting Regulation /Policy, such as branchless banking (bank services without offices); 5. Intermediary /Distribution Facility (facilities for expanding financial services); and 6. Customer Protection (Banking Research and Regulation Department-Bank Indonesia, 2013). The low level of financial inclusion in Indonesia is due to the fact that it is still present barriers to accessing formal financial institutions. This obstacle is caused by lack of public knowledge (financial literacy) on the function of financial institutions and product mismatches offered by financial institutions as needed low income community. This is supported by a survey conducted by the FSA in 2013 which stated that the level of financial literacy of the Indonesian population was divided into four parts, namely well literate (21.84%), sufficient literate (75.69%), less literate (2.06%), and not literate (0.41%). Meanwhile, financial inclusion can also be obtained associated with individual characteristics. The poorer, the lower education, and the younger a person is, the lower financial inclusion will be possibly happened in Indonesia ( financially included ).
The results of research conducted by Wachira and Kihiu (2012) regarding the influence of financial literacy on access to financial services in Kenya in 2009, concluded that access to financial services was not only influenced by the level of financial literacy . Will however , be influenced by the level of income, the distance from the bank, age, marital status, gender, household size, and education level. Allen, Demirguc-Kunt, Klapper, and Martinez Peria (2012 ) also found that the possibility of having a bank account and saving at a bank was higher among those who were richer, lived in cities, were older, educated, worked, and married individuals . So based on the description above, the hypothesis formed is
H1: Impact of Financial Inclusion affects the Public Financial Service Education
The survey conducted by the OJK in 2016 on the level of financial literacy and inclusion showed that the financial literacy rate was lower than the level of financial inclusion. However, in this digital 4.0 era to reach Indonesia’s financial inclusion index target of 75%, the Ministry of PPN (2017) said that the development of financial technology can support the growth of the financial inclusion index. However, no financial inclusion research has been carried out on technological developments. However, based on the Bank Indonesia Financial Stability Review (2017), Fintech is considered capable of reaching people who cannot be reached by banks.
The existence of Fintech aims to make it easier for people to access financial products, facilitate transactions and also increase financial inclusion. This goal can be achieved with opportunities based on the 2014 Global Index data contained in the annex of the National Strategy for Inclusive Finance (2016), only about 36% (thirty six percent) of the adult population in Indonesia have access to formal financial institutions . So, Fintech can
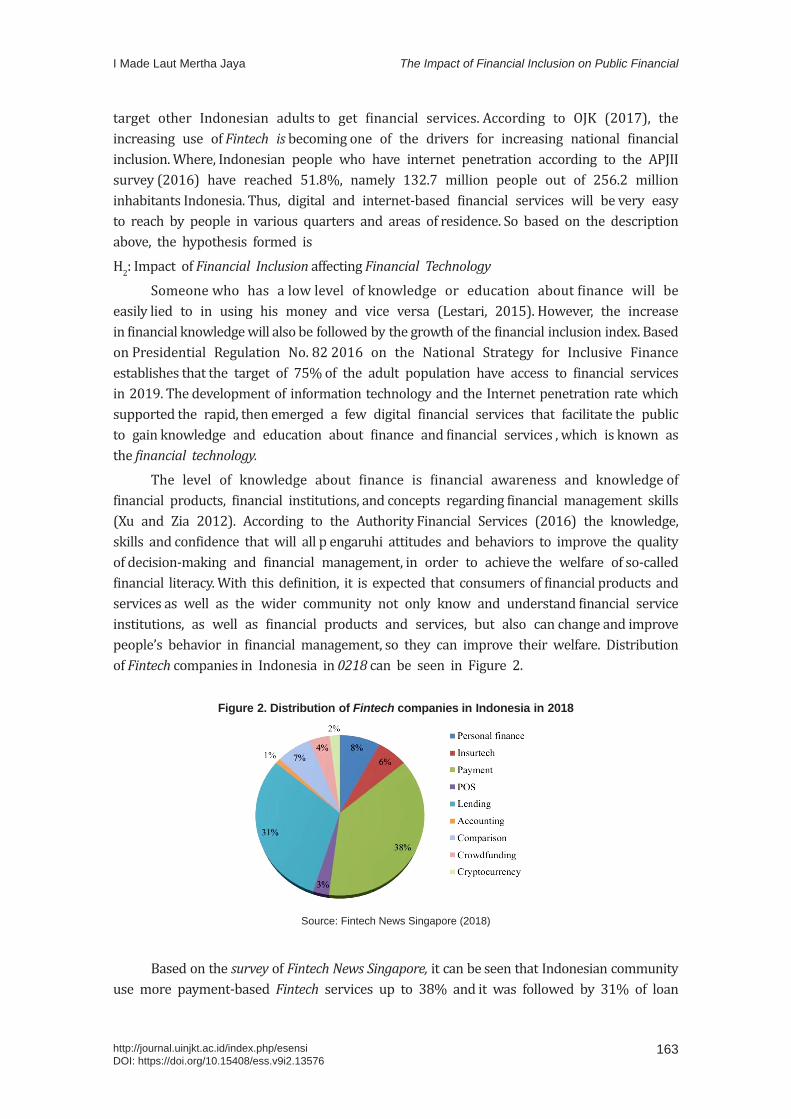
163
The Impact of Financial Inclusion on Public FinancialI Made Laut Mertha Jaya
http://journal.uinjkt.ac.id/index.php/esensiDOI: https://doi.org/10.15408/ess.v9i2.13576
target other Indonesian adults to get financial services. According to OJK (2017), the increasing use of Fintech is becoming one of the drivers for increasing national financial inclusion. Where, Indonesian people who have internet penetration according to the APJII survey (2016) have reached 51.8%, namely 132.7 million people out of 256.2 million inhabitants Indonesia. Thus, digital and internet-based financial services will be very easy to reach by people in various quarters and areas of residence. So based on the description above, the hypothesis formed isH2: Impact of Financial Inclusion affecting Financial Technology
Someone who has a low level of knowledge or education about finance will be easily lied to in using his money and vice versa (Lestari, 2015). However, the increase in financial knowledge will also be followed by the growth of the financial inclusion index. Based on Presidential Regulation No. 82 2016 on the National Strategy for Inclusive Finance establishes that the target of 75% of the adult population have access to financial services in 2019. The development of information technology and the Internet penetration rate which supported the rapid, then emerged a few digital financial services that facilitate the public to gain knowledge and education about finance and financial services , which is known as the financial technology.
The level of knowledge about finance is financial awareness and knowledge of financial products, financial institutions, and concepts regarding financial management skills (Xu and Zia 2012). According to the Authority Financial Services (2016) the knowledge, skills and confidence that will all p engaruhi attitudes and behaviors to improve the quality of decision-making and financial management, in order to achieve the welfare of so-called financial literacy. With this definition, it is expected that consumers of financial products and services as well as the wider community not only know and understand financial service institutions, as well as financial products and services, but also can change and improve people’s behavior in financial management, so they can improve their welfare. Distribution of Fintech companies in Indonesia in 0218 can be seen in Figure 2.
Figure 2. Distribution of Fintech companies in Indonesia in 2018
Source: Fintech News Singapore (2018)
Based on the survey of Fintech News Singapore, it can be seen that Indonesian community use more payment-based Fintech services up to 38% and it was followed by 31% of loan
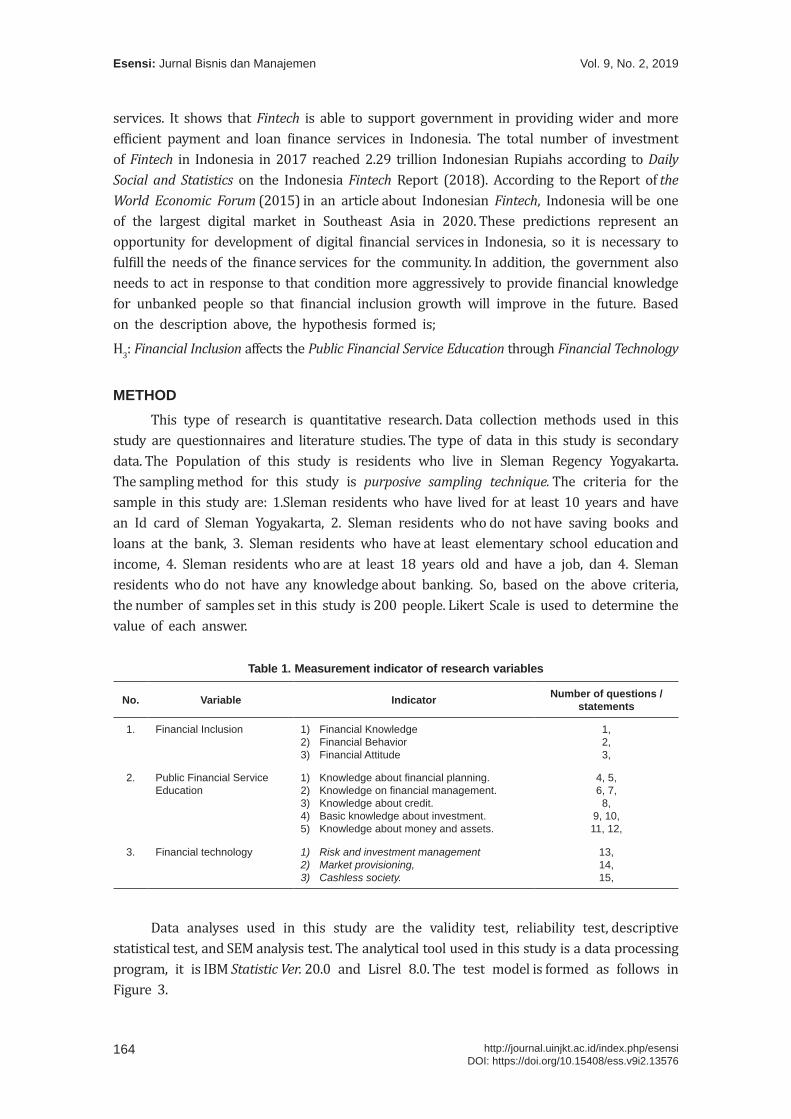
Vol. 9, No. 2, 2019Esensi: Jurnal Bisnis dan Manajemen
164 http://journal.uinjkt.ac.id/index.php/esensiDOI: https://doi.org/10.15408/ess.v9i2.13576
services. It shows that Fintech is able to support government in providing wider and more efficient payment and loan finance services in Indonesia. The total number of investment of Fintech in Indonesia in 2017 reached 2.29 trillion Indonesian Rupiahs according to Daily Social and Statistics on the Indonesia Fintech Report (2018). According to the Report of the World Economic Forum (2015) in an article about Indonesian Fintech, Indonesia will be one of the largest digital market in Southeast Asia in 2020. These predictions represent an opportunity for development of digital financial services in Indonesia, so it is necessary to fulfill the needs of the finance services for the community. In addition, the government also needs to act in response to that condition more aggressively to provide financial knowledge for unbanked people so that financial inclusion growth will improve in the future. Based on the description above, the hypothesis formed is;H3: Financial Inclusion affects the Public Financial Service Education through Financial Technology
METHODThis type of research is quantitative research. Data collection methods used in this
study are questionnaires and literature studies. The type of data in this study is secondary data. The Population of this study is residents who live in Sleman Regency Yogyakarta. The sampling method for this study is purposive sampling technique. The criteria for the sample in this study are: 1.Sleman residents who have lived for at least 10 years and have an Id card of Sleman Yogyakarta, 2. Sleman residents who do not have saving books and loans at the bank, 3. Sleman residents who have at least elementary school education and income, 4. Sleman residents who are at least 18 years old and have a job, dan 4. Sleman residents who do not have any knowledge about banking. So, based on the above criteria, the number of samples set in this study is 200 people. Likert Scale is used to determine the value of each answer.
Table 1. Measurement indicator of research variables
No. Variable Indicator Number of questions / statements
1. Financial Inclusion 1) Financial Knowledge2) Financial Behavior3) Financial Attitude
1,2,3,
2. Public Financial Service Education
1) Knowledge about financial planning.2) Knowledge on financial management.3) Knowledge about credit.4) Basic knowledge about investment.5) Knowledge about money and assets.
4, 5,6, 7,8,
9, 10,11, 12,
3. Financial technology 1) Risk and investment management2) Market provisioning,3) Cashless society.
13,14,15,
Data analyses used in this study are the validity test, reliability test, descriptive statistical test, and SEM analysis test. The analytical tool used in this study is a data processing program, it is IBM Statistic Ver. 20.0 and Lisrel 8.0. The test model is formed as follows in Figure 3.
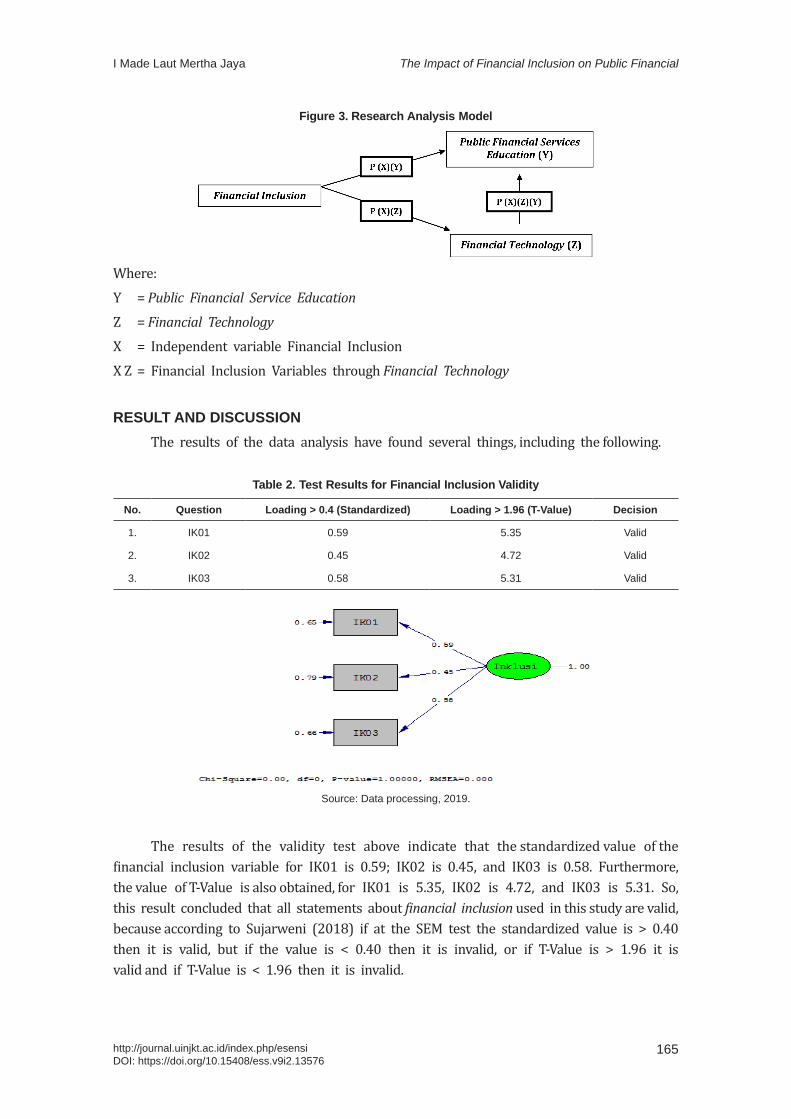
165
The Impact of Financial Inclusion on Public FinancialI Made Laut Mertha Jaya
http://journal.uinjkt.ac.id/index.php/esensiDOI: https://doi.org/10.15408/ess.v9i2.13576
Figure 3. Research Analysis Model
Where:Y = Public Financial Service Education
Z = Financial Technology X = Independent variable Financial InclusionX Z = Financial Inclusion Variables through Financial Technology
RESULT AND DISCUSSIONThe results of the data analysis have found several things, including the following.
Table 2. Test Results for Financial Inclusion Validity
No. Question Loading > 0.4 (Standardized) Loading > 1.96 (T-Value) Decision
1. IK01 0.59 5.35 Valid
2. IK02 0.45 4.72 Valid
3. IK03 0.58 5.31 Valid
Source: Data processing, 2019.
The results of the validity test above indicate that the standardized value of the financial inclusion variable for IK01 is 0.59; IK02 is 0.45, and IK03 is 0.58. Furthermore, the value of T-Value is also obtained, for IK01 is 5.35, IK02 is 4.72, and IK03 is 5.31. So, this result concluded that all statements about financial inclusion used in this study are valid, because according to Sujarweni (2018) if at the SEM test the standardized value is > 0.40 then it is valid, but if the value is < 0.40 then it is invalid, or if T-Value is > 1.96 it is valid and if T-Value is < 1.96 then it is invalid.
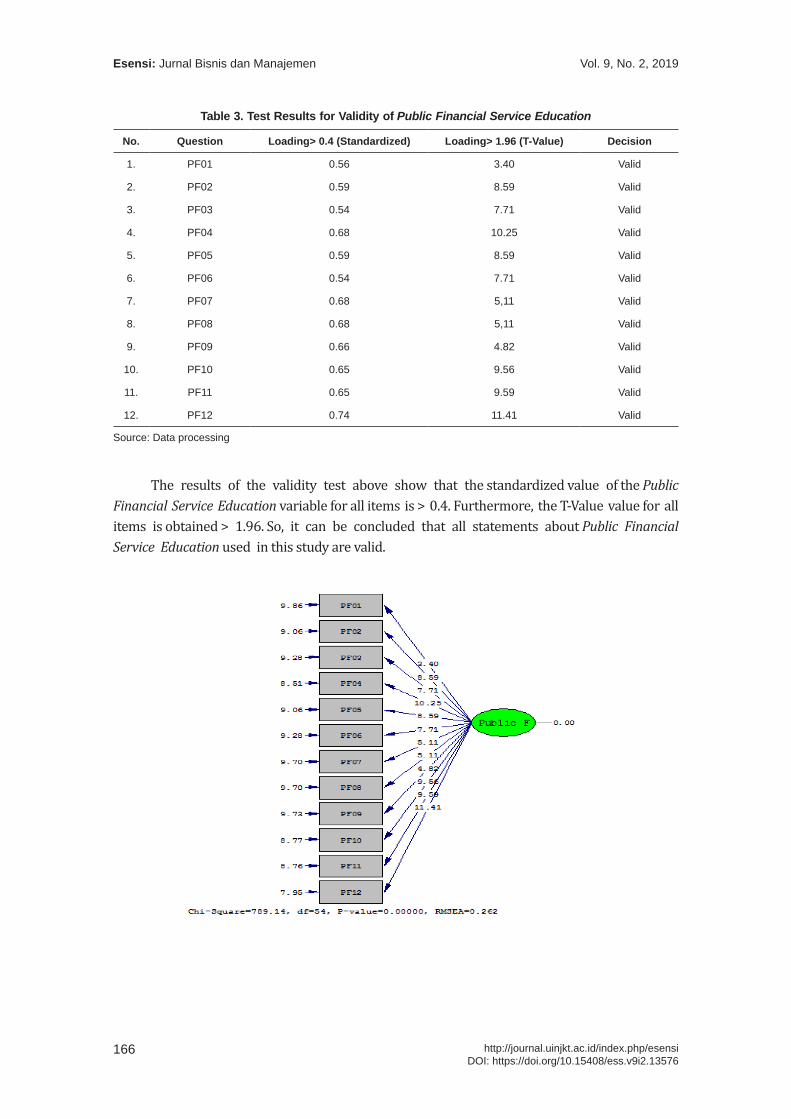
Vol. 9, No. 2, 2019Esensi: Jurnal Bisnis dan Manajemen
166 http://journal.uinjkt.ac.id/index.php/esensiDOI: https://doi.org/10.15408/ess.v9i2.13576
Table 3. Test Results for Validity of Public Financial Service Education
No. Question Loading> 0.4 (Standardized) Loading> 1.96 (T-Value) Decision
1. PF01 0.56 3.40 Valid
2. PF02 0.59 8.59 Valid
3. PF03 0.54 7.71 Valid
4. PF04 0.68 10.25 Valid
5. PF05 0.59 8.59 Valid
6. PF06 0.54 7.71 Valid
7. PF07 0.68 5,11 Valid
8. PF08 0.68 5,11 Valid
9. PF09 0.66 4.82 Valid
10. PF10 0.65 9.56 Valid
11. PF11 0.65 9.59 Valid
12. PF12 0.74 11.41 Valid
Source: Data processing
The results of the validity test above show that the standardized value of the Public Financial Service Education variable for all items is > 0.4. Furthermore, the T-Value value for all items is obtained > 1.96. So, it can be concluded that all statements about Public Financial Service Education used in this study are valid.
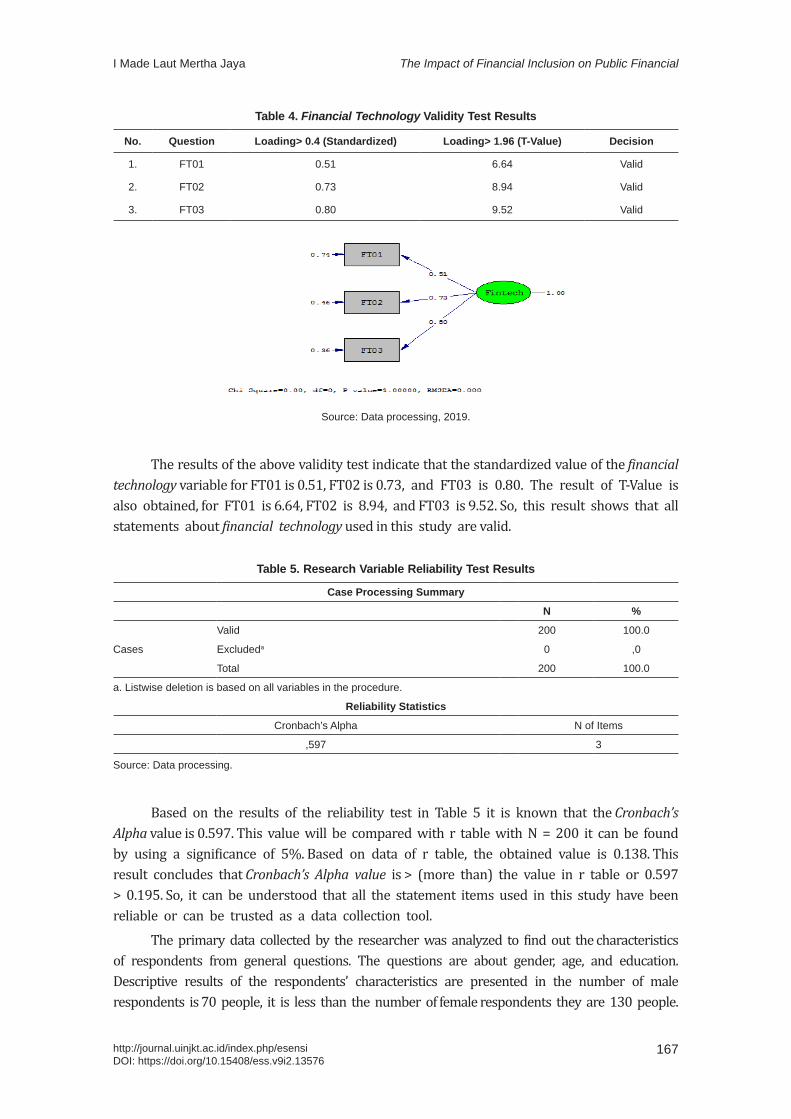
167
The Impact of Financial Inclusion on Public FinancialI Made Laut Mertha Jaya
http://journal.uinjkt.ac.id/index.php/esensiDOI: https://doi.org/10.15408/ess.v9i2.13576
Table 4. Financial Technology Validity Test Results
No. Question Loading> 0.4 (Standardized) Loading> 1.96 (T-Value) Decision
1. FT01 0.51 6.64 Valid
2. FT02 0.73 8.94 Valid
3. FT03 0.80 9.52 Valid
Source: Data processing, 2019.
The results of the above validity test indicate that the standardized value of the financial technology variable for FT01 is 0.51, FT02 is 0.73, and FT03 is 0.80. The result of T-Value is also obtained, for FT01 is 6.64, FT02 is 8.94, and FT03 is 9.52. So, this result shows that all statements about financial technology used in this study are valid.
Table 5. Research Variable Reliability Test Results
Case Processing Summary
N %
Cases
Valid 200 100.0
Excludeda 0 ,0
Total 200 100.0
a. Listwise deletion is based on all variables in the procedure.
Reliability Statistics
Cronbach’s Alpha N of Items
,597 3
Source: Data processing.
Based on the results of the reliability test in Table 5 it is known that the Cronbach’s Alpha value is 0.597. This value will be compared with r table with N = 200 it can be found by using a significance of 5%. Based on data of r table, the obtained value is 0.138. This result concludes that Cronbach’s Alpha value is > (more than) the value in r table or 0.597 > 0.195. So, it can be understood that all the statement items used in this study have been reliable or can be trusted as a data collection tool.
The primary data collected by the researcher was analyzed to find out the characteristics of respondents from general questions. The questions are about gender, age, and education. Descriptive results of the respondents’ characteristics are presented in the number of male respondents is 70 people, it is less than the number of female respondents they are 130 people.
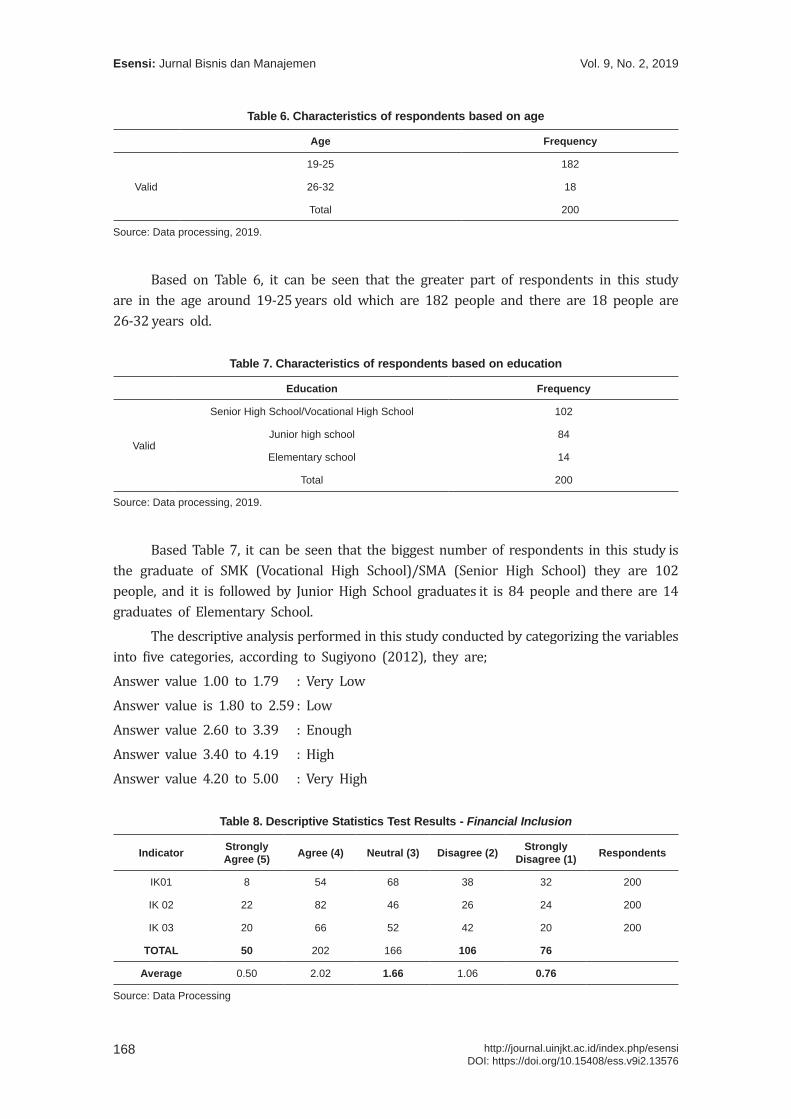
Vol. 9, No. 2, 2019Esensi: Jurnal Bisnis dan Manajemen
168 http://journal.uinjkt.ac.id/index.php/esensiDOI: https://doi.org/10.15408/ess.v9i2.13576
Table 6. Characteristics of respondents based on age
Age Frequency
Valid
19-25 182
26-32 18
Total 200
Source: Data processing, 2019.
Based on Table 6, it can be seen that the greater part of respondents in this study are in the age around 19-25 years old which are 182 people and there are 18 people are 26-32 years old.
Table 7. Characteristics of respondents based on education
Education Frequency
Valid
Senior High School/Vocational High School 102
Junior high school 84
Elementary school 14
Total 200
Source: Data processing, 2019.
Based Table 7, it can be seen that the biggest number of respondents in this study is the graduate of SMK (Vocational High School)/SMA (Senior High School) they are 102 people, and it is followed by Junior High School graduates it is 84 people and there are 14 graduates of Elementary School.
The descriptive analysis performed in this study conducted by categorizing the variables into five categories, according to Sugiyono (2012), they are;Answer value 1.00 to 1.79 : Very LowAnswer value is 1.80 to 2.59 : LowAnswer value 2.60 to 3.39 : EnoughAnswer value 3.40 to 4.19 : HighAnswer value 4.20 to 5.00 : Very High
Table 8. Descriptive Statistics Test Results - Financial Inclusion
Indicator Strongly Agree (5) Agree (4) Neutral (3) Disagree (2) Strongly
Disagree (1) Respondents
IK01 8 54 68 38 32 200
IK 02 22 82 46 26 24 200
IK 03 20 66 52 42 20 200
TOTAL 50 202 166 106 76
Average 0.50 2.02 1.66 1.06 0.76
Source: Data Processing
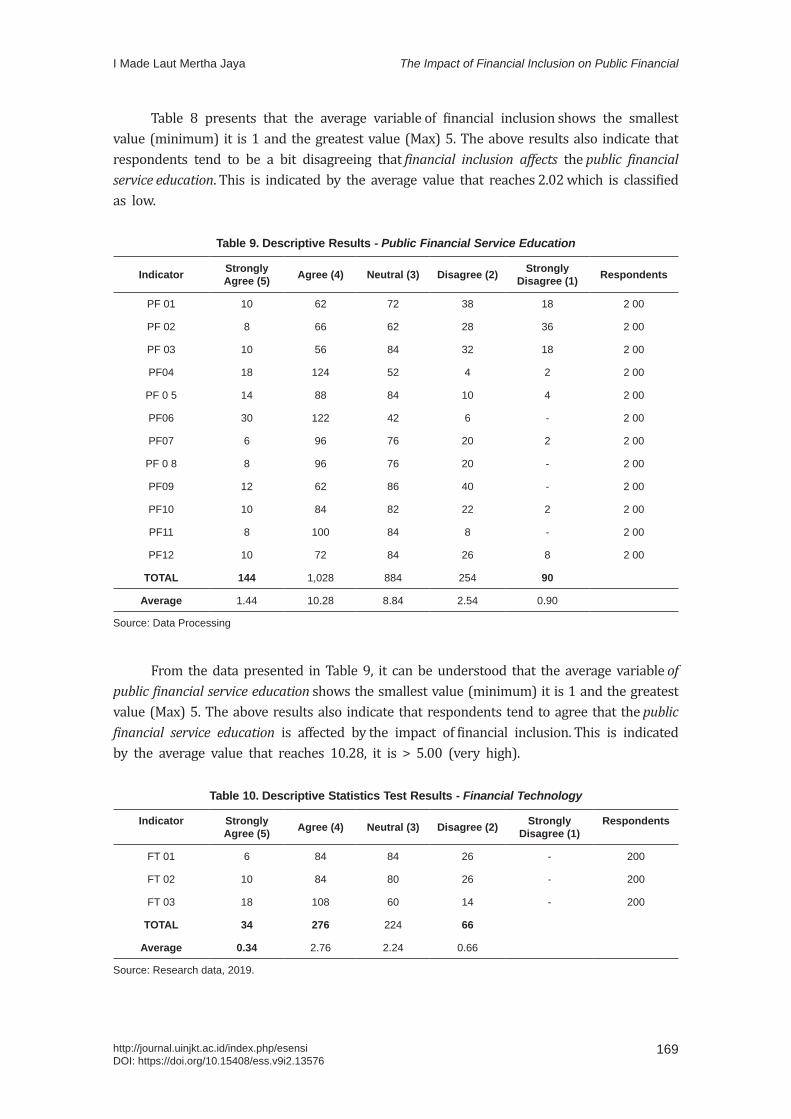
169
The Impact of Financial Inclusion on Public FinancialI Made Laut Mertha Jaya
http://journal.uinjkt.ac.id/index.php/esensiDOI: https://doi.org/10.15408/ess.v9i2.13576
Table 8 presents that the average variable of financial inclusion shows the smallest value (minimum) it is 1 and the greatest value (Max) 5. The above results also indicate that respondents tend to be a bit disagreeing that financial inclusion affects the public financial service education. This is indicated by the average value that reaches 2.02 which is classified as low.
Table 9. Descriptive Results - Public Financial Service Education
Indicator Strongly Agree (5) Agree (4) Neutral (3) Disagree (2) Strongly
Disagree (1) Respondents
PF 01 10 62 72 38 18 2 00
PF 02 8 66 62 28 36 2 00
PF 03 10 56 84 32 18 2 00
PF04 18 124 52 4 2 2 00
PF 0 5 14 88 84 10 4 2 00
PF06 30 122 42 6 - 2 00
PF07 6 96 76 20 2 2 00
PF 0 8 8 96 76 20 - 2 00
PF09 12 62 86 40 - 2 00
PF10 10 84 82 22 2 2 00
PF11 8 100 84 8 - 2 00
PF12 10 72 84 26 8 2 00
TOTAL 144 1,028 884 254 90
Average 1.44 10.28 8.84 2.54 0.90
Source: Data Processing
From the data presented in Table 9, it can be understood that the average variable of public financial service education shows the smallest value (minimum) it is 1 and the greatest value (Max) 5. The above results also indicate that respondents tend to agree that the public financial service education is affected by the impact of financial inclusion. This is indicated by the average value that reaches 10.28, it is > 5.00 (very high).
Table 10. Descriptive Statistics Test Results - Financial Technology
Indicator Strongly Agree (5) Agree (4) Neutral (3) Disagree (2) Strongly
Disagree (1)Respondents
FT 01 6 84 84 26 - 200
FT 02 10 84 80 26 - 200
FT 03 18 108 60 14 - 200
TOTAL 34 276 224 66
Average 0.34 2.76 2.24 0.66
Source: Research data, 2019.
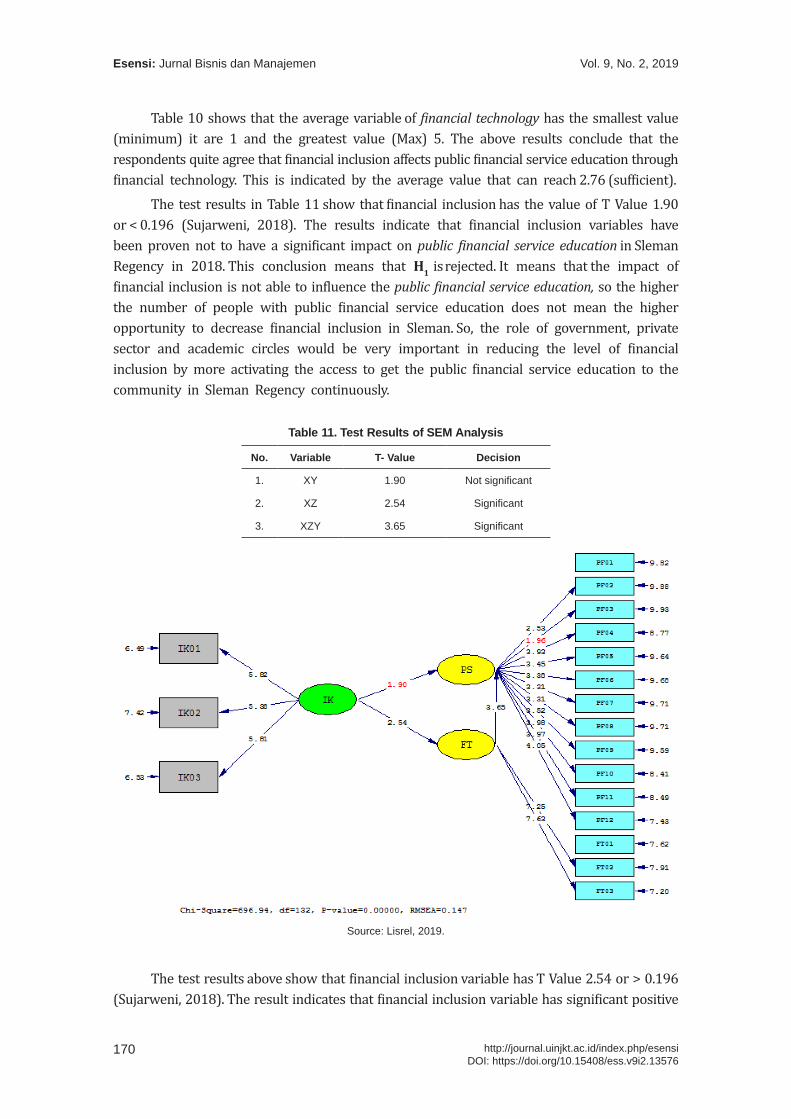
Vol. 9, No. 2, 2019Esensi: Jurnal Bisnis dan Manajemen
170 http://journal.uinjkt.ac.id/index.php/esensiDOI: https://doi.org/10.15408/ess.v9i2.13576
Table 10 shows that the average variable of financial technology has the smallest value (minimum) it are 1 and the greatest value (Max) 5. The above results conclude that the respondents quite agree that financial inclusion affects public financial service education through financial technology. This is indicated by the average value that can reach 2.76 (sufficient).
The test results in Table 11 show that financial inclusion has the value of T Value 1.90 or < 0.196 (Sujarweni, 2018). The results indicate that financial inclusion variables have been proven not to have a significant impact on public financial service education in Sleman Regency in 2018. This conclusion means that H1 is rejected. It means that the impact of financial inclusion is not able to influence the public financial service education, so the higher the number of people with public financial service education does not mean the higher opportunity to decrease financial inclusion in Sleman. So, the role of government, private sector and academic circles would be very important in reducing the level of financial inclusion by more activating the access to get the public financial service education to the community in Sleman Regency continuously.
Table 11. Test Results of SEM Analysis
No. Variable T- Value Decision
1. XY 1.90 Not significant
2. XZ 2.54 Significant
3. XZY 3.65 Significant
Source: Lisrel, 2019.
The test results above show that financial inclusion variable has T Value 2.54 or > 0.196 (Sujarweni, 2018). The result indicates that financial inclusion variable has significant positive

171
The Impact of Financial Inclusion on Public FinancialI Made Laut Mertha Jaya
http://journal.uinjkt.ac.id/index.php/esensiDOI: https://doi.org/10.15408/ess.v9i2.13576
impact on financial technology in Sleman in 2018. It means that H2 is accepted. The impact of financial inclusion can be undergone through financial technology. Financial technology is one form of technological modernization, so that it can be used as a way to facilitate the government and the private sector in overcoming financial inclusion in Sleman Regency.
Model Summary
Model R R Square Adjusted R Square Std. Error of the Estimate
1 ,183a ,034 ,029 1,778
a. Predictors: (Constant), IK_X
Source: Data Processing
The results above found that the influence of financial inclusion toward the financial technology is 0.034 or 3.4 %. These results prove that financial inclusion is the smallest factor that drives the emergence of financial technology in Sleman Regency. Meanwhile, there are many other factors which further strengthen the existence of financial technology in Sleman. Thus, this fact provides a gap for other researchers to find the most powerful factors triggering the emergence of financial technology, especially in Sleman.
The test results above indicate that financial inclusion through financial technology as an intervening against public education financials service has the T Value at 3.65 or > 0.196 (Sujarweni, 2018). These results indicate that financial inclusion variables through financial technology proven have a positive significant impact on public financial service education in Sleman Regency in 2018. This conclusion means that H 3 is accepted. It means that financial technology has proven to be able to integrate the relationship between financial inclusion and public financial services education.
Model Summary
Model R R Square Adjusted R Square Std. Error of the Estimate
1 ,679a ,461 ,458 3,850
a. Predictors: (Constant), XZ
Source: Data Processing
Based on the coefficient of determination test results above, it can also be found that there is a great effect of the financial inclusion to the public financial service education through financial technology, it is 0.461 or 46.1 %. These results prove that the role of financial technology in intervening the impact of financial inclusion on financial technology in Sleman Regency in 2018 is quite large, and almost dominates. This result means that financial technology is very good at playing a role in reducing the level of financial inclusion and is considered as an effective form of public financial services education for community in Sleman Regency in 2018.
Vol. 9, No. 2, 2019Esensi: Jurnal Bisnis dan Manajemen
172 http://journal.uinjkt.ac.id/index.php/esensiDOI: https://doi.org/10.15408/ess.v9i2.13576
CONCLUSIONBased on the results of the tests and analyzes that have been carried out, some conclusions
are found, and they are: First, the variable of financial inclusion has proven to have no significant impact on public financials services education for the people in Sleman Regency in 2018. Second, the variable of financial inclusion has proven to have a positive significant impact on financial technology in Sleman Regency in 2018. Third, financial inclusion variable through financial technology has proven to have a positive significant impact on public financial service education in Sleman Regency in 2018.
So, it can be understood that public financial service education is not capable to fully reduce the level of financial inclusion in Sleman Regency. So the role of government, private sector and academia is essential to help in reducing the level of financial inclusion by providing more intensified access to public education financials service constantly to the public in Sleman. On the other hand, financial inclusion actually has an impact on the emergence of current financial technology. So, it becomes very helpful since it can assist people to obtain financial services and financial knowledge. In addition, the role of financial technology is also regarded as a form of public financials service education through technological modernization in the industrial revolution 4.0 today. Thus, the modernization of technology is an appropriate and easy step for the people to apply in several developed and developing countries. In accordance with Ozili’s research (2018) entitled Impact of Digital Finance on Financial Inclusion and Stability, it can be found that in the current era of digital finance, Fintech has a positive effect on financial inclusion in several developing and developed countries.
The weakness of this study is in the part of filling out the questionnaire. It is because respondents have difficulty in understanding about research topics and lack of updates to information. This is quite difficult for researcher to provide simple explanations about financial inclusion. So, it is expected that if there is further research about the similar field, the appointed respondents can understand more about financial and financial inclusion simply.
REFERENCESAllen, Franklin, Asli Demirguc-Kunt, Leora Klapper, and Maria Soledad Martinez Peria. 2012.
“The Foundations of Financial Inclusion: Understanding Ownership and Use of Formal Accounts.” World Bank Policy Research Working Paper.
Arner, D.W., Barberis, J., and Buckley, R.P. (2015). The evolution of FinTech : A new post-crises paradigm?. University of Hong Kong.
Awrey, D. (2013). Toward a supply-side theory of financial innovation. Journal of Comparative Economics Vol. 41(2). pp. 401–419
Bank Indonesia. (2014). Booklet Keuangan Inklusif. Departemen Pengembangan Akses Keuangan dan UMKM.
Bank Indonesia. (2018). Laporan Publikasi. Jakarta: Bank IndonesiaBeck T., Demirgüç-Kunt A., Levine R. (2000). A New Database on the Structure and Development
of the Financial Sector. World Bank Economic Review 14 (3), 597-605.
173
The Impact of Financial Inclusion on Public FinancialI Made Laut Mertha Jaya
http://journal.uinjkt.ac.id/index.php/esensiDOI: https://doi.org/10.15408/ess.v9i2.13576
Bernanke, B. S. (2009). Financial innovation and consumer protection. Speech at the Federal Reserve System’s Sixth Biennial Community Affairs Research Conference, Washington, D.C., 17 April 2009
Brigham dan Houston. (2010). Dasar-dasar Manajemen Keuangan Buku 1 (edisi II). Jakarta: Salemba Empat.
Buckland, J., Guenther, B., Boichev, G., Geddie, H. dan Mutch, M. (2005). There are no banks here‟: financial and insurance exclusion services in Winnipeg‟s North End. Winnipeg Inner-city Research Alliance
Capuano, A., & Ramsay, I. (2011). What Causes Suboptimal Financial Behaviour? An Exploration of Financial Literacy Social Influences And Behavioural Economics.
Cheng X., & Degryse, H. (2006). The Impact of Bank and Non-Bank Financial Institutions on Local Economic Growth in China
De Haan, J. Oosterloo, S., & Schoenmaker, D. (2015). Financial markets and institutions : A European perspective. 3rd edition, Cambridge: Cambridge University Press.
Financial Stability Board [FSB]. (2017a). FinTech credit : Market structure, business models and financial stability implications. May 2017.
Financial Stability Board [FSB]. (2017b). Financial stability implications from fintech. 27 June 2017. Griffoli, T. M. (2017). Banking on change. Finance & Development (September), Vol. 54, No.
3. Washington DC, International Monetary Funds
He, D., et al. (2017). Fintech and financial services: Initial considerations. IMF Staff Discussion Notes No. 17/05 (June). Washington DC, International Monetary Funds.
Kempson E, A. Atkinson., & Pilley, O. (2004). Policy level response to financial exclusion in developed economies: lessons for developing countries. Report of Personal Finance Research Centre, University of Bristol.
Merton, Robert C., and Zvi Bodie. (1995). Financial Infrastructure and Public Policy: A Functional Perspective. In The Global Financial System: A Functional Perspective.
Modigliani, F. (1986). Life Cycle, Individual Thrift and The Wealth of Nations. American Economic Review, Vol. 76, hal. 297-217.
Monticone, C. (2010). Financial Literacy and Financial Advice Theory and Empirical Evidence. Nengsih, Novia. (2015). Peran Perbankan Syariah dalam Mengimplementasikan Keuangan
Inklusif di Indonesia. Etikonomi, 14(2): 221-240. Ozili, Peterson Kitakogelu. (2018). Impact of Digital Finance on Financial Inclusion and
Stability. University of Essex. MPRA Paper No. 84771.Peachey, Stephen and A. Roe. (2004). Access to Finance: A Study for the World Savings Banks
Institute. Oxford:Oxford Policy Management, October.Smith, A. (1776). An Inquiry into the Nature of Causes of the Wealth of Nations in Skusen,
M. (2005). Sang Maestro Teori-teori Ekonomi Modern. Jakarta: Prenada. Sugiyono. (2011). Metode Penelitian Kuantitatif, Kualitatif dan R&D. Bandung: Afabeta.Sujarweni., & Wiratna, V. (2018). Panduan Mudah Olah Data Struktural Equation Modeling
(SEM) Dengan Lisrel. Pustaka Baru: Yogyakarta.
Vol. 9, No. 2, 2019Esensi: Jurnal Bisnis dan Manajemen
174 http://journal.uinjkt.ac.id/index.php/esensiDOI: https://doi.org/10.15408/ess.v9i2.13576
Supartoyo, Y. H., Tatuh, J., & Sendouw, R. H. E. (2013). The Economic Growth and The Regional Characteristics: The Case of Indonesia. Buletin Ekonomi Moneter Dan Perbankan, Vol July, 3–19.
Syamsuddin, Lukman. (2010). Manajemen Keuangan Perusahaan. Jakarta: Rajawali Pers. Thiel, M. (2001). Finance and Growth: A Review of Theory and the Available Evidence,
Directorate General for Economic and Financial Affairs, Economic Paper No. 158. Wachira MI, Kihiu EN. (2012). Impact of financial literacy on access to financial services in
Kenya. International Journal of Business and Social Sience. Vol 3 No.19.Xu, Lisa., dan Bilal Zia. (2012). Financial Literacy around the World-An Overview of the
Evidence with Practical Suggestions for the Way Forward. The World Bank:Finance and Private Sector Development.
Aryo Prakoso1*, Aulia Ayu Dewinta2
1, 2 Universitas [email protected], [email protected]*Corresponding author
AbstractGlobalization provides open competition to every business actor, to become a superior and valuable company one of the ways that can be taken by the company through disclosure of the corporate social reports (CSR). This paper wants to explore how far the characteristics of the company influence the extent of CSR disclosure. The method in this study uses the empirical study hypothesis testing approach by sampling all companies indexed L-Q45 on the Indonesia stock exchange. The reason selection of this index is the leading index in Indonesia with tightly defined criteria by regulators, including levels of liquidity, market capitalization, and growth prospects of the company. The results of the data analysis that has been done obtained results Profitability and total assets influence the broad disclosure of CSR, this also supports stakeholder theory and legitimacy theory, on the contrary, leverage does not affect the broad disclosure of CSR. That caused by the management of the company seeing high leverage tends to reduce the disclosure of social responsibility so as not to be in the spotlight of the debtholders. Keywords: company characteristics, profitability, total assets, leverage, CSR
AbstrakGlobalisasi memberikan persaingan terbuka kepada setiap pelaku bisnis, untuk menjadi perusahaan yang unggul dan bernilai, salah satu cara yang dapat diambil oleh perusahaan melalui pengungkapan laporan sosial perusahaan (CSR). Makalah ini ingin mengeksplorasi sejauh mana karakteristik perusahaan mempengaruhi tingkat pengungkapan CSR. Metode dalam penelitian ini menggunakan pendekatan pengujian hipotesis studi empiris dengan pengambilan sampel semua perusahaan yang diindeks L-Q45 di bursa efek Indonesia. Alasan pemilihan indeks ini adalah indeks utama di Indonesia dengan kriteria yang ditetapkan oleh regulator, termasuk tingkat likuiditas, kapitalisasi pasar, dan prospek pertumbuhan perusahaan. Hasil analisis data yang telah dilakukan diperoleh hasil Profitabilitas dan total aset berpengaruh terhadap pengungkapan luas CSR, ini juga mendukung teori stakeholder dan teori legitimasi, sebaliknya, leverage tidak mempengaruhi pengungkapan luas CSR. Itu disebabkan oleh manajemen perusahaan melihat leverage yang tinggi cenderung mengurangi pengungkapan tanggung jawab sosial sehingga tidak menjadi sorotan para debtholders.Kata kunci: karakteristik perusahaan, profitabilitas, total aset, leverage, CSR
Karakteristik Perusahaan Terhadap Luas Pengungkapan Corporate Social Responsibility
First draft : August 15, 2019; Revision: September 26, 2019; Accepted: October 15, 2019http://journal.uinjkt.ac.id/index.php/esensiDOI: https://doi.org/10.15408/ess.v9i2.12495
Esensi: Jurnal Bisnis dan ManajemenVolume 9 (2), 2019
P-ISSN: 2087-2038; E-ISSN:2461-1182Halaman 175 - 184

Vol. 9, No. 2, 2019Esensi: Jurnal Bisnis dan Manajemen
176 http://journal.uinjkt.ac.id/index.php/esensiDOI: https://doi.org/10.15408/ess.v9i2.12495
PENDAHULUANLingkungan dan kualitas hidup masyarakat sangat berkaitan erat dengan aktivitas
industry. Perusahaan hadir tidak hanya memperhatikan kebutuhan share holder, akan tetapi perlu juga memperhatikan keterlibatan stakeholder, baik internal maupun eksternal perusahaan. Jaminan keselamatan kerja karyawan serta mutu dan keamanan produk sering dikaitkan dengan perhatian yang kurang dari perusahaan terhadap kualitas hidup masyarakat. Perusahaan harus menyadari setiap langkah yang diambil akan memiliki konsekuensi terhadap lingkungan dan kualitas hidup masyarakat di sekitarnya (Overland, 2011). Point of view agency theory dengan mengulas tanggung jawab tataelola perusahaan untuk kepentingan pemegang saham menuju perspektif stakeholder theory melalui dorongan untuk mempertimbangkan aspek kepentingan hidup masyarakat luas. Fungsi manajemen perusahaan tidak hanya memaksimalkan laba, tetapi juga memperhatikan komitmen dalam hal pertanggung jawaban sosial dan lingkungan serta meningkatkan peranannya dalam pembangunan bangsa. Komitmen jamak disebut tanggungjawab sosial perusahaan (CSR). Tema CSR dan pengungkapannya dalam laporan tahunan akan menjadi garis besar pembahasan pada penelitian ini.
Nilai dan tingkat keberlangsungan hidup perusahaan tidak hanya digambarkan secara finansial saja tetapi juga dapat mengikuti pendekatan triple bottom lines yang dipandang secara holistik dari aspek sosial, lingkungan, dan keuangan (Rustiarini, 2010). Konsep tersebut mendorong perusahaan melakukan pengungkapan terhadap aspek social, ethical, enviromental, and sustainability (SEES) dalam laporan tahunan sebagai bentuk komunikasi informasi dan akuntabilitasnya kepada para stakeholder. Pemerintah sebagai regulator, sosialisasi dan implementasi program serta pengungkapan CSR di Indonesia melalui laporan tahunan sudah diakomodasi. Pemerintah Indonesia telah mengeluarkan kebijakan mengenai CSR yang diatur dalam UU No. 40 tahun 2007 tentang Perseroan Terbatas, UU No. 25 tahun 2007 tentang Penanaman Modal. Ikatan Akuntan Indonesia (IAI) dalam Pernyataan Standar Akuntansi Keuangan (PSAK) Nomor 1 paragraf 9 secara implisit menyarankan perusahaan untuk menggambarkan tanggung jawab sosial perusahaan dalam bentuk pelaporan masalah lingkungan social.
Bursa Efek Indonesia, sebagai wadah bertemunya perusahaan dan investor memberikan reverensi dan kapasitas bagaimana kinerja perusahaan yang terindeks di dalamnya. Salah satu indeks unggulan, adalah LQ-45, indeks ini merupakan indeks unggulan dengan keriteria unggulan yang ditetapkan oleh regulator, kriteria yang dipakai untuk masuk dalam indeks ini antaralain tingkat llikuiditas, kapitalisasi pasar, serta prospek pertumbuhan perusahaan tersebut. BEI secara berkala melihat perkembangan kinerja perusahaan indeks LQ45 setiap tiga bulan dan melakukan evaluasi. Penggantian saham akan dilakukan setiap enam bulan sekali, yaitu pada awal bulan Februari dan Agustus. Menarik untuk menggali Pengungkapan CSR indeks LQ-45 yang digambarkan sebagai ketersediaan informasi finansial dan non-finansial terkait dengan interaksi organisasi dengan lingkungan fisik dan lingkungan sosialnya, yang dapat dibuat dalam laporan tahunan perusahaan atau laporan sosial terpisah (Sembiring, 2003).
Kompleksitas bisnis unik dan berbeda setiap perusahaan akan memberikan perbedaan dalam kompleksitas aktivitas CSR-nya, sehingga dapat diasumsikan bahwa perbedaan dalam
177
Karakteristik Perusahaan Terhadap Luas Pengungkapan CSRAryo Prakoso
http://journal.uinjkt.ac.id/index.php/esensiDOI: https://doi.org/10.15408/ess.v9i2.12495
aktivitas bisnis setiap perusahaan menjadi ciri-ciri atau karakteristik suatu perusahaan. Karakteristik perusahaan diasumsikan memiliki pengaruh terhadap luas pengungkapan laporan tahunan termasuk laporan CSR karena berkaitan dengan kompleksitas yang berbeda untuk setiap perusahaan dalam melaksanakan dan mengungkapkan kegiatan sosialnya.Karakteristik perusahaan dapat ditinjau antara lain dari size perusahaan, kemampuan menghasilkan laba, profile perusahaan, proporsi jumlah komisaris independen, dan leverage.
Coase et al (1937) menyebut bahwa hubungan agensi muncul ketika principal mem-pekerjakan orang lain (agent) untuk menjalankan dan pengambil keputusan perusahaan atas nama principal. Manajer (agent) yang diangkat oleh shareholder (principal) diharapkan akan bertindak untuk memaksimumkan profit perusahaan sehingga pencapaian target kemakmuran shareholder dapat diwujudkan. Agent dalam aktivitas operasional perusahaan sering bertindak atas kepentingan pribadi, bukan untuk kepentingan principal, tetapi bertindak untuk meningkatkan kesejahteraannya antara lain memperoleh investasi, dan pinjaman bank. Adapun Stakeholder theory dsebagaii dasar untuk menganalisa kelompok yang menjadi objek pertanggungjawaban perusahaan. Menurut Freeman (1984) dalam (Sumedi, 2010) stakeholder merupakan kelompok atau individu yang memiliki perngaruh goals tujuan organisasi. Lebih lanjut dalam Legitimacy Theory
Teori ini fokus pada interaksi perusahaan dan masyarakat. Lindblom (1994) dalam Yuliana, Purnomosidhi, & Sukoharsono, (2008) menyatakan inti dari legitimacy theory adalah suatu kondisi ketika sistem nilai suatu entitas sesuai dengan sistem nilai dari sistem sosial yang lebih besar dan merupakan bagian dari entitas tersebut. Perselisihan kedua sistem nilai dapat mengakibatkan adanya resiko pada legitimasi entitas perusahaan. CSR muncul sebagai salah satu mediator yang dapat digunakan perusahaan dan stakeholder serta menjadi pembuka jalan untuk memperoleh keuntungan, reaksi positif dari lingkungan, dan mendapatkan legitimasi atas usaha perusahaan.
Selanjutnya dalam Signalling theory memiliki inti pentingnya informasi yang dikeluarkan perusahaan atas keputusan investasi bagipihak diluar perusahaan. Informasi merupakan unsur penting bagi investor dan pelaku bisnis, karena pada dasarnya memberikan gambaran perusahaan baik untuk keadaan masa lalu, saat ini, maupun keadaan masa yang akan datang bagi kelangsungan hidup suatu perusahaan.
Karakteristik suatu perusahaan dapat dilihat pada isi atau data akuntansi dari laporan keuangan. Klasifikasi karakteristik perusahaan menjadi tiga kategori berdasarkan konteks pelaporan keuangan, yaitu: (1) Karakteristik perusahaan terkait dengan struktur perusahaan; (2) Karakteristik perusahaan terkait dengan kinerja perusahaan; (3) Karakteristik perusahaan terkait dengan pasar.
Studi terdahulu mengenai tentang karakteristik perusahaan terhadap luas pengungkapan CSR menunjukkan hasil yang beragam. Adhi (2012) yang menunjukkan bahwa ukuran perusahaan memiliki pengaruh terhadap luas pengungkapan CSR, sebaliknya rasio leverage, rasio likuiditas, dan basis perusahaan ditemukan tidak berpengaruh terhadap pengungkapan CSR. Penelitian Hasibuan (2001) menunjukkan bahwa hanya ukuran dan profile perusahaan yang berpengaruh terhadap praktik pengungkapan CSR.. Sebaliknya, profitabilitas dan leverage tidak berpengaruh. Penelitian Kasmadi & Susanto (2004) memiliki hasil basis perusahaan dan rasio leverage berpengaruh terhadap luas pengungkapan CSR. Sebaliknya, ukuran,
Vol. 9, No. 2, 2019Esensi: Jurnal Bisnis dan Manajemen
178 http://journal.uinjkt.ac.id/index.php/esensiDOI: https://doi.org/10.15408/ess.v9i2.12495
tingkat return, dan tipe industri tidak berpengaruh terhadap luas pengungkapan CSR. Reni dan Anggraini, (2006) memperoleh persentase kepemilikan manajemen dan tipe industri yang terbukti memiliki pengaruh terhadap pengungkapan CSR, sebaliknya profitabilitas dan ukuran perusahaan tidak berpengaruh terhadap pengungkapan CSR.
METODEPenelitian ini merupakan penelitian kuantitatif dengan pendekatan hypothesis testing
empirical study, yaitu metode yang digunakan untuk mengetahui konsistensi hasil temuan empiris, terutama yang berkaitan dengan pengaruh variabel independen terhadap variabel dependen (Sekaran, 2009)
Populasi dalam penelitian ini adalah seluruh perusahaan yang terindeks LQ-45 Bursa Efek Indonesia periode 2017. Alasan dipilihnya periode waktu tersebut adalah karena laporan tahunan 2017 baik keuangan maupun laporan CSR tiap perusahaan relatif baru, dapat diperoleh di website BEI dan Indonesian Capital Market Directory (ICMD). Adapun sample ditentukanmenggunakan non-probability sampling, dengan metode judgment sampling, yaitu Teknik pemilihan sampel yang dilakukan sesuai dengan kriteria tertentu yang akan diamati (Sekaran, 2009). Kriteria yang diambil antara lain: (a) Sampel penelitian merupakan perusahaan telah terdaftar indeks dalam LQ-45 Periode 2017; (b) Menyajikan laporan keberlanjutan CSR d per 31 Desember 2017; (c) Perusahaan memiliki data yang lengkap pada ICMD terkait dengan variabel-variabel yang digunakan dalam penelitian.
Sumber data dalam penelitian ini adalah sumber data sekunder. Data sekunder merupakan sumber data penelitian yang diperoleh secara tidak langsung. Data sekunder umumnya berupa bukti, catatan atau laporan historis yang telah disusun dalam arsip (data dokumenter) yang dipublikasikan dan yang tidak dipublikasikan (Indriantoro, N dan Supomo B, 2002). Data yang digunakan diperoleh melalui website IDX, website perusahaan serta ICMD.
Teknik analisis yang dipergunakan dalam penelitian ini ialah regresi berganda. Adapun persamaan matematis yang diajukan ialah:
CSR = α + β1 SIZE + β2 ROA + β3 LEV + ε Keterangan:SIZE : Ukuran perusahaan ROA : Profitabilitas LEV : Leverage
CSR : Luas pengungkapan CSR
HASIL DAN PEMBAHASANUji normalitas menguji apakah dalam model regresi, variabel independen dan variabel
dependen, keduanya terdistribusi secara normal atau tidak. Berdasarkan uji pengolahan data (Gambar 1), diperoleh hasil grafik dengan titik- titik mendekati dan konsisten searah dengan garis diagonal. Hal ini menunjukkan semua data terdistribusi secara normal dan tidak terjadi penyimpangan, sehingga data yang dikumpulkan dapat diproses dengan metode-metode selanjutnya.
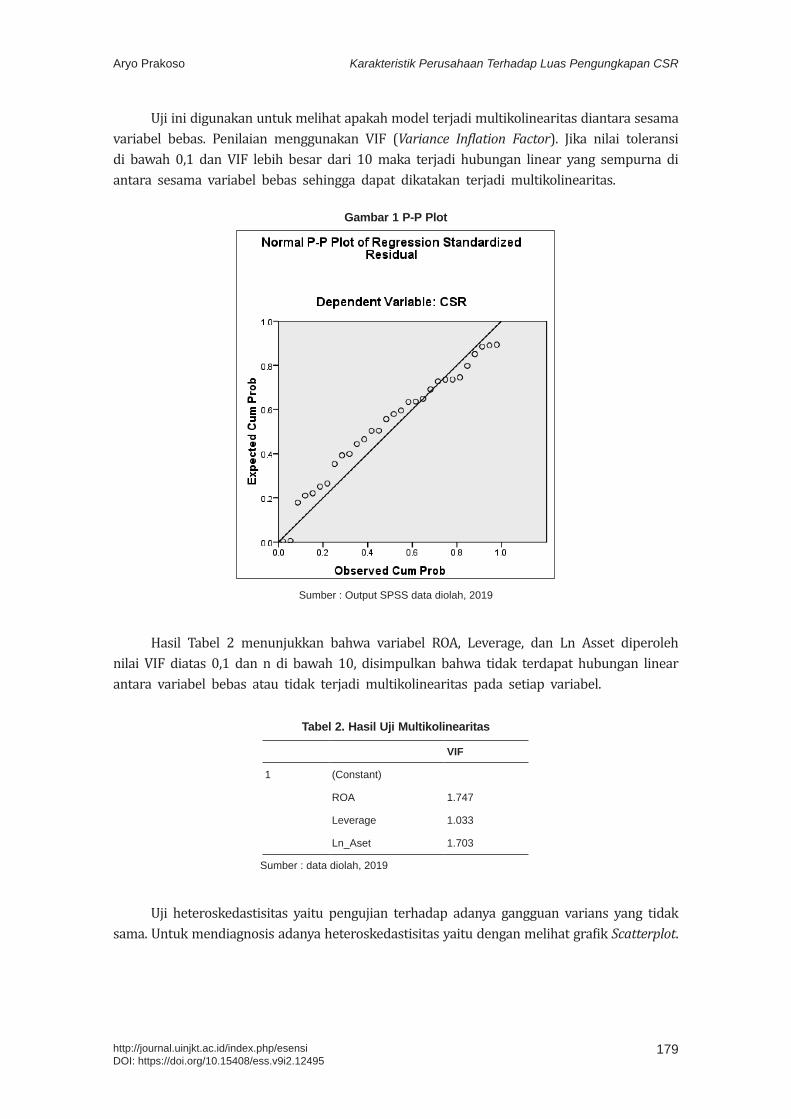
179
Karakteristik Perusahaan Terhadap Luas Pengungkapan CSRAryo Prakoso
http://journal.uinjkt.ac.id/index.php/esensiDOI: https://doi.org/10.15408/ess.v9i2.12495
Uji ini digunakan untuk melihat apakah model terjadi multikolinearitas diantara sesama variabel bebas. Penilaian menggunakan VIF (Variance Inflation Factor). Jika nilai toleransi di bawah 0,1 dan VIF lebih besar dari 10 maka terjadi hubungan linear yang sempurna di antara sesama variabel bebas sehingga dapat dikatakan terjadi multikolinearitas.
Gambar 1 P-P Plot
Sumber : Output SPSS data diolah, 2019
Hasil Tabel 2 menunjukkan bahwa variabel ROA, Leverage, dan Ln Asset diperoleh nilai VIF diatas 0,1 dan n di bawah 10, disimpulkan bahwa tidak terdapat hubungan linear antara variabel bebas atau tidak terjadi multikolinearitas pada setiap variabel.
Tabel 2. Hasil Uji Multikolinearitas
VIF
1 (Constant)
ROA 1.747
Leverage 1.033
Ln_Aset 1.703
Sumber : data diolah, 2019
Uji heteroskedastisitas yaitu pengujian terhadap adanya gangguan varians yang tidak sama. Untuk mendiagnosis adanya heteroskedastisitas yaitu dengan melihat grafik Scatterplot.
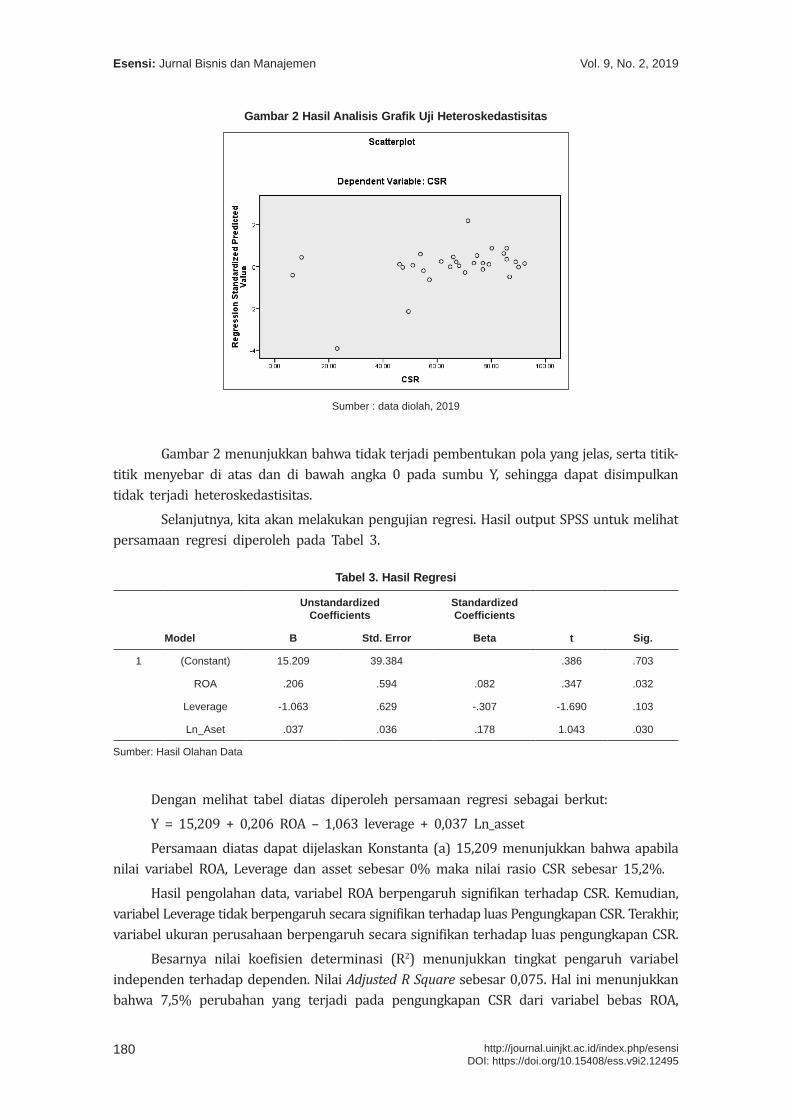
Vol. 9, No. 2, 2019Esensi: Jurnal Bisnis dan Manajemen
180 http://journal.uinjkt.ac.id/index.php/esensiDOI: https://doi.org/10.15408/ess.v9i2.12495
Gambar 2 Hasil Analisis Grafik Uji Heteroskedastisitas
Sumber : data diolah, 2019
Gambar 2 menunjukkan bahwa tidak terjadi pembentukan pola yang jelas, serta titik-titik menyebar di atas dan di bawah angka 0 pada sumbu Y, sehingga dapat disimpulkan tidak terjadi heteroskedastisitas.
Selanjutnya, kita akan melakukan pengujian regresi. Hasil output SPSS untuk melihat persamaan regresi diperoleh pada Tabel 3.
Tabel 3. Hasil Regresi
Model
Unstandardized Coefficients
Standardized Coefficients
t Sig.B Std. Error Beta
1 (Constant) 15.209 39.384 .386 .703
ROA .206 .594 .082 .347 .032
Leverage -1.063 .629 -.307 -1.690 .103
Ln_Aset .037 .036 .178 1.043 .030
Sumber: Hasil Olahan Data
Dengan melihat tabel diatas diperoleh persamaan regresi sebagai berkut:Y = 15,209 + 0,206 ROA – 1,063 leverage + 0,037 Ln_assetPersamaan diatas dapat dijelaskan Konstanta (a) 15,209 menunjukkan bahwa apabila
nilai variabel ROA, Leverage dan asset sebesar 0% maka nilai rasio CSR sebesar 15,2%. Hasil pengolahan data, variabel ROA berpengaruh signifikan terhadap CSR. Kemudian,
variabel Leverage tidak berpengaruh secara signifikan terhadap luas Pengungkapan CSR. Terakhir, variabel ukuran perusahaan berpengaruh secara signifikan terhadap luas pengungkapan CSR.
Besarnya nilai koefisien determinasi (R2) menunjukkan tingkat pengaruh variabel independen terhadap dependen. Nilai Adjusted R Square sebesar 0,075. Hal ini menunjukkan bahwa 7,5% perubahan yang terjadi pada pengungkapan CSR dari variabel bebas ROA,
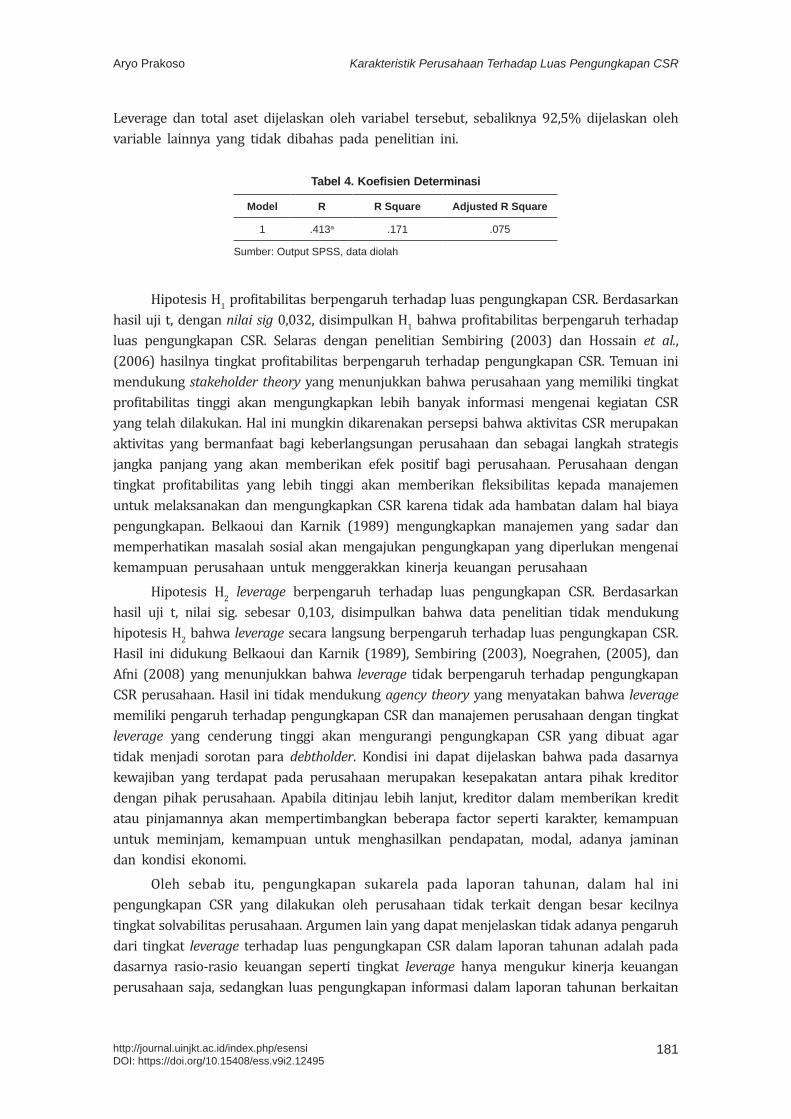
181
Karakteristik Perusahaan Terhadap Luas Pengungkapan CSRAryo Prakoso
http://journal.uinjkt.ac.id/index.php/esensiDOI: https://doi.org/10.15408/ess.v9i2.12495
Leverage dan total aset dijelaskan oleh variabel tersebut, sebaliknya 92,5% dijelaskan oleh variable lainnya yang tidak dibahas pada penelitian ini.
Tabel 4. Koefisien Determinasi
Model R R Square Adjusted R Square
1 .413a .171 .075
Sumber: Output SPSS, data diolah
Hipotesis H1 profitabilitas berpengaruh terhadap luas pengungkapan CSR. Berdasarkan hasil uji t, dengan nilai sig 0,032, disimpulkan H1 bahwa profitabilitas berpengaruh terhadap luas pengungkapan CSR. Selaras dengan penelitian Sembiring (2003) dan Hossain et al., (2006) hasilnya tingkat profitabilitas berpengaruh terhadap pengungkapan CSR. Temuan ini mendukung stakeholder theory yang menunjukkan bahwa perusahaan yang memiliki tingkat profitabilitas tinggi akan mengungkapkan lebih banyak informasi mengenai kegiatan CSR yang telah dilakukan. Hal ini mungkin dikarenakan persepsi bahwa aktivitas CSR merupakan aktivitas yang bermanfaat bagi keberlangsungan perusahaan dan sebagai langkah strategis jangka panjang yang akan memberikan efek positif bagi perusahaan. Perusahaan dengan tingkat profitabilitas yang lebih tinggi akan memberikan fleksibilitas kepada manajemen untuk melaksanakan dan mengungkapkan CSR karena tidak ada hambatan dalam hal biaya pengungkapan. Belkaoui dan Karnik (1989) mengungkapkan manajemen yang sadar dan memperhatikan masalah sosial akan mengajukan pengungkapan yang diperlukan mengenai kemampuan perusahaan untuk menggerakkan kinerja keuangan perusahaan
Hipotesis H2 leverage berpengaruh terhadap luas pengungkapan CSR. Berdasarkan hasil uji t, nilai sig. sebesar 0,103, disimpulkan bahwa data penelitian tidak mendukung hipotesis H2 bahwa leverage secara langsung berpengaruh terhadap luas pengungkapan CSR. Hasil ini didukung Belkaoui dan Karnik (1989), Sembiring (2003), Noegrahen, (2005), dan Afni (2008) yang menunjukkan bahwa leverage tidak berpengaruh terhadap pengungkapan CSR perusahaan. Hasil ini tidak mendukung agency theory yang menyatakan bahwa leverage memiliki pengaruh terhadap pengungkapan CSR dan manajemen perusahaan dengan tingkat leverage yang cenderung tinggi akan mengurangi pengungkapan CSR yang dibuat agar tidak menjadi sorotan para debtholder. Kondisi ini dapat dijelaskan bahwa pada dasarnya kewajiban yang terdapat pada perusahaan merupakan kesepakatan antara pihak kreditor dengan pihak perusahaan. Apabila ditinjau lebih lanjut, kreditor dalam memberikan kredit atau pinjamannya akan mempertimbangkan beberapa factor seperti karakter, kemampuan untuk meminjam, kemampuan untuk menghasilkan pendapatan, modal, adanya jaminan dan kondisi ekonomi.
Oleh sebab itu, pengungkapan sukarela pada laporan tahunan, dalam hal ini pengungkapan CSR yang dilakukan oleh perusahaan tidak terkait dengan besar kecilnya tingkat solvabilitas perusahaan. Argumen lain yang dapat menjelaskan tidak adanya pengaruh dari tingkat leverage terhadap luas pengungkapan CSR dalam laporan tahunan adalah pada dasarnya rasio-rasio keuangan seperti tingkat leverage hanya mengukur kinerja keuangan perusahaan saja, sedangkan luas pengungkapan informasi dalam laporan tahunan berkaitan
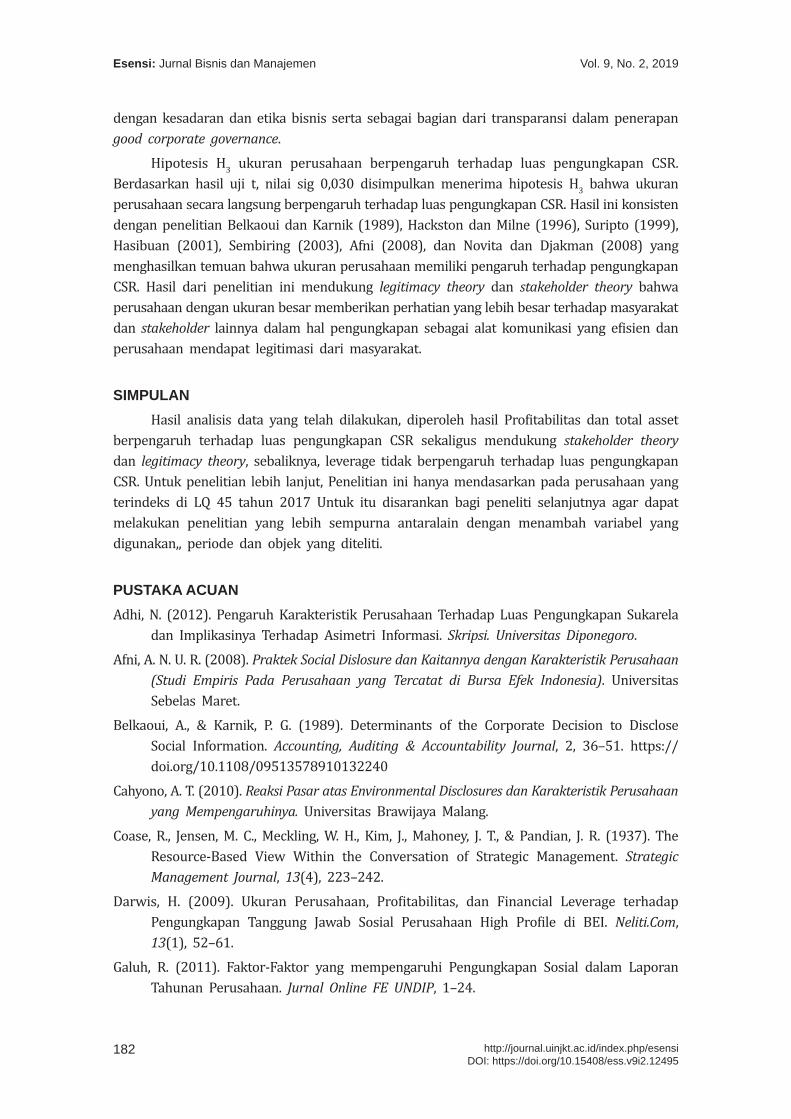
Vol. 9, No. 2, 2019Esensi: Jurnal Bisnis dan Manajemen
182 http://journal.uinjkt.ac.id/index.php/esensiDOI: https://doi.org/10.15408/ess.v9i2.12495
dengan kesadaran dan etika bisnis serta sebagai bagian dari transparansi dalam penerapan good corporate governance.
Hipotesis H3 ukuran perusahaan berpengaruh terhadap luas pengungkapan CSR. Berdasarkan hasil uji t, nilai sig 0,030 disimpulkan menerima hipotesis H3 bahwa ukuran perusahaan secara langsung berpengaruh terhadap luas pengungkapan CSR. Hasil ini konsisten dengan penelitian Belkaoui dan Karnik (1989), Hackston dan Milne (1996), Suripto (1999), Hasibuan (2001), Sembiring (2003), Afni (2008), dan Novita dan Djakman (2008) yang menghasilkan temuan bahwa ukuran perusahaan memiliki pengaruh terhadap pengungkapan CSR. Hasil dari penelitian ini mendukung legitimacy theory dan stakeholder theory bahwa perusahaan dengan ukuran besar memberikan perhatian yang lebih besar terhadap masyarakat dan stakeholder lainnya dalam hal pengungkapan sebagai alat komunikasi yang efisien dan perusahaan mendapat legitimasi dari masyarakat.
SIMPULANHasil analisis data yang telah dilakukan, diperoleh hasil Profitabilitas dan total asset
berpengaruh terhadap luas pengungkapan CSR sekaligus mendukung stakeholder theory dan legitimacy theory, sebaliknya, leverage tidak berpengaruh terhadap luas pengungkapan CSR. Untuk penelitian lebih lanjut, Penelitian ini hanya mendasarkan pada perusahaan yang terindeks di LQ 45 tahun 2017 Untuk itu disarankan bagi peneliti selanjutnya agar dapat melakukan penelitian yang lebih sempurna antaralain dengan menambah variabel yang digunakan,, periode dan objek yang diteliti.
PUSTAKA ACUANAdhi, N. (2012). Pengaruh Karakteristik Perusahaan Terhadap Luas Pengungkapan Sukarela
dan Implikasinya Terhadap Asimetri Informasi. Skripsi. Universitas Diponegoro.Afni, A. N. U. R. (2008). Praktek Social Dislosure dan Kaitannya dengan Karakteristik Perusahaan
(Studi Empiris Pada Perusahaan yang Tercatat di Bursa Efek Indonesia). Universitas Sebelas Maret.
Belkaoui, A., & Karnik, P. G. (1989). Determinants of the Corporate Decision to Disclose Social Information. Accounting, Auditing & Accountability Journal, 2, 36–51. https://doi.org/10.1108/09513578910132240
Cahyono, A. T. (2010). Reaksi Pasar atas Environmental Disclosures dan Karakteristik Perusahaan yang Mempengaruhinya. Universitas Brawijaya Malang.
Coase, R., Jensen, M. C., Meckling, W. H., Kim, J., Mahoney, J. T., & Pandian, J. R. (1937). The Resource-Based View Within the Conversation of Strategic Management. Strategic Management Journal, 13(4), 223–242.
Darwis, H. (2009). Ukuran Perusahaan, Profitabilitas, dan Financial Leverage terhadap Pengungkapan Tanggung Jawab Sosial Perusahaan High Profile di BEI. Neliti.Com, 13(1), 52–61.
Galuh, R. (2011). Faktor-Faktor yang mempengaruhi Pengungkapan Sosial dalam Laporan Tahunan Perusahaan. Jurnal Online FE UNDIP, 1–24.
183
Karakteristik Perusahaan Terhadap Luas Pengungkapan CSRAryo Prakoso
http://journal.uinjkt.ac.id/index.php/esensiDOI: https://doi.org/10.15408/ess.v9i2.12495
Hackston, D., & Milne, M. J. (1996). Some Determinants of Social and Environmental Disclosures in New Zealand Companies. Accounting, Auditing, and Accountability Journal, 9(1).
Hasibuan, muhammad rizal. (2001). Pengaruh Karakteristik Perusahaan terhadap Pengungkapan Sosial. Universitas Diponegoro.Semarang
hossain. M; islam.K; Andrew. J. (2006). Corporate Social and Environmental Disclosure in Developing Countries: Evidence from Bangladesh. The Asian Pacific Conference on International Accounting Issues.
Indriantoro Nur; Supomo B. (2002). Metodologi Penelitian Bisnis, Edisi Pertama. Yogyakarta: BPFE.Kasmadi, & Susanto, D. (2004). Analisis Faktor-Faktor yang Mempengaruhi Luas Pengungkapan
Sukarela dalam Laporan Tahunan Perusahaan- Perusahaan di Indonesia. Jurnal Akuntansi dan Manajemen.
Na’im, A., & Rakhman, F. (2000). Analisis Hubungan Antara Kelengkapan Pengungkapan Laporan Keuangan Dengan Struktur Modal Dan Tipe Kepemilikan Perusahaan. Jurnal Ekonomi Dan Bisnis Indonesia, XV.
Noegraheni. (2005). Pegaruh Karakteristik Perusahaan terhadap Kualitas Pengungkapan Sukarela dalam laporan Tahunan pada Perusahaan Publik Non-Industri Keuangan di Bursa Efek Jakarta. EQUITY, 2(1).
Novita, & Djakman, C. D. (2008). Pengaruh struktur kepemilikan terhadap luas pengungkap tanggung jawab sosial (CSR Disclosure) pada laporan tahunan perusahaan : Studi empiris pada perusahaan publik yang tercatat di Bursa Efek Indonesia pada tahun 2006. Simposium Nasional Akuntansi XI.
Overland, J. (2011). Corporate Social Responsibility in Context: The Case for Compulsory Sustainability Disclosure for Listed Public Companies in Australia? SSRN Electronic Journal. https://doi.org/10.2139/ssrn.1016606
Reni, F., & Anggraini, R. (2006). Pengungkapan Informasi Sosial dan Faktor-Faktor yang Mempengaruhi Pengungkapan Informasi Sosial dalam Laporan Keuangan Tahunan (Studi Empiris pada Perusahaan-Perusahaan yang terdaftar Bursa Efek Jakarta ). Simposium Nasional Akuntansi 9 Padang, 23–26.
Rustiarini, N. W. (2010). Pengaruh Corporate Governance pada Hubungan Corporate Social Responsibility dan Nilai Perusahaan. Simposium Nasional Akuntansi XIII, (11), 1–24.
Sembiring, eddy rismanda. (2003). Kinerja Keuangan, Political Visibility, Ketergantungan pada Hutang, dan Pengungkapan Tanggung Jawab Sosial Perusahaan. Universitas Diponegoro. Semarang.
Setiawati, E., & Artha, R. (2013). Pengaruh Karakteristik Perusahaan Terhadap CSR (Survey pada Industri Perbankan di Indonesia). Proceeding Seminar Nasional Dan Call for Papers Sancall 2013, 168–188.
Sumedi, A. M. P. (2010). Pengaruh Karakteristik Perusahaan dan Regulasi Pemerintah Terhadap Pengungkapan Corporate Social Responsibility (CSR) Pada Laporan Tahunan Di Indonesia. Universitas Diponegoro.Semarang
Suripto, B. (1999). Pengaruh Karakteristik Perusahaan terhadap Luas Pengungkapan Sukarela dalam Laporan Tahunan. Simposium Nasional Akuntansi II IAI-KAPd.
Vol. 9, No. 2, 2019Esensi: Jurnal Bisnis dan Manajemen
184 http://journal.uinjkt.ac.id/index.php/esensiDOI: https://doi.org/10.15408/ess.v9i2.12495
Uma, S. (2009). Research Methods for Business: A Skill Building Approach (Fifth Edit). United Kingdom: John Wiley and Sons.
Yuliana, R. (2010). Jurnal Investasi Praktik Pengungkapan Corporate Social Responsibility (CSR) Di Indonesia (Studi pada Perusahaan yang Terdaftar di BEI). Jurnal Investasi, 6(2), 140–151.
Yuliana, R., Purnomosidhi, B., & Sukoharsono, E. G. (2008). Pengaruh Karakteristik Perusahaan Terhadap Pengungkapan Corporate Social Responsibility (Csr) Dan Dampaknya Terhadap Reaksi Investor. Jurnal Akuntansi Dan Keuangan Indonesia, 5(2), 245–276. https://doi.org/10.21002/jaki.2008.12
Yuliani, R. (2003). Pengaruh Karakteristik Perusahaan terhadap Praktek Pengungkapan Sosial dan Lingkungan di Indonesia. Universitas Diponegoro. Semarang

Wike Mardiana1, Anik Irawati2*
1, 2 Institut Informatika dan Bisnis [email protected], [email protected]*Corresponding author
AbstractThis study aims to analyze factors influence Corporate Social Responsibility Disclosure in palm oil plantation companies in Indonesia and Malaysia. This study analyzes influences of total assets, profitability, leverage, independent proportion of commissioners, the proportion of independent audit committee. This study is conduct on financial reports published in Indonesia and Malaysia. Methods of data collection are taken from the annual financial statements in Indonesia Stock Exchange of 17 companies and Bursa Malaysia of 22 companies. Data analysis techniques used multiple regressions. The results showed that; 1) there is no influence of total asset, profitability, leverage, and proportion of independent audit committee in palm oil plantation companies in Indonesia and Malaysia; 2) there is influence of independent board of commissioner on CSR disclosure practices in palm oil plantation companies Indonesia and Malaysia.Keywords: corporate social responsibility disclosure independent proportion of commissioners, the
proportion of independent audit committee
AbstrakPenelitian ini bertujuan untuk menganalisis faktor-faktor yang mempengaruhi Pengungkapan Tanggung Jawab Sosial Perusahaan pada perusahaan perkebunan kelapa sawit di Indonesia dan Malaysia. Penelitian ini menganalisis pengaruh total aset, profitabilitas, leverage, proporsi komisaris independen, proporsi komite audit independen. Studi ini dilakukan pada laporan keuangan yang diterbitkan di Indonesia dan Malaysia. Metode pengumpulan data diambil dari laporan keuangan tahunan di Bursa Efek Indonesia dari 17 perusahaan dan Bursa Malaysia dari 22 perusahaan. Teknik analisis data menggunakan regresi berganda. Hasil penelitian menunjukkan bahwa; 1) tidak ada pengaruh total aset, profitabilitas, leverage, dan proporsi komite audit independen di perusahaan perkebunan kelapa sawit di Indonesia dan Malaysia; 2) terdapat pengaruh dewan komisaris independen terhadap praktik pengungkapan CSR di perusahaan perkebunan kelapa sawit Indonesia dan Malaysia.Kata kunci: pengungkapan tanggung jawab sosial perusahaan, proporsi komisaris independen, proporsi
komite audit independen
Factors Influence Corporate Social Responsibility Disclosure
First draft: August 28, 2019; Revision: October 5, 2019; Accepted: October 25, 2019http://journal.uinjkt.ac.id/index.php/esensiDOI: https://doi.org/10.15408/ess.v9i2.13582
Esensi: Jurnal Bisnis dan ManajemenVolume 9 (2), 2019
P-ISSN: 2087-2038; E-ISSN:2461-1182Halaman 185 - 190
Vol. 9, No. 2, 2019Esensi: Jurnal Bisnis dan Manajemen
186 http://journal.uinjkt.ac.id/index.php/esensiDOI: https://doi.org/10.15408/ess.v9i2.13582
INTRODUCTIONThe plantation sector, palm oil, has become a famous of investment in Indonesia and
Malaysia, where 85% of the world’s palm oil demand is produce in Indonesia and Malaysia. World palm oil production is dominated by Indonesia and Malaysia. Both countries account for about 85-90% of total world palm oil production. Palm oil plantation activities often certainly influence the surrounding environment. There is positive impact, however not a few is classify as negative become social problem. Those problems can see from environment damage and human right. In Indonesia, Institute for Policy Research and Advocacy Noted cases involving member of Roundtable on Sustainable Palm Oil (RSPO) in palm oil plantation companies that already signed in the RSPO complaints mechanism. PT Bangun Nusa Mandiri (2009) without approved communities West Kalimantan when opening the plantation area, this company displaces the ancestral cemetery, fields, and residential community with an area of about 600 hectares. In Bengkulu, PT. Sandabi Indah Lestari, intimidating people who complained about the RSPO mechanism, took over the land of transmigrants and committed criminalization.
In the Malaysian State of Sarawak, there has been a debate over whether there is a suitable level of consultation with the community of longterm prior to the development of local land for palm oil plantations. Malaysia as the second largest palm oil producer has pledged to conserve at least 50 percent of its total land area as a forest. In 2010, 58 percent of Malaysia became a forest. Oil palm cultivation has been criticized for: Greenhouse gas emissions, tropical deforestation account for about 10 percent of man-made CO, emissions and drivers to dangerous climate change. Reduce biodiversity, including damage to biodiversity. In the states of Sarawak and Kalimantan on the island of Borneo and the Malaysian state of Sabah, Cultivation of crops on indigenous peoples land.
Differences corporate social responsibility (CSR) disclosure practices in Indonesia and Malaysia. The development social disclosure system related to the development accounting system. Standards of disclosure practice influenced by financial resources, legal systems, political ties, and economies, levels of economic development, educational level, culture, and other influences. Corporate governance and finance in different companies are caused differences in disclosure in each country. Assets show the performance undertaken by the company, the higher the total asset, the better the performance the company, so the CSR disclosure of the company will get a positive feedback from stakeholders in the form of enhancing the company’s reputation and stakeholder decision- making in the form of buying shares, loan capital, and purchase products, improving company performance including financial performance (Yuliana et al, 2008).
Hanafi & Halim (2007) state that profitability measures the ability of companies to generate profits at the level of sales, assets, and capital stock. Measured CSR disclosure practices is using profit margin, return on asset (ROA), and return on equity (ROE). According to Irmawati (2011), the leverage ratio is the proportion of total debt to the average shareholder equity. The higher the level of leverage (the debt/equity ratio) the more likely it will be to break the credit agreement so that the company will seek to report higher earnings now, with higher reported earnings will reduce the possibility of companies violating debt agreements. Under agency theory, corporate management with a
187
Factors Influence Corporate Social Responsibility DisclosureWike Mardiana
http://journal.uinjkt.ac.id/index.php/esensiDOI: https://doi.org/10.15408/ess.v9i2.13582
high level of leverage will reduce the disclosure of social responsibility made to not be in the spotlight of the debt holders.
Ujiyantho and Bambang (2007) said independent commissioner is the best position to carry out monitoring function to create a good corporate governance company. An independent commissioner may act as a mediator, supervise and advise management. A larger proportion of independent commissioners will encourage management to disclose voluntary information, among them social disclosure. Supriyono (2013) state that a heavy audit committee requires not only the ability but also the amount sufficient to be optimal in performing their duties. The greater the number of audit committees the more effective they will be in overseeing the quality of financial statement disclosure, including CSD. Therefore, more audit committee members improve the quality of social disclosure. Said et al., (2009) found that the audit Proportion of the committee positively influenced CSRD disclosure.
The corporate social responsibility disclosure (CSRD) is an accounting concept that takes into the transparency of social disclosure on corporate social responsibility (CSR), including voluntary disclosures regarding the social and environmental impacts life caused by the activities of the company (Restuningdiah, 2010). According to Law no. 40 articles 74 of 2007 companies engaged in business activities and or related to natural resources shall be obliged to carry out corporate social responsibility (Lako, 2016). This issue prompt a question “How is the practice of corporate social responsibility (CSR) disclosure conducted by palm oil plantation companies go public in Indonesia and Malaysia, is there any difference if compared with each other?”
METHODPopulation in this research is Palm Oil Plantation Company go public in Indonesia and
Malaysia. This study uses data from annual statements of palm oil Plantation Company in Indonesia and Malaysia. The sampling technique in this research is done based on certain criteria or called judgment sampling. Source of data derived from annual statements published by the company concerned. The data obtained from Indonesia stock exchange website are selected 17 palm oil company, and Bursa Malaysia website are 21 palm oil company. Sample from this research is Palm Oil Plantation Company go public in Indonesia and Malaysia for their last 4 years annual report (2013-2016).
This research is using multiple regressions as a tool of analysis. The mathematical tools that proposed in this research are
Where:CSR is CSR disclosureAsset is total assets of the companiesProfit is profitability of the companiesLev is leverage of the companiesICI is independent commissioners independentAC is audit committee
Vol. 9, No. 2, 2019Esensi: Jurnal Bisnis dan Manajemen
188 http://journal.uinjkt.ac.id/index.php/esensiDOI: https://doi.org/10.15408/ess.v9i2.13582
RESULT AND DISCUSSIONBased on Table 1, the result has been concluded that regression coefficient which is
the interaction between corporate assets against corporate social responsibility disclosure shows the value -0.796 with significance of 0.428. The result showed that assets have no effect on corporate social responsibility disclosure in the report of palm oil plantation in Indonesia and Malaysia listed as Indonesia Stock Exchange and Bursa Malaysia. The result has been concluded as there is no influence of assets in the corporate social responsibility disclosure in palm oil company in Indonesia and Malaysia. This is not an agreement that CSR disclosure of the company will get a positive feedback from stakeholders in the form of enhancement of corporate reputation and decision-making stakeholders in the form, loan capital, and purchase products, thereby improving company performance including financial performance (Yuliana et al, 2008).
Tabel 1. Regression Analysis
Model Coefficients Std error tstat Sig
CAssetsProfitabilityLeverageIndependent Commisioners IndependentAudit Committee
.121-2.388E-0.10
.016
.022
.043-.010
.019
.000
.040
.014
.019
.015
6.310-.796.391
1.5572.313-.688
.000
.428
.697
.124
.023
.494
Based on the research, the result has been concluded that regression coefficient which is the interaction between corporate profitability to corporate social responsibility disclosure shows the value of 0.391 with significance of 0.697. The result showed that profitability companies have no effect on corporate social responsibility disclosure in the report on palm oil plantation in Indonesia and Malaysia listed on the Indonesia Stock Exchange and Bursa Malaysia. Corporate social responsibility disclosure in palm oil company in Indonesia and Malaysia. This does not indicate that the better the profitability of the firm the better the social disclosure of the company, because according to Haniffa and Cooke (2005) the most likely explanation of the relationship that management has the freedom and flexibility to the disclosure of its social programs to the public, demonstrating the company’s contribution towards improving the welfare of communities around the company.
The interaction between corporate leverage to corporate social responsibility disclosure shows the value of 1.557. The result showed that leverage companies have no influence on corporate social responsibility disclosure in the report on oil palm plantation in Indonesia and Malaysia listed in Indonesia Stock Exchange and Bursa Malaysia. There is no influence of leverage in the corporate social responsibility disclosure in palm oil Company in Indonesia and Malaysia. This indicates the greater the leverage of the company, the smaller the social disclosure.
Based on the result concluded that the interaction between the size of the board independent corporate commissioners to corporate social responsibility disclosure shows the value of 2.313. The result showed that the size of the board independent commissioners company has a Malaysia listed on the Indonesia Stock Exchange and Bursa Malaysia. There is
189
Factors Influence Corporate Social Responsibility DisclosureWike Mardiana
http://journal.uinjkt.ac.id/index.php/esensiDOI: https://doi.org/10.15408/ess.v9i2.13582
influence of the proportion of independent commissioners in the corporate social responsibility disclosure in palm oil Company in Indonesia and Malaysia. Independent commissioners represent a ratio of the percentage of the number of commissioners who come from outside the company (independent commissioner) against the number of members of the board of commissioners of the company.
The result has been concluded that the interaction between the size of the board independent corporate commissioners to corporate social responsibility disclosure shows the value -0.688. The result showed that the size of the board independent commissioners company has an influence on corporate social responsibility disclosure in the report of palm oil plantations in Indonesia and Malaysia listed in Indonesia Stock Exchange and Bursa Malaysia. Board of Commissioners Considered as the highest internal control mechanism who is responsible for monitoring top management actions related to corporate social responsibility disclosure So that the pressure on management will also be greater to disclose. There is no Influence of the proportion of independent audit committee in the corporate social responsibility disclosure in palm oil Company in Indonesia and Malaysia.
CONCLUSIONThe result concluded that: First, there is no influence of total asset, profitability,
leverage, and proportion of independent audit committee in palm oil plantation companies in Indonesia and Malaysia. Second, there is influence of independent board of commissioner on CSR disclosure practices in palm oil plantation companies Indonesia and Malaysia. Recommendations from the author are further research is better to use a range of small years because the concept of corporate social responsibility company every year it is almost same with same activity. Further research is better to use a larger number of companies as it shows more variations of social disclosure. Further research should use other items apart from the Global Reporting Initiative to measure social disclosure.
REFERENCESFahmi, I. (2012). Analisis laporan keuangan. Cetakan ke-2. Bandung: Alfabeta. Haniffa. R & Cooke, T. E (2005) Impactof Culture and Governance Structure On Corporate
Social Reporting. Journal Of Accounting and Public Policy., 24, 391-340
Hanafi, M. H., & Halim, A. (2007). Analisis Laporan Keuangan, Yogyakarta: UPP STIM YKPN.Lako, A. (2016). Dekonstruksi CSR & Reformasi Paradigma Bisnis & Akuntansi. Surabaya:
Erlangga.Restuningdiah, N. (2010). Kinerja Lingkungan TerhadapReturn On Asset Melalui CorporateSocial
Responsibility Disclosure. Journal of Finance and Banking, 14(2).
Said, R., Zainuddin, Y., & Haron, H. (2009). The Relationship between Corporate Social Responsibility Disclosure and Corporate Governance Characteristic in Malaysian Public Listed Companies. Social Responsibility Journal, 5(2), 212-126.
Sukmalana, S. (2007). Manajemen Kinerja, Langkah-langkah Efektif untuk membangun, mengendalikan dan evaluasi kinerja. Jakarta: PT. Intermedia Utama.
Vol. 9, No. 2, 2019Esensi: Jurnal Bisnis dan Manajemen
190 http://journal.uinjkt.ac.id/index.php/esensiDOI: https://doi.org/10.15408/ess.v9i2.13582
Supriyono., E. (2013). Praktik pengungkapan social: studi kompratif di Asia Tenggara. STIE bank bpd Jateng.
Syamsuddin. (2009). Manajemen Keuangan Perusahaan. PT. Raja Grafindo Persada: Jakarta.Ujiyantho, M. A., & Pramuka, B. A. (2007). Mekanisme Corporate Governance, Manajemen
Laba dan Kinerja Keuangan. Simposium Nasional Akuntansi X.Yuliana, R., Purnomosidhi. B., & Sukoharsono, E. G. (2008) Pengaruh karakteristik perusahaan
terhadap pengungkapan corporate social responsibility (CSR) dan dampaknya terhadap reaksi investor. Jurnal Akuntansi & Keuangan Indonesia, 5(2), 245-276
Dida Sovia Wirdani1*, Nury Ariani Wulansari2
1, 2 Universitas Negeri [email protected], [email protected]*Corresponding author
AbstractThe purpose of this study is to examine and find out the mediating effect of transfer motivation on the relationship between supervisor support and peer support on training transfers in Kantor Pelayanan Pajak (KPP) Pratama Semarang Timur and Selatan employees. This study took a sample of 130 employees by using proportional random sampling technique. The data collection method was carried out by means of a survey, namely interviews and questionnaires. The data analysis method uses descriptive statistical tests and partial least square. The results of this study were accepted both direct and indirect effects (mediation). The conclusion of this study is that KPP Pratama Semarang Timur and Selatan employees must improve the implementation of training results to work and believe that the successful implementation of knowledge, attitude skills can improve their performance.Keywords: supervisor support, peer support, transfer motivation, training transfer
AbstrakTujuan dari penelitian ini untuk menguji dan mengetahui efek mediasi dari motivasi transfer pada hubungan antara dukungan supervisor dan dukungan sebaya pada transfer pelatihan di Kantor Pelayanan Pajak (KPP) Pratama Semarang Timur dan karyawan Selatan. Sampel penelitian ini sejumlah 130 karyawan dan menggunakan teknik proporsional random sampling. Metode pengumpulan data yaitu survei, berupa wawancara dan kuesioner. Metode analisis data menggunakan tes statistik deskriptif dan partial least square. Hasil penelitian ini diterima baik efek langsung dan tidak langsung (mediasi). Kesimpulan dari penelitian ini adalah bahwa karyawan KPP Pratama Semarang Timur dan Selatan harus meningkatkan pelaksanaan hasil pelatihan untuk bekerja dan percaya bahwa keberhasilan penerapan pengetahuan, keterampilan sikap dapat meningkatkan kinerja mereka.Kata kunci: dukungan atasan, dukungan rekan kerja, motivasi transfer, transfer pelatihan
Does Transfer Motivation Succeed in Mediating in the Context of Training Transfer?
First draft: August 10, 2019; Revision: September 22, 2019; Accepted: October 5, 2019http://journal.uinjkt.ac.id/index.php/esensiDOI: https://doi.org/10.15408/ess.v9i2.12660
Esensi: Jurnal Bisnis dan ManajemenVolume 9 (2), 2019
P-ISSN: 2087-2038; E-ISSN:2461-1182Halaman 191 - 200
Vol. 9, No. 2, 2019Esensi: Jurnal Bisnis dan Manajemen
192 http://journal.uinjkt.ac.id/index.php/esensiDOI: https://doi.org/10.15408/ess.v9i2.12660
INTRODUCTIONThe era of globalization has a significant impact on the company’s life cycle. High
quality human resources (HR) is a guide for every organization to achieve a goal (Sudarma, 2012). The solution to getting quality human resources is to provide training programs. The training program is used as a business solution to improve employee and company performance competency (Hurt, 2016), because training can support employee work productivity (Aspiyah & Martono, 2016). In obtaining training effectiveness, training must be evaluated regularly, so that after training it must be ensured that there will be a transfer of learning and skills for employees (Martono & Putri, 2018). Competencies and knowledge that have been obtained by employees will develop, if employees can apply it to work, so the training that has been followed by employees is considered effective (Bjerregaard, Haslam, & Morton, 2016). Training transfer is the process of employees (trainees) taking back knowledge, skills and attitudes gained from training participation and then applying it to their work (Na-nan, Chaiprasit, & Pukkeeree, 2017).
The factors of employees to be willing to transfer training are the work environment. This is because the work environment is a working condition to provide a comfortable climate and work situation of employees in achieving the desired goals of a company (Hairo & Martono, 2019) including supervisor support, organizational support, peer support, technology support and opportunities for the need for knowledge gained (Ragini Chauhan et al., 2016; Noorizan et al., 2016). Supervisor support in general can be considered a positive work interaction between a supervisor and a subordinate (Nurlaila & Sudarma, 2017). In this case, the supervisor provides an explanation of the role and value of a training and development as well as motivating employees to attend training and transferring the entire output of the training to completion of the task. (Al-Eisa et al., 2009). Support given by supervisor to employees in the form of giving advice, motivation to participate in training, providing innovation, acquiring employee knowledge, and giving awards to employees who have successfully carried out training transfers (Tracey & Tews, 2005).
Another factor influencing employees to implement training output is peer support. Co-workers are members who involve themselves in a network that regularly meets, discusses and shares the results of the knowledge they have gained from training (Noe, 1998). Transfer of training will occur if a network of employees is established formally or informally (Ragini Chauhan et al., 2016). In addition, the ability to utilize the skills and abilities of members depends on the quality of the existing network (Yuniawan et al., 2017). So, co-workers are the triggers for the successful transfer of training. Previous research has proven that supervisor support and peer support influence the success of employees in applying training results to work (Bhatti et al., 2013; Suleiman et al., 2017; Muduli & Raval, 2018). However, there are differences in results from other researchers who say that supervisor support and peer support has no effect on the transfer of training (Velada et al., 2007; Hua, 2013; Nurdiana, 2014). Thus, other researchers also questioned the reasons why supervisor support and peer support did not directly influence the transfer of training.
Recently there are results of research on training transfer which proves that the
193
Does Transfer Motivation Succeed in MediatingDida Sovia Wirdani
http://journal.uinjkt.ac.id/index.php/esensiDOI: https://doi.org/10.15408/ess.v9i2.12660
supervisor support and peer support is able to influence the training transfer variable but indirectly (Nijman & Gelissen, 2011; Bhatti et al., 2013; Suleiman et al., 2017; Muduli & Raval, 2018). The researcher explained that cause of supervisor support and peer support did not directly influence training transfer because there were other variables that functioned as mediators, it is transfer motivation (Muduli & Raval, 2018). The existence of transfer motivation is often overlooked by researchers in studies measuring training effectiveness (Colquitt et al., 2000). Whereas, motivation is a process that affects the behavior and motivation that exists in someone who will create a behavior that is directed to achieve the final goal (Ranihusna, 2010). An example of motivation in this case is transfer motivation. Willingness of employees to use the knowledge and skills learned in training sessions to be applied into work (Muduli & Raval, 2018).
Transfer motivation is also an important role in the training transfer process. Research has been proven by Muduli and Raval (2018) shows that transfer motivation has a significant positive effect on training transfer. Based on the problem, the purpose of this study is to re-test the transfer of training with the context of the research object and explore more in the role of mediation so whether the results will be the same or not. Based on the background above, the review of the literature is the following:
METHODThis study examines the transfer of training to employees of the Kantor Pelayanan
Pajak (KPP) Pratama in Semarang Timur and Selatan. The number of samples that researchers took was 130 respondents with proportional random sampling as a sampling technique. The 130 questionnaires returned were then filtered and examined for the completeness of the data.
The variable of this research is the training transfer using the instrument adopted by Tesluk al. (1995). Supervisor support variable using the instrument adopted by Chauhan et al. (2017). The peer support variable uses the instrument adopted by Chatterjee, Pereira, & Sarkar (2016). The last variable is transfer motivation as mediation using the instrument adopted by Chatterjee et al. (2016). Each variable has an indicator namely: training transfer has 3 indicators with 5 statements, according to Tesluk et al. (1995) it is the use of new skills to improve performance, training helps improve performance, and Incorporate skills that have been learned into daily work. Indicators of supervisor support variable according to Chauhan et al. (2017) there are 4 indicators with 12 statements namely: support for the use of training in the workplace, direction of the use of training methods, barriers to use of training and informational support.
Indicator of the peer support variable according to Chatterjee et al. (2016) there are 3 indicators with 3 statements namely giving positive feedback, providing assistance and encouraging the application of training and expectations of performance development after conducting training. Then the indicator of the last variable is transfer motivation according Chatterjee et al. (2016) there are 3 indicators with 6 statements namely self-confidence to implement the results of training, the importance of training on performance, and the usefulness of training on task completion.
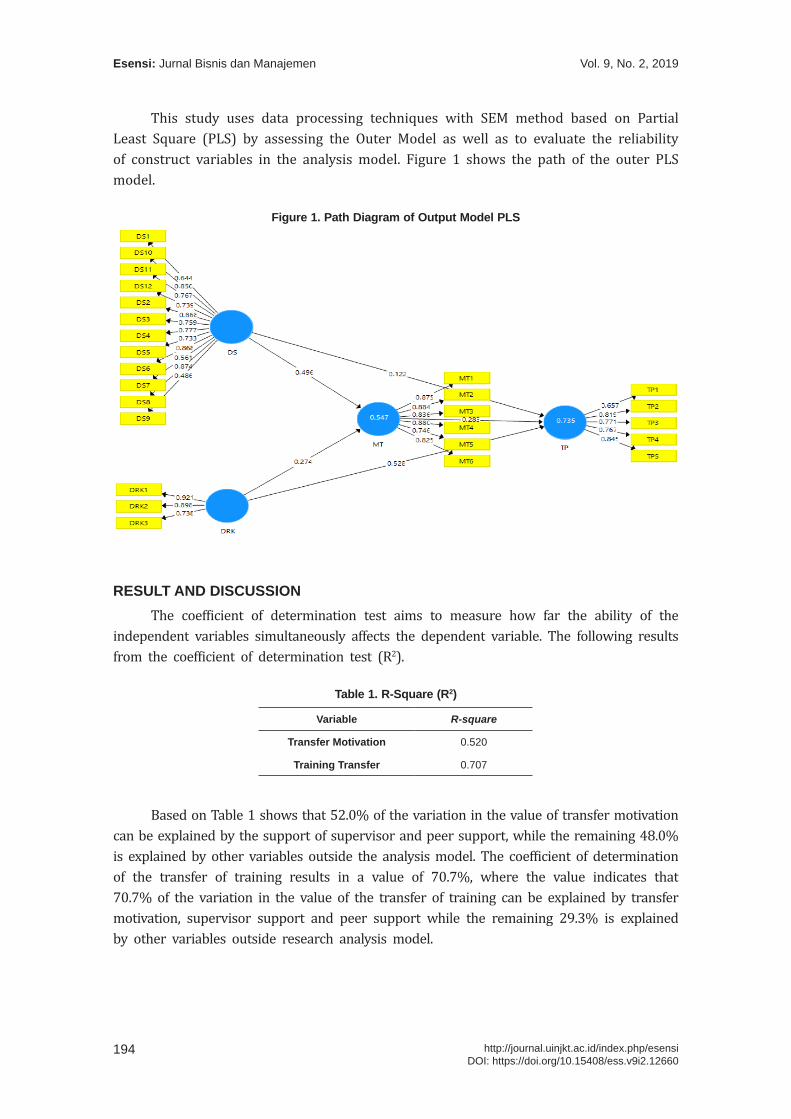
Vol. 9, No. 2, 2019Esensi: Jurnal Bisnis dan Manajemen
194 http://journal.uinjkt.ac.id/index.php/esensiDOI: https://doi.org/10.15408/ess.v9i2.12660
This study uses data processing techniques with SEM method based on Partial Least Square (PLS) by assessing the Outer Model as well as to evaluate the reliability of construct variables in the analysis model. Figure 1 shows the path of the outer PLS model.
Figure 1. Path Diagram of Output Model PLS
RESULT AND DISCUSSIONThe coefficient of determination test aims to measure how far the ability of the
independent variables simultaneously affects the dependent variable. The following results from the coefficient of determination test (R2).
Table 1. R-Square (R2)
Variable R-square
Transfer Motivation 0.520
Training Transfer 0.707
Based on Table 1 shows that 52.0% of the variation in the value of transfer motivation can be explained by the support of supervisor and peer support, while the remaining 48.0% is explained by other variables outside the analysis model. The coefficient of determination of the transfer of training results in a value of 70.7%, where the value indicates that 70.7% of the variation in the value of the transfer of training can be explained by transfer motivation, supervisor support and peer support while the remaining 29.3% is explained by other variables outside research analysis model.
195
Does Transfer Motivation Succeed in MediatingDida Sovia Wirdani
http://journal.uinjkt.ac.id/index.php/esensiDOI: https://doi.org/10.15408/ess.v9i2.12660
Table 2. Path Coefficient
Variable Original Sample (O)
Sample Mean (M)
Standard Deviation T-Statistics P-Value
SS – TT 0,071 0,074 0,097 0,730 0,233
SS - TM 0,357 0,355 0,120 2,983 0,001
PS - TM 0,524 0,529 0,094 5,551 0,000
PS - TM 0,408 0,409 0,114 3,584 0,000
TM - TT 0,325 0,319 3,600 3,600 0,000
Hypothesis testing is based on the Inner Model test results by taking into account the original sample, t-statistics and p-values. Hypothesis testing is divided into two, namely direct and indirect influences through the results of the bootstrapping test. The rule of thumb used in this study is t-statistic > 1,645 with a significance level of 5% and a positive original sample (beta coefficient) value. Direct test results can be seen in the path coefficient.
Table 3. Total Indirect Effect
Variable Original Sample (O)
Sample Mean (M)
Standard Deviation T-Statistics P-Value
SS – TT 0,116 0,111 0,045 2,607 0,005
PS - TT 0,133 0,132 0,057 2,334 0,01
The support given by the leader has a relationship with the level of transfer of training. Supervisors have a positive influence on the ability of employees to transfer material or knowledge, skills and attitudes obtained in training for work completion in the office (Muduli & Raval, 2018). Leaders have worked to increase the transfer of tax employee training in the workplace. Providing training to tax officials 2-3 times a year has carried out the form of efforts, but the training is not carried out internally, but is carried out centrally at the central office.
When colleagues at KPP Pratama Semarang Timur and Selatan fully support other colleagues to conduct training transfers, the success of other employees in implementing training results to the workplace will increase. Colleagues have sought to increase the transfer of tax employee training at the workplace. Forms of efforts that have been made by providing positive support and mutual understanding of the benefits of using knowledge and skills for the completion of office tasks. The results of this study were also supported by previous researchers who stated that peer support had a positive effect on the transfer of training (Na-nan et al., 2017; Muduli & Raval, 2018).
When supervisors provide direction, positive and constructive support, and provide assistance in the form of joint discussions when employees experience difficulties in transferring training, then the employee will grow in self-motivation, confidence and desire to transfer training. The leader distributes work-related information to employees considered that the leadership had made the transfer motivation they had high because the leaders were willing

Vol. 9, No. 2, 2019Esensi: Jurnal Bisnis dan Manajemen
196 http://journal.uinjkt.ac.id/index.php/esensiDOI: https://doi.org/10.15408/ess.v9i2.12660
to provide the information needed by the employees. Therefore, employees feel directed and clear with the job desk that will be completed by using the skills and knowledge that have been learned from the training. The results of this study are also supported by Bhatti et al. (2014) that states that superiors’ support can influence employee motivation to be high and willing to transfer training.
When co-workers provide positive support, mutual confidence that the results of the training can be useful to improve performance, then employees who have attended the training will have high motivation to transfer the results of training to the workplace. Colleagues understand each other the employee who will use the new skills learned from the training. The results of this study are also supported by previous researchers who stated that coworkers provide high positive support to other coworkers able to influence motivation on these coworkers to transfer training results at work (Bhatti et al., 2013).
The higher the transfer motivation possessed by employe’s, the successful process of implementing training results to the workplace will increase. The process of transferring training will be successful not only depends on the factors of leader and coworkers, but must be driven by personal factors such as transfer motivation because motivation is the main driver of one’s behavior in a job (Martono et al., 2018). The greater the motivation of employees to transfer training results, the implementation of knowledge and skills learned will be successfully utilized to achieve the tax revenue target every month. Therefore, the Direktorat Jenderal Pajak asked all tax authorities to be able to take advantage of the results of training that have been followed for routine office work, such as providing tax payment services, to process tax revenue achievement targets properly.
The results of this study are also supported by previous studies that provide results of transfer motivation possessed by employees have a positive influence on the success of the process of transferring the results of training on work at work, which means high employee transfer motivation, the transfer of training will be successful too (Iqbal & Dastgeer, 2015; Reinhold et al., 2018).
Total indirect effects show that transfer motivation is able to mediate the relationship between supervisor support and training transfer, then H6 is supported. That is, the more the boss increases providing support to employees, then making the motivation of employees to transfer training results will increase, this will also increase the successful implementation of training results or transfer training in the workplace. Leaders have encouraged their employees to attend training organized by the DJP, then supervised their employees when managing the results of the training that have been learned to the completion of work and provide guaranteed facilities. increase the transfer motivation. When the transfer motivation employees is high, it will have an impact on the transfer of training with increased results as well.
This study has answered the questions of previous researchers who suspected the lack of support from superiors in the transfer of training. It turns out that there is an intermediate factor of these two relationships, namely transfer motivation. The results of this study are also supported by previous research which states that superiors’ support has an indirect influence on the transfer of training because there is an intermediate factor
197
Does Transfer Motivation Succeed in MediatingDida Sovia Wirdani
http://journal.uinjkt.ac.id/index.php/esensiDOI: https://doi.org/10.15408/ess.v9i2.12660
(mediation) which becomes the process of transferring training to be successful, namely transfer motivation (Suleiman et al., 2017; Reinhold et al., 2018).
The total indirect effects show that transfer motivation is able to mediate the relationship between peer supports on training transfer, then H6 is supported. That is, the more coworkers increase to provide support to employees, then the motivation of employees to transfer training results will increase, and this will also increase the successful implementation of training results or transfer training in the workplace. Employees will transfer training not only because of coworkers but there must be their own desire from employees to transfer training. When coworkers in a work team are less supportive and difficult to work with to transfer training, then employees must be able to control themselves to believe if the training results can be developed to achieve the targets and performance desired by superiors. This research is supported by a statement stating that work environment factors such as peer support are not enough to analyze the training transfer mode (Suleiman et al., 2017).
CONCLUSIONBased on the results of research that has been discussed that supervisor support
has a positive effect on the transfer of training. Then, peer support has a positive effect on the transfer of training. Supervisor support has a positive effect on transfer motivation. On one hand, peer support has a positive effect on transfer motivation. This means that the positive and constructive support given by employees of KPP Pratama Semarang Timur and Selatan to other employees increases the motivation for employee transfers. Transfer motivation is able to mediate the relationship between supervisor support and training transfer and the relationship between peer support and training transfer. Because of this, the successful implementation of knowledge, skills and attitudes learned in training will succeed in improving employee performance.
This study provides suggestions for further research that is expected to further researchers who will examine the transfer of training are able to present other variables apart from work environment factors such as the support of superiors and coworkers. In addition, it raises indirect effects caused by factors other than personal factors (transfer motivation). Further researchers are also expected to conduct training transfer research on different research objects and respondents taken more specifically such as employees who have attended training for the past 6 months and so on.
REFERENCESAl-Eisa, A. S., Furayyan, M. A., & Alhemoud, A. M. (2009). An Empirical Examination of
The Effects of Self-Efficacy, Supervisor Support and Motivation to Learn on Transfer Intention. Management Decision, 47(8), 1221–1244.
Aspiyah, M., & Martono, S. (2016). Pengaruh Disiplin Kerja, Lingkungan Kerja dan Pelatihan pada Produktivitas Kerja. Management Analysis Journal, 5(4), 339–346.
Bhatti, M. A., Ali, S., Isa, M. F. M., & Battour, M. (2014). Training Transfer and Transfer Motivation: The Influence of Individual, Environmental, Situational, Training Design,
Vol. 9, No. 2, 2019Esensi: Jurnal Bisnis dan Manajemen
198 http://journal.uinjkt.ac.id/index.php/esensiDOI: https://doi.org/10.15408/ess.v9i2.12660
and Affective Reaction Factors. Performance Improvement Quarterly, 27(1), 51–82. Bhatti, M. A., Battour, M. M., Sundram, V. P. K., & Othman, A. A. (2013). Transfer of Training:
Does it Truly Happen? An Examination of Support, Instrumentality, Retention and Learner Readiness on The Transfer Motivation and Transfer of Training. European Journal of Training and Development, 37(3), 273–297.
Bjerregaard, K., Haslam, S. A., & Morton, T. (2016). How Identification Facilitates Effective Learning: The Evaluation of Generic Versus Localized Professionalization Training. International Journal of Training and Development, 20(1), 17–37.
Chatterjee, A., Pereira, A., & Sarkar, B. (2016). Learning Transfer System Inventory (LTSI) and Knowledge Creation in Organizations. The Learning Organization, 1–16.
Chauhan, R, Ghosh, P., Rai, A., & Kapoor, S. (2017). Improving Transfer of Training with Transfer Design: Does Supervisor Support Moderate The Relationship? Journal of Workplace Learning, 29(4), 1–24.
Chauhan, Ragini, Ghosh, P., & Rai, A. (2016). The Impact of Support at The Workplace on Transfer of Training: A Study of an Indian Manufacturing Unit. International Journal of Training and Development, 20(3), 200–213.
Colquitt, J. A., Lepine, J. A., & Noe, R. A. (2000). Toward an Integrative Theory of Training Motivation : A Meta-Analytic Path Analysis of 20 Years of Research. Journal of Applied Psychology, 85(5), 678–707.
Cowman, M. C., & Mccarthy, A. M. (2016). The Impact of Demographic and Situational Factors on Training Transfer in a Health Care Setting. Irish Journal of Management, 35(2), 129–142.
Fitriani, Y., & Wulansari, N. . (2018). Impact of Empowering Leadership on Employee Creativity by Motivationto to Learn and Trust in Leader as a Mediation. Management Analysis Journal, 7(2), 244–253.
Gegenfurtner, A. (2011). Motivation and Transfer in Professional Training: A Meta-Analysis of The Moderating Effects of Knowledge Type, Instruction, and Assessment Conditions. Educational Research Review, 6(3), 153–168.
Hairo, A. ., & Martono, S. (2019). Satisfaction on Work Productivity. Management Analysis Journal, 8(1).
Hua, N. G. K. (2013). The Influence of Supervisory and Peer Support on The Transfer of Training. Studies in Business and Economics, 82–97.
Hurt, K. J. (2016). A theoretical model of training and its transference : the pivotal role of top management team composition and characteristics. Human Resource Development International, 1–24.
Iqbal, K., & Dastgeer, G. (2015). Impact of Self Efficacy and Retention on Transfer of Training:The Mediating Role of Motivation to Transfer. Journal of Management Development, 6, 1–19.
Martono, S., Khoiruddin, M., & Wulansari, N. . (2018). Remuneration Reward Management System as a Driven Factor of Employee Performance. International Journal of Business & Society, 19, 535–545.

199
Does Transfer Motivation Succeed in MediatingDida Sovia Wirdani
http://journal.uinjkt.ac.id/index.php/esensiDOI: https://doi.org/10.15408/ess.v9i2.12660
Martono, S., & Putri, V. . (2018). HRM Practices in Indonesia: the Contributing Power of Embeddedness and Support. Jurnal Dinamika Manajemen, 9(2), 206–217.
Muduli, A., & Raval, D. (2018). Examining The Role of Work Context, Transfer Design and Transfer Motivation on Training Transfer. European Journal of Training and Development, 12(4), 1–18.
Na-nan, K., Chaiprasit, K., & Pukkeeree, P. (2017). Influences of Workplace Environment Factors on Employees’ Training Transfer. Industrial and Commercial Training, 2, 1–13.
Nijman, D., & Gelissen, J. (2011). Supporting workplace learning, professional and practice-based learning 5. In Springer Science Business Media (pp. 89–106).
Noorizan, M. ., Afzan, N. ., Norfazlina, A. ., & Akma, S. (2016). The Moderating Effects of Motivation on Work Environment and Training Transfer: A Preliminary Analysis. Procedia Economics and Finance, 37(16), 158–163.
Nurdiana, L. (2014). Pengaruh Dukungan Supervisor dan Dukungan Rekan Kerja Terhadap Transfer Pelatihan Karyawan Mekanik. Jurnal Ilmu Manajemen, 2(2), 675–686.
Nurlaila, F., & Sudarma, K. (2017). Pengaruh Tuntutan Pekerjaan, Tipe Kepribadian Ekstrovert dan Dukungan Supervisor pada Kelelahan Emosional. Management Analysis Journal, 6(4), 423–434.
Pham, N. T. ., Segers, M. S. ., & Gijselaers, W. H. (2012). Effects of Work Environment on Transfer of Training: Empirical Evidence from Master of Business Administration Programs in Vietnam. International Journal of Training and Development, 17(1), 1–19.
Ranihusna, D. (2010). Efek Rantai Motivasi Pada Kinerja Karyawan. Jurnal Dinamika Manajemen, 1(2), 90–103.
Reinhold, S., Gegenfurtner, A., & Lewalter, D. (2018). Social support and motivation to transfer as predictors of training transfer : testing full and partial mediation using meta-analytic structural equation modelling. International Journal of Training and Development, 22(1), 1–14.
Sudarma, K. (2012). Mencapai Sumber Daya Manusia Unggul (Analisis Kinerja Dan Kualitas Pelayanan). Jurnal Dinamika Manajemen, 3(1), 76–83.
Suleiman, W., Dassanayake, M. ., & Othman, A. E. A. (2017). Mediation of transfer motivation on the relationship between supervisor support, peer support and transfer of training. International Journal of Business and Society, 18(3), 605–617.
Switzer, K. C., Nagy, M. S., & Mullins, M. E. (2005). The Influence of Training Reputation, Managerial Support, and Self-Efficacy on Pre-Training Motivation and Perceived Training Transfer. Applied Human Resource Management Research, 10(1), 21–34.
Tesluk, P. E., Farr, J. L., Mathieu, J. E., & Vance, R. J. (1995). Generalization of Employee Involvement Training to The Job Setting: Individual and Situational Effects. Personn, 48, 607–632.
Tian, A. W., Cordery, J., & Gamble, J. (2016). Returning The Favor: Positive Employee Responses to Supervisor and Peer Support for Training Transfer. International Journal of Training and Development, 20(1), 1–16.
Tracey, J. B., & Tews, M. J. (2005). Construct Validity of a General Training Climate Scale. Organizational Research Methods, 8(4), 1–43.

Vol. 9, No. 2, 2019Esensi: Jurnal Bisnis dan Manajemen
200 http://journal.uinjkt.ac.id/index.php/esensiDOI: https://doi.org/10.15408/ess.v9i2.12660
Velada, R., Caetano, A., Michel, J. W., Lyons, B. D., & Kavanagh, M. J. (2007). The Effects of Training Design, Individual Characteristics and Work Environment on Transfer of Training. International Journal of Training and Development, 11(4), 282–294.
Yuniawan, A., Putri, V. W., & Udin. (2017). Developing an Alternative Model for the Relationship among Social Capital, Adaptive-Integrative Leadership, Competitive Advantage, and Organizational Effectiveness. International Journal of Civil Engineering and Technology, 8(11), 52–60.
Bambang Sutrisno1*, Andry Priharta2
1, 2 Universitas Muhammadiyah [email protected], [email protected]*Penulis korespondensi
AbstractThe right issue announcement may lead the market to react and affect the stock performance. This study aims to analyze the effect of the right issue on the abnormal return. This research uses a sample of 18 firms listed in the Indonesia Stock Exchange from 2014 to 2016. This study employs one sample t test and wilcoxon test. The results show that there is no abnormal return in the days surrounding right issue announcement. The results also find that there is no difference in abnormal return between after and before the right issue announcement. This research implies that the existing stockholders and investors need to consider carefully before deciding to invest in go public companies do the right issue. Keywords: right issue, abnormal return, event study, nonparametric test
AbstrakPengumuman penawaran saham terbatas menyebabkan pasar bereaksi dan memengaruhi kinerja saham. Penelitian ini bertujuan untuk menganalisis pengaruh penawaran saham terbatas terhadap abnormal return. Penelitian ini menggunakan sampel 18 perusahaan terdaftar di Bursa Efek Indonesia dari tahun 2014 hingga 2016. Penelitian ini menggunakan uji t one sample dan uji wilcoxon. Hasil penelitian menunjukkan bahwa tidak terdapat abnormal return pada hari-hari di sekitar pengumuman penawaran saham terbatas. Hasil penelitian juga menemukan bahwa tidak ada perbedaan abnormal return sesudah dan sebelum pengumuman penawaran saham terbatas. Penelitian ini berimplikasi bahwa pemegang saham lama dan investor perlu mempertimbangkan secara matang sebelum memutuskan berinvestasi pada perusahaan terbuka yang melakukan penawaran saham terbatas. Kata kunci: penawaran saham terbatas, return tak normal, studi peristiwa, uji nonparametrik
Reaksi Pasar terhadap Pengumuman Penawaran Saham Terbatas di Indonesia
Draft awal: 15 April 2019; Revisi: 20 Juni 2019; Diterima: 15 Juli 2019http://journal.uinjkt.ac.id/index.php/esensiDOI: https://doi.org/10.15408/ess.v9i2.8080
Esensi: Jurnal Bisnis dan ManajemenVolume 9 (2), 2019
P-ISSN: 2087-2038; E-ISSN:2461-1182Halaman 201 - 208
Vol. 9, No. 2, 2019Esensi: Jurnal Bisnis dan Manajemen
202 http://journal.uinjkt.ac.id/index.php/esensiDOI: https://doi.org/10.15408/ess.v9i2.8080
PENDAHULUANPasar modal adalah pasar untuk memperjualbelikan sekuritas yang umumnya memiliki
umur lebih dari satu tahun, seperti saham dan obligasi. Menurut Tandelilin (2010), definisi pasar modal adalah tempat berbagai pihak, khususnya perusahaan menjual saham dan obligasi, dengan tujuan dari hasil penjualan tersebut nantinya akan dipergunakan sebagai tambahan dana atau memperkuat modal perusahaan. Sebagaimana pasar tradisional, pasar modal merupakan sarana untuk menjembatani antara pihak yang mempunyai kelebihan dana (investor) dengan pihak yang membutuhkan dana (emiten).
Keberadaan pasar modal mempunyai manfaat ditinjau dari dua pihak. Pertama, ditinjau dari pihak perusahaaan yang memerlukan dana, pasar modal dapat digunakan sebagai sumber untuk perolehan dana. Kedua, ditinjau dari sisi pemodal, kehadiran pasar modal dapat digunakan sebagai sarana untuk menyalurkan dana (investasi), sehingga akan diperoleh penghasilan yang disebut perolehan investasi dalam bentuk peningkatan nilai modal (capital gain) dan laba hasil usaha yang dibagikan (dividen) untuk investasi pada pasar saham.
Seiring dengan persaingan dunia usaha yang semakin kompetitif, manajemen perusahaan dituntut untuk melakukan terobosan-terobosan guna tetap menjaga eksistensi perusahaan. Terobosan-terobosan ini termasuk ekspansi, membuka cabang baru, dan lain sebagainya. Upaya ini tentu saja tidak terlepas dari kebutuhan dana dan modal yang sangat besar. Selain dana yang diperoleh dari dalam perusahaan sendiri, perusahaan dapat mengandalkan dana yang diperoleh dari luar perusahaan. Dana yang diperoleh dari luar ini dapat diperoleh dari bank atau dana langsung dari usaha penjualan surat berharga di bursa efek (go public). Banyak perusahaan melakukan penawaran saham kepada publik di luar initial public offering (IPO) atau penawaran saham perdana. Hal ini dilakukan oleh perusahaan yang membutuhkan tambahan dana untuk membiayai kegiatan usaha atau untuk membayar utang yang telah jatuh tempo. Kegiatan yang dilakukan oleh perusahaan tersebut biasa dikenal dengan right issue atau penawaran saham terbatas.
Raja (2012) menyatakan bahwa penawaran saham terbatas merupakan penawaran saham susulan yang memberikan prioritas kepada pemegang saham perusahaan yang sudah ada untuk membeli saham baru pada harga tertentu dan saat tertentu pula. Dengan kata lain, perusahaan mendistribusikan hak opsi kepada pemegang saham agar dapat memperoleh saham baru dengan harga khusus. Raja (2012) mengungkapkan bahwa perusahaan dengan kepemilikan saham yang terkonsentrasi akan cenderung menggunakan penawaran saham terbatas untuk memperoleh tambahan modal.
Ada beberapa alasan yang mendasari mengapa perusahaan melakukan penawaran saham terbatas. Beberapa diantaranya yaitu untuk menambah modal perusahaan, perluasan investasi atau untuk pembayaran utang (Sugiana & Surya, 2013). Saham baru yang diterbitkan terlebih dahulu ditawarkan kepada pemegang saham yang sudah ada sekarang (existing shareholders) dengan harga yang biasanya lebih rendah daripada harga yang ditawarkan di pasar dikarenakan para pemegang saham memiliki hak memesan efek terlebih dahulu atas saham-saham baru tersebut (preemptive right).
Penilaian kinerja perusahaan merupakan hal yang sangat penting, karena dengan adanya pengetahuan yang benar tentang kinerja suatu perusahaan, perusahaan publik, investor,
203
Reaksi Pasar terhadap Pengumuman Penawaran Saham TerbatasBambang Sutrisno
http://journal.uinjkt.ac.id/index.php/esensiDOI: https://doi.org/10.15408/ess.v9i2.8080
dan pihak-pihak yang berkepentingan akan dapat menekan kemungkinan kesalahan dalam pengambilan keputusan. Penilaian kinerja perusahaan penting dilakukan oleh manajemen perusahaan, pemegang saham, pemerintah maupun stakeholder yang lain, karena menyangkut distribusi kesejahteraan diantara mereka.
Ketika perusahaan melakukan kebijakan penawaran saham terbatas, pemodal umumnya hanya mempunyai informasi tentang perusahaan emiten secara terbatas, yakni hanya sebatas pada apa yang dipaparkan di dalam prospektus menjelang penawaran saham terbatas. Jadi, calon investor harus menggunakan segala daya dan upaya untuk menilai kewajaran harga yang ditawarkan. Harga saham di pasar sekunder ditentukan oleh kekuatan pasar berdasarkan kinerja perusahaan yang bersangkutan dan keadaan perekonomian (Bashir, 2013). Investor tentu sangat berharap kinerja yang dimiliki oleh perusahaan menjadi lebih baik setelah melakukan penawaran saham terbatas karena dengan adanya penawaran saham terbatas berarti dana dari pihak luar masuk ke perusahaan. Harapan dari pihak-pihak yang berkepentingan tersebut belum tentu menjadi kenyataan. Apabila kinerja perusahaan tidak membaik setelah melakukan penawaran saham terbatas, tentu saja akan mengurangi kepercayaan terhadap perusahaan tersebut, bahkan secara luas dapat menghilangkan kepercayaan terhadap pasar modal sehingga investor lebih tertarik untuk melakukan investasi pada sektor perbankan, yakni deposito. Hal ini akan sangat merugikan keberlangsungan pasar modal karena pasar modal akan ditinggalkan oleh para investor.
Salah satu ukuran dari kinerja perusahaan adalah kinerja saham (Kithinji dkk., 2014). Kinerja saham akan mengindikasikan kinerja pasar perusahaan yang dapat diukur dengan menggunakan nilai pasar saham perusahaan yang beredar di pasar modal. Kinerja saham dapat diukur dengan meninjau harga saham perusahaan di pasar modal.
Beberapa penelitian tentang kinerja saham perusahaan yang melakukan penawaran saham terbatas sudah dilakukan di pasar modal. Miglani (2011) dan Bashir (2013) menunjukkan bahwa terdapat abnormal return positif di hari-hari sekitar penawaran saham terbatas di India dan Pakistan. Raja (2012) membuktikan bahwa terdapat perbedaan abnormal return sebelum dan sesudah pengumuman penawaran saham terbatas di India. Secara berlawanan, Suresha dan Naidu (2012) di India, Otieno dan Oching (2015) di Kenya menemukan adanya abnormal return negatif pada tanggal pengumuman penawaran saham terbatas. Ogada dan Kalunda (2017) menyimpulkan bahwa tidak ada perbedaan abnormal return sebelum dan sesudah pengumuman penawaran saham terbatas di Kenya.
Kontribusi dari penelitian ini adalah menguji lebih lanjut akan inkonsistensi hasil studi empiris sebelumnya yang fokus pada pengaruh penawaran saham terbatas terhadap abnormal return. Penelitian ini memiliki dua tujuan penelitian. Pertama, penelitian ini menguji ada tidaknya abnormal return di hari-hari sekitar pengumuman penawaran saham terbatas di Bursa Efek Indonesia. Kedua, penelitian ini akan melihat apakah terdapat perbedaan abnormal return sebelum dan sesudah penawaran saham terbatas.
METODEPopulasi dalam penelitian ini adalah semua perusahaan yang terdaftar di Bursa Efek
Indonesia yang melakukan penawaran saham terbatas untuk periode tahun 2014-2016.
Vol. 9, No. 2, 2019Esensi: Jurnal Bisnis dan Manajemen
204 http://journal.uinjkt.ac.id/index.php/esensiDOI: https://doi.org/10.15408/ess.v9i2.8080
Alasan pemilihan periode tahun 2014 sampai tahun 2016 karena periodenya lebih terkini. Adapun teknik pengambilan sampel dalam penelitian ini adalah purposive sampling. Beberapa pertimbangan yang digunakan adalah sebagai berikut: Pertama, perusahaan melakukan satu kali kebijakan penawaran saham terbatas selama periode penelitian. Kedua, perusahaan tidak melakukan penawaran saham terbatas pada periode bulan Januari sampai Mei karena laporan keuangan tahunan perusahaan belum diaudit sehingga jika dimasukkan dalam perhitungan belum mencerminkan kondisi riil perusahaan. Ketiga, perusahaan tidak termasuk dalam sektor keuangan karena penekanan analisis rasio-rasio di sektor keuangan berbeda dengan penekanan analisis rasio-rasio di sektor lain. Keempat, saham perusahaan tidak melakukan corporate actions yang lain (seperti stock split, pembagian dividen, dan lain-lain) pada periode satu bulan sebelum dan sesudah penawaran saham terbatas. Kelima, saham perusahaan dengan beta nol atau negatif tidak dianalisis karena harga saham perusahaan dengan beta nol atau negatif cenderung tidak mengalami perubahan (saham tidur). Dengan menggunakan metode purposive sampling, maka diperoleh sampel penelitian sebanyak 18 perusahaan.
Data dalam penelitian ini merupakan data sekunder, yaitu data perusahaan yang melakukan penawaran saham terbatas tahun 2014-2016, pergerakan harga saham dari sampel penelitian, dan pergerakan IHSG. Data perusahaan yang melakukan penawaran saham terbatas tahun 2014-2016 dan tanggal pengumuman penawaran saham terbatas diperoleh dari situs Bursa Efek Indonesia yaitu www.idx.co.id. Sedangkan data pergerakan harga saham dari sampel penelitian dan IHSG diperoleh melalui situs www.finance.yahoo.com.
Penelitian ini merupakan penelitian berbasis studi peristiwa (event study). Kendirli & Elmali (2016) menyebutkan bahwa studi peristiwa merupakan studi yang mempelajari reaksi pasar terhadap suatu peristiwa (event) yang informasinya dipublikasikan sebagai suatu pengumuman. Dalam menganalisis kinerja saham yang diproksikan dengan abnormal return, periode waktu yang digunakan adalah selama 101 hari bursa yang dibagi menjadi dua periode, yaitu periode estimasi yang digunakan untuk mengestimasi beta, dan periode peristiwa yang digunakan dalam pengujian hipotesis. Periode estimasi selama 90 hari, yaitu dari t-95 hingga t-6 sebelum peristiwa. Periode peristiwa selama 11 hari, yakni terdiri dari 5 hari sebelum peristiwa (pre event), saat peristiwa (event day), dan 5 hari sesudah peristiwa (post event). Periode peristiwa dipilih 11 hari dengan alasan untuk menghindari adanya efek dari peristiwa lain selain penawaran saham terbatas.
Abnormal return dihitung dengan menggunakan rumus berikut:ARit = Rit – E(Rit) (1)
dimana ARit adalah abnormal return saham i pada periode t, Rit adalah tingkat keuntungan saham i pada periode t, dan E(Rit) adalah expected return saham i pada periode t.
Pengujian terhadap normalitas data menggunakan uji Shapiro-Wilk karena jumlah sampel yang diamati (n) kurang dari 50. Uji normalitas data bertujuan untuk menguji apakah data yang akan diteliti berdistribusi normal atau tidak (Ghozali, 2016). Dengan mengetahui data tersebut berdistribusi normal atau tidak maka selanjutnya dapat ditentukan alat uji untuk menjawab tujuan penelitian. Penelitian ini menerapkan uji nonparametrik. Tujuan penelitian pertama dijawab dengan menggunakan uji t one sample dan wilcoxon one sample. Sedangkan tujuan penelitian kedua dijawab dengan menggunakan uji wilcoxon paired samples.

205
Reaksi Pasar terhadap Pengumuman Penawaran Saham TerbatasBambang Sutrisno
http://journal.uinjkt.ac.id/index.php/esensiDOI: https://doi.org/10.15408/ess.v9i2.8080
HASIL DAN PEMBAHASANTabel 1 menyajikan ringkasan statistik abnormal return sebelum dan sesudah
pengumuman penawaran saham terbatas. Rata-rata abnormal return sebelum dan sesudah pengumuman penawaran saham terbatas secara keseluruhan adalah -0,626% dan –0,443%. Artinya, abnormal return setelah pengumuman penawaran saham terbatas secara rata-rata lebih tinggi daripada sebelum pengumuman. Temuan ini serupa dengan Otieno dan Ochieng (2015) serta Ogada dan Kalunda (2017). Median abnormal return pada hari-hari sebelum pengumuman penawaran saham terbatas semua bernilai negatif, sedangkan median abnormal return pada hari-hari sesudah pengumuman penawaran saham terbatas ada yang bernilai positif dan negatif. Nilai rata-rata dan median abnormal return yang negatif menyiratkan bahwa pengumuman penawaran saham terbatas dimaknai negatif oleh para pelaku pasar.
Pengujian normalitas data dilakukan untuk mengetahui apakah data penelitian berdistribusi normal atau tidak. Hasil pengujian normalitas data abnormal return saham disajikan dalam Tabel 2. Data berdistribusi normal pada hari -4, +4, dan abnormal return keseluruhan sebelum pengumuman penawaran saham terbatas. Sedangkan data tidak berdistribusi normal pada hari -5, -3, -2, -1, +1, +2, +3, +5, dan abnormal return keseluruhan sesudah pengumuman penawaran saham terbatas.
Tabel 1. Statistik Deskriptif Abnormal Return Saham
Hari AbnormalReturn Rata-Rata Median Deviasi
Standar Minimum Maksimum
5Sebelum -0,01089 -0,00377 0,04039 -0,13548 0,05777
Sesudah -0,04123 -0,01091 0,10804 -0,40588 0,09619
4Sebelum -0,00191 -0,00227 0,01824 -0,03717 0,03304
Sesudah 0,01669 0,01295 0,04277 -0,06203 0,10027
3Sebelum -0,00612 -0,00417 0,02638 -0,05305 0,07848
Sesudah 0,00553 0,00115 0,07376 -0,09327 0,25022
2Sebelum -0,00251 -0,00243 0,03633 -0,08109 0,10223
Sesudah -0,00315 -0,00373 0,06028 -0,15859 0,15404
1Sebelum -0,00987 -0,00608 0,04047 -0,12382 0,04807
Sesudah 0,00002 -0,00047 0,02694 -0,04709 0,06432
Keseluruhan SebelumSesudah
-0,00626-0,00443
-0,003030,00292
0,015880,03484
-0,03560-0,09633
0,024040,03742
Tujuan pertama dalam penelitian ini adalah untuk menganalisis apakah terdapat abnormal return pada hari-hari di sekitar pengumuman penawaran saham terbatas di Bursa Efek Indonesia. Pengujian terhadap ada tidaknya abnormal return menggunakan uji t one sample dan wilcoxon one sample karena terdapat data yang berdistribusi normal dan tidak normal. Tabel 3 menunjukkan bahwa ada dua hari dimana abnormal return yang diperoleh adalah berbeda dengan nol. Artinya ada abnormal return pada dua hari tersebut, yaitu hari -3 dan +5, dimana abnormal return yang diperoleh signifikan pada tingkat 10% walaupun nilai abnormal return-nya adalah negatif. Sedangkan pada hari-hari lain tidak ditemukan abnormal return. Artinya abnormal return yang terjadi tidak berbeda dengan nol.
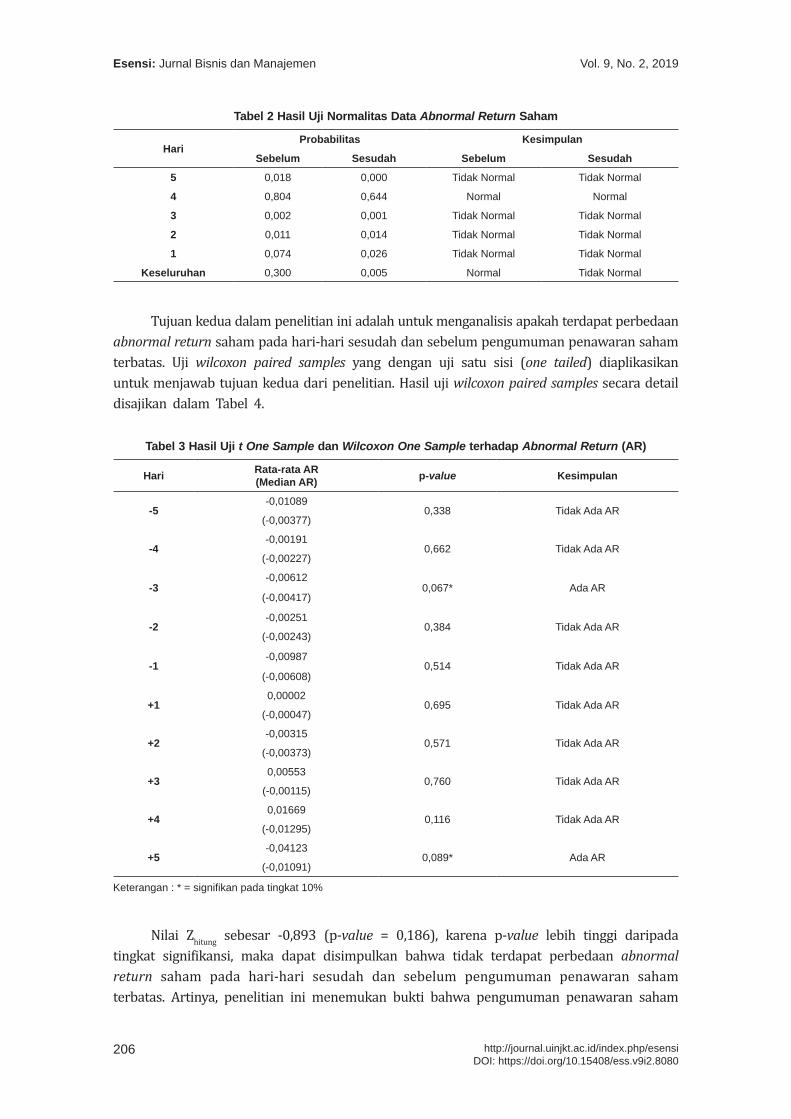
Vol. 9, No. 2, 2019Esensi: Jurnal Bisnis dan Manajemen
206 http://journal.uinjkt.ac.id/index.php/esensiDOI: https://doi.org/10.15408/ess.v9i2.8080
Tabel 2 Hasil Uji Normalitas Data Abnormal Return Saham
HariProbabilitas Kesimpulan
Sebelum Sesudah Sebelum Sesudah
5 0,018 0,000 Tidak Normal Tidak Normal
4 0,804 0,644 Normal Normal
3 0,002 0,001 Tidak Normal Tidak Normal
2 0,011 0,014 Tidak Normal Tidak Normal
1 0,074 0,026 Tidak Normal Tidak Normal
Keseluruhan 0,300 0,005 Normal Tidak Normal
Tujuan kedua dalam penelitian ini adalah untuk menganalisis apakah terdapat perbedaan abnormal return saham pada hari-hari sesudah dan sebelum pengumuman penawaran saham terbatas. Uji wilcoxon paired samples yang dengan uji satu sisi (one tailed) diaplikasikan untuk menjawab tujuan kedua dari penelitian. Hasil uji wilcoxon paired samples secara detail disajikan dalam Tabel 4.
Tabel 3 Hasil Uji t One Sample dan Wilcoxon One Sample terhadap Abnormal Return (AR)
Hari Rata-rata AR(Median AR) p-value Kesimpulan
-5-0,01089
0,338 Tidak Ada AR(-0,00377)
-4-0,00191
0,662 Tidak Ada AR(-0,00227)
-3-0,00612
0,067* Ada AR(-0,00417)
-2-0,00251
0,384 Tidak Ada AR(-0,00243)
-1-0,00987
0,514 Tidak Ada AR(-0,00608)
+10,00002
0,695 Tidak Ada AR(-0,00047)
+2-0,00315
0,571 Tidak Ada AR(-0,00373)
+30,00553
0,760 Tidak Ada AR(-0,00115)
+40,01669
0,116 Tidak Ada AR(-0,01295)
+5-0,04123
0,089* Ada AR(-0,01091)
Keterangan : * = signifikan pada tingkat 10%
Nilai Zhitung sebesar -0,893 (p-value = 0,186), karena p-value lebih tinggi daripada tingkat signifikansi, maka dapat disimpulkan bahwa tidak terdapat perbedaan abnormal return saham pada hari-hari sesudah dan sebelum pengumuman penawaran saham terbatas. Artinya, penelitian ini menemukan bukti bahwa pengumuman penawaran saham
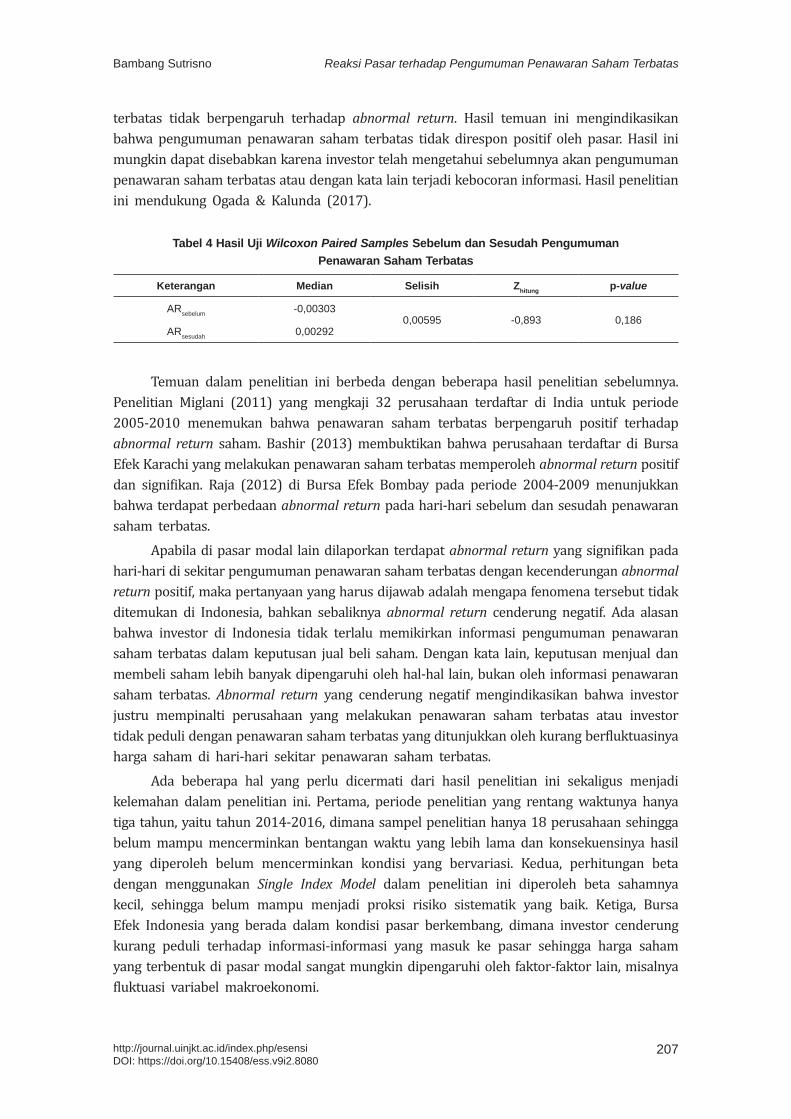
207
Reaksi Pasar terhadap Pengumuman Penawaran Saham TerbatasBambang Sutrisno
http://journal.uinjkt.ac.id/index.php/esensiDOI: https://doi.org/10.15408/ess.v9i2.8080
terbatas tidak berpengaruh terhadap abnormal return. Hasil temuan ini mengindikasikan bahwa pengumuman penawaran saham terbatas tidak direspon positif oleh pasar. Hasil ini mungkin dapat disebabkan karena investor telah mengetahui sebelumnya akan pengumuman penawaran saham terbatas atau dengan kata lain terjadi kebocoran informasi. Hasil penelitian ini mendukung Ogada & Kalunda (2017).
Tabel 4 Hasil Uji Wilcoxon Paired Samples Sebelum dan Sesudah Pengumuman Penawaran Saham Terbatas
Keterangan Median Selisih Zhitung p-value
ARsebelum -0,003030,00595 -0,893 0,186
ARsesudah 0,00292
Temuan dalam penelitian ini berbeda dengan beberapa hasil penelitian sebelumnya.
Penelitian Miglani (2011) yang mengkaji 32 perusahaan terdaftar di India untuk periode 2005-2010 menemukan bahwa penawaran saham terbatas berpengaruh positif terhadap abnormal return saham. Bashir (2013) membuktikan bahwa perusahaan terdaftar di Bursa Efek Karachi yang melakukan penawaran saham terbatas memperoleh abnormal return positif dan signifikan. Raja (2012) di Bursa Efek Bombay pada periode 2004-2009 menunjukkan bahwa terdapat perbedaan abnormal return pada hari-hari sebelum dan sesudah penawaran saham terbatas.
Apabila di pasar modal lain dilaporkan terdapat abnormal return yang signifikan pada hari-hari di sekitar pengumuman penawaran saham terbatas dengan kecenderungan abnormal return positif, maka pertanyaan yang harus dijawab adalah mengapa fenomena tersebut tidak ditemukan di Indonesia, bahkan sebaliknya abnormal return cenderung negatif. Ada alasan bahwa investor di Indonesia tidak terlalu memikirkan informasi pengumuman penawaran saham terbatas dalam keputusan jual beli saham. Dengan kata lain, keputusan menjual dan membeli saham lebih banyak dipengaruhi oleh hal-hal lain, bukan oleh informasi penawaran saham terbatas. Abnormal return yang cenderung negatif mengindikasikan bahwa investor justru mempinalti perusahaan yang melakukan penawaran saham terbatas atau investor tidak peduli dengan penawaran saham terbatas yang ditunjukkan oleh kurang berfluktuasinya harga saham di hari-hari sekitar penawaran saham terbatas.
Ada beberapa hal yang perlu dicermati dari hasil penelitian ini sekaligus menjadi kelemahan dalam penelitian ini. Pertama, periode penelitian yang rentang waktunya hanya tiga tahun, yaitu tahun 2014-2016, dimana sampel penelitian hanya 18 perusahaan sehingga belum mampu mencerminkan bentangan waktu yang lebih lama dan konsekuensinya hasil yang diperoleh belum mencerminkan kondisi yang bervariasi. Kedua, perhitungan beta dengan menggunakan Single Index Model dalam penelitian ini diperoleh beta sahamnya kecil, sehingga belum mampu menjadi proksi risiko sistematik yang baik. Ketiga, Bursa Efek Indonesia yang berada dalam kondisi pasar berkembang, dimana investor cenderung kurang peduli terhadap informasi-informasi yang masuk ke pasar sehingga harga saham yang terbentuk di pasar modal sangat mungkin dipengaruhi oleh faktor-faktor lain, misalnya fluktuasi variabel makroekonomi.
Vol. 9, No. 2, 2019Esensi: Jurnal Bisnis dan Manajemen
208 http://journal.uinjkt.ac.id/index.php/esensiDOI: https://doi.org/10.15408/ess.v9i2.8080
SIMPULANHasil penelitian menunjukkan bahwa terdapat dua hari dimana ditemukan abnormal
return yang signifikan, yaitu hari hari -3 dan +5 walaupun nilai abnormal return-nya adalah negatif. Hasil penelitian juga menemukan bahwa tidak terdapat perbedaan abnormal return saham sesudah dan sebelum pengumuman penawaran saham terbatas. Hasil penelitian ini berimplikasi bagi pemegang saham lama, investor, dan emiten. Pemegang saham lama dan investor perlu melakukan pertimbangan matang sebelum memutuskan berinvestasi pada perusahaan terbuka yang melakukan kebijakan penawaran saham terbatas karena terbukti tidak berpengaruh terhadap abnormal return saham. Sedangkan emiten perlu mempertimbangkan kembali keputusan untuk melakukan penawaran saham terbatas di pasar modal.
Penelitian yang akan datang disarankan untuk melakukan beberapa perbaikan dengan melakukan hal-hal berikut. Pertama, penelitian yang akan datang sebaiknya dilakukan dengan periode pengamatan yang lebih panjang sehingga sampel akan dapat lebih banyak. Kedua, penelitian selanjutnya dapat mencoba menggunakan model estimasi risiko sistematik berbasis beta koreksi atau CAPM dengan periode estimasi yang lebih panjang.
PUSTAKA ACUANBashir, A. (2013). Impact of Right Issues Announcement on Shareholders Wealth: Case
Study of Pakistani Listed Companies. International Journal of Contemporary Business Studies, 4(3), 6–12.
Ghozali, I. (2016). Aplikasi Analisis Multivariate dengan Program IBM SPSS 23. Semarang: Badan Penerbit Universitas Diponegoro.
Kendirli, S., & Elmali, M. E. (2016). The Effect of Right Offering Announcements on Returns of Shares of Deposit Banks Traded in Istanbul Stock Exchange. Journal of Economic Development, Environment and People, 5(1), 1–9.
Kithinji, J. G., Oluoch, W., & Mugo, R. (2014). What Is the Effect of Rights Issue on Firms Share Performance in the Nairobi Securities Exchange? Research Journal of Finance and Accounting, 5(4), 76–84.
Miglani, P. (2011). An Empirical Analysis of Impact of Right Issues on Shareholders Returns of Indian Listed Companies. Journal of Arts, Science & Commerce, 2(4), 169–176.
Ogada, A., & Kalunda, E. (2017). Impact of Rights Issue on Share Returns of Firms Listed on The Nairobi Securities Exchange, Kenya. IOSR Journal of Business and Management, 19(8), 54–62.
Otieno, O. D, & Ochieng, D. E. (2015). The Effect of Rights Issue Announcements on Stock Returns for Firms Listed at the Nairobi Securities Exchange. International Journal of Education and Research, 3(9), 411–426.
Raja, A. (2012). Right Issue and Price Behavior: Indian Evidence. Indian Journal of Research, 1(9), 152–154.
Suresha, B, & Naidu, G. (2012). An Empirical Study on Announcement Effect of Right Issue on Share Price Volatility and Liquidity and Its Impact on Market Wealth Creation of Informed Investors in Bangalore with Special Reference to CNX Nifty Stocks of NSE. International Journal of Multidisciplinary Management Studies, 2(7), 41–58.
Tandelilin, E. (2010). Portofolio dan Investasi: Teori dan Aplikasi. Yogyakarta: Kanisius.
Jiwangga Hadi Nata1, Aries Kurniawan2*
1, 2 Universitas Muhammadiyah [email protected], [email protected] *Penulis korespondensi
AbstractThis study uses the theory of Stimulus-Organism-Response (S-O-R) using a quantitative approach. Sampling using non-probability sampling method, using purposive sampling technique. Respondents in this study were 200 respondents in the purchase intention category in the High Involvement product and also 200 in the Low Involvement product category. The analysis technique used in this study is Partial Least Square (PLS). The results showed that browsing activities on Instagram for both the High and Low Involvement categories of the product had a positive influence on flow conditions, online trust, and purchase intentions. Then online trust in an account on Instagram has a positive influence on flow conditions. Likewise, the flow condition variable and online trust also have an influence on the purchase intention of the latest items on Instagram. There is no difference in consumer behavior towards purchase intentions in the online domain between High and Low Involvement products.Keywords: browsing activity, flow, online trust, purchase intention, Instagram
AbstrakPenelitian ini menggunakan teori Stimulus-Organism-Response (S-O-R) dengan menggunakan pendekatan kuantitatif. Pengambilan sampel dengan menggunakan metode non-probability sampling, menggunakan tehnik purposive sampling. Responden dalam penelitian ini sebanyak 200 responden untuk kategori niat pembelian pada High Involvement produk dan juga 200 orang pada kategori Low Involvement produk. Teknik Analisa yang digunakan dalam penelitian ini adalah Partial Least Square (PLS). Hasil penelitian menunjukkan bahwa aktivitas browsing pada Instagram baik untuk kategori High maupun Low Involvement produk memiliki pengaruh positif terhadap kondisi flow, kepercayaan online, dan niat pembelian. Kemudian kepercayaan online pada akun di Instagram memiliki pengaruh positif terhadap kondisi flow. Demikian juga dengan variabel kondisi flow dan kepercayaan online juga memiliki pengaruh terhadap niat pembelian barang-barang terbaru di Instagram. Tidak ada perbedaan perilaku konsumen terhadap niat pembelian di ranah online antara High maupun Low Involvement produk. Kata kunci: aktivitas browsing, flow, kepercayaan online, niat pembelian, Instagram
Mobile Display Advertising: Perilaku Niat Pembelian Konsumen pada High Involvement vs Low Involvement Product
Draft awal: 10 Mei 2019; Revisi: 05 Juli 2019; Diterima: 15 Agustus 2019http://journal.uinjkt.ac.id/index.php/esensiDOI: https://doi.org/10.15408/ess.v9i2.9942
Esensi: Jurnal Bisnis dan ManajemenVolume 9 (2), 2019
P-ISSN: 2087-2038; E-ISSN:2461-1182Halaman 209 - 224
Vol. 9, No. 2, 2019Esensi: Jurnal Bisnis dan Manajemen
210 http://journal.uinjkt.ac.id/index.php/esensiDOI: https://doi.org/10.15408/ess.v9i2.9942
PENDAHULUANPerkembangan teknologi informasi telah banyak merubah perilaku konsumen, dimana
saat ini konsumen Indonesia banyak menggunakan internet sebagai media berbelanja. Bagi masyarakat Indonesia, berbelanja online merupakan pilihan yang cerdas karena dapat menghemat uang dan waktu, memberikan keleluasaan, serta mendapatkan banyak informasi ketika akan membuat suatu keputusan tanpa merasa ada paksaan untuk melakukan pembelian (Rahayu, 2014). Hasil survei dari Monitor Consumen E-Commerce tahun 2010 menunjukkan bahwa masyarakat Indonesia menghabiskan rata-rata 24% dari penghasilan mereka untuk berbelanja online. Hal ini didukung dengan banyaknya aplikasi mobile commerce dan juga perkembangan platform sosial media sebagai media komunikasi dan promosi untuk menjual barang dan jasa melalui internet dengan memanfaatkan smartphone yang lebih dikenal dengan m-commerce. Masyarakat Indonesia gemar berbelanja melalui mobile-phone dengan presentase 57% untuk berbelanja (Prihatna, 2016). Pasar E-commerce di Indonesia memiliki potensi yang besar, hal ini dilihat dari jumlah pengguna Internet di Indonesia mencapai 82 juta orang atau sekitar 30% dari total penduduk, dengan nilai pasar E-Commerce diperkirakan mencapai Rp. 94,5 Triliun pada tahun 2013 dan diperkirakan meningkat pesat 30% menjadi 295 Triliun pada tahun 2016 (Survey IdEA dan TNS, 2015).
Penjualan dari seluruh ritel e-commerce Indonesia diperkirakan mencapai US$ 8,59 miliar atau sekitar Rp 117,7 triliun pada 2018. Jumlah tersebut, menurut data Statista bakal meningkat menjadi US$ 16,5 miliar pada 2022 atau naik hampir dua kali lipat dari tahun ini. Sementara pembeli digital Indonesia diperkirakan mencapai 31,6 juta pembeli pada 2018, dengan penetrasi sekitar 11,8% dari total populasi. Jumlah tersebut diproyeksikan akan meningkat menjadi 43,9 juta pembeli pada 2022 dengan penetrasi 15,7% dari jumlah penduduk Indonesia.
Penjualan e-commerce Indonesia merupakan yang terbesar di Kawasan Asia Tenggara. Berdasarka proyeksi dari Statista, penjualan ritel perdagangan digital Indonesia mencapa US$ 5,29 miliar. Angka tersebut merupakan yang tertinggi dibandingkan penjualan ritel e-commerce negara Asean lainnya seperti Thailang sebesar US$ 2,89 miliar, Singapura US$ 2,13 miliar, Malaysia US$ 1,97 miliar, dan Vietnam US$ 1,71 miliar. Penjualan total e-commerce Indonesia diperkirakan akan mencapai US$ 46 miliar atau sekitar 8% dari penjualan ritel pada tahun 2025. Pangsa pasar e-commerce domestik tersebut setara dengan 52% dari e-commerce enam negara Asia Tenggara yaitu Singapura, Malaysia, Thailand, Filipina, Vietnam, Laos. (Katadata.co.id:2017).
Selain melalui beberapa situs E-Commerce, Sosial media merupakan suatu media dimana konsumen dapat saling berbagi tulisan, foto, dan video informasi termasuk juga berinteraksi dengan perusahaan.Dengan sosial media, pemasar dapat membangun komunikasi dengan konsumen dan dapat meningkatkan aktivitas komunikasinya (Kotler dan Keller, 2015). Salah satu sosial media yang mempunyai karakteristik unik adalah Instagram. Instagram pada mulanya dikembangkan sebagai wadah untuk berbagi foto dan video kepada sesama penggunanya. Pada perkembangannya, instagram menjadi salah satu sosial media yang potensial untuk aktivitas pemasaran (Nuttamon et al., 2015).
Niat pembelian adalah proses yang ada diantara evaluasi alternatif dan keputusan pembelian dalam model pengambilan keputusan pembelian, yaitu tahap kecenderungan
211
Mobile Display AdvertisingJiwangga Hadi Nata
http://journal.uinjkt.ac.id/index.php/esensiDOI: https://doi.org/10.15408/ess.v9i2.9942
seseorang untuk bertindak sebelum benar-benar memutuskan untuk melakukan pembelian (Harun, 2003). Proses pencarian informasi melalui aktivitas browsing berasosiasi positif terhadap sikap atau perilaku terhadap suatu brand maupun suatu website (Mathwick dan Rigdon, 2004). Di instagram sendiri, pengguna instagram sendiri mencari dan juga terpapar informasi mengenai produk dari akun yang mereka ikuti yang dapat mempengaruhi perilaku pembelian online mereka. Informasi yang mereka dapatkan membuat pelanggan mempunyai image tertentu terhadap suatu produk.
Dalam mencari informasi melalui aktivitas browsing, pelanggan sebagai pengguna instagram kadangkala merasa hanyut dengan perasaan menyenangkan dalam aktivitas tersebut, hingga lupa waktu dan kehilangan konsentrasi pada lingkungan sekitar yang didefinisikan bahwa pelanggan memasuki kondisi flow (Csikszentmihalyi, 1977). Informasi yang didapat kadangkala membuat pelanggan langsung percaya terhadap komunikasi pemasaran yang dilakukan produsen, namun tak jarang juga membuat mereka ragu-ragu sehingga mereka memerlukan banyak pembanding mengenai suatu produk dari beberapa produsen. Trust pada media sosial online dapat disebut online trust, dimana perlu dibangun dengan memanfaatkan media komunikasi yang efektif antara perusahaan atau pemasar dengan pelanggan. Trust bisa dibangun melalui komunikasi pemasaran yang aktif, dimana pelanggan terpapar komunikasi pemasaran melalui media komunikasi yang mereka ikuti yaitu Instagram dengan mendesai suatu komunikasi yang efektif dan membuat terciptanya engagement pelanggan dengan produk sebagai hasil yang didapat dari aktivitas browsing dan informasi yang mereka peroleh. Low involvement product adalah produk yang mempunyai resiko yang rendah bagi konsumen saat membeli produk tersebut. Contoh low involvement product yaitu produk-produk yang dipakai sehari-hari dan konsumen tidak perlu berfikir panjang untuk membeli produk tersebut (John, 1984). Sedangkan high involvement product adalah produk yang memiliki resiko tinggi untuk konsumen dan mereka butuh waktu untuk berpikir panjang sebelum melakukan pembelian (John, 1984). Produk involve adalah bagaimana konsumen terlibat dalam mendapatkan suatu produk. Keterlibatan disini adalah keterlibatan menyangkut bagaimana mereka mencari informasi dan proses pertimbangan yang mereka lakukan sebelum akhirnya mereka mengambil suatu keputusan pembelian. Semakin tinggi tingkat keterlibatan konsumen, maka semakin banyak pertimbangan dan fikiran untuk melakukan suatu keputusan pembelian terhadap suatu barang.
Terdapat lebih dari 22 juta pengguna Instagram Indonesia rata-rata mengakses Instagram 21 menit per harinya. Berdasarkan data internal Instagram pada tahun 2015, hampir setengah dari total pengguna di Instagram mengikuti akun bisnis. Kemudian hampir 60 % nya mengetahui produk tertentu ataupun layanan baru dari Instagram dan 34% telah mengunjungi website untuk informasi lebih lanjut (Fajrina, 2016). Hal ini menegaskan bahwa hampir semua konsumen merasakan suatu pengalaman dalam aktivitas browsing di Instagram dan mereka melakukan aktivitas browsing dengan tujuan yang berbeda namun dapat dikerucutkan bahwa mereka melakukan aktivitas browsing untuk mencari informasi tentang suatu produk.
Proses pencarian informasi berasosiasi positif terhadap sikap atau perilaku terhadap suatu brand maupun suatu website (Mathwick & Rigdon, 2004), hal ini secara tidak langsung
Vol. 9, No. 2, 2019Esensi: Jurnal Bisnis dan Manajemen
212 http://journal.uinjkt.ac.id/index.php/esensiDOI: https://doi.org/10.15408/ess.v9i2.9942
menuntut pemasar agar dapat mendesain website yang atraktif sehingga dapat menarik perhatian pemasar dan dapat menyediakan informasi yang jelas sehingga tujuan pemasaran untuk merubah perilaku yang positif terhadap merek dapat tercapai. Jutaan orang di seluruh dunia menggunakan internet untuk mencari informasi tentang suatu produk, dan kemudian melakukan pembelian online setelahnya (Carboni, 2015).
Jakpat yang merupakan leader dari Research Market di Indonesia melakukan survey pada tahun 2016, memberikan hasil bahwa 49% pengguna melakukan pembelian produk dari merek yang mereka ikuti di akun Instagram mereka, 55% mengetahui brand dan produk terbaru perusahaan dari Instagram, 43% mengunjungi situs sebuah merek setelah melihat aktivitas merek tersebut di Instagram (Rizky, 2016). Hal ini menegaskan bahwa Instagram menjadi revolusi baru menjadi media pemasaran yang efektif dalam 5 tahun terakhir ini. Instagram merilis bahwa ada sebanyak 95 juta dan video yang di publikasikan dengan 4,2 miliar likes per hari, hal ini menjadikan Instagram menjadi salah satu media sosial yang potensial dalam mengiklankan produk.
METODEPendekatan yang digunakan di dalam penelitian ini adalah pendekatan kuantitatif
dan menitikberatkan pada pengujian hipotesis dengan menggunakan data-data primer yang terukur dan menggunakan metode analisis statistik sehingga dapat menghasilkan kesimpulan yang dapat digeneralisasi. Asumsi yang digunakan dalam penelitian ini berupa variabel-variabel yang dapat diukur dan memiliki hubungan kausalitas (Burns dan Bush, 2014).
Metode pengambilan sampel di dalam penelitian ini adalah dengan menggunakan metode non-probability sampling, dan teknik yang digunakan adalah purposive sampling, di dalam teknik ini sampel yang ditarik adalah sampel tertentu yang diambil oleh peneliti dengan tidak secara acak, tapi ditentukan sendiri oleh peneliti dengan penilaian bahwa sampel yang diambil tersebut sesuai dengan tujuan atau masalah penelitian.
Model struktural seringkali membutuhkan jumlah sampel yang relatif besar jika dibandingkan dengan alat analisis multivariat yang lainnya, jumlah sampel yang baik untuk analisis yang menggunakan model struktural adalah pada kisaran 100-400 (Hair et al., 2010). Dalam penelitian ini ditentukan bahwa sampel minimum adalah 200 sampel untuk responden kategodi High Involvement produk dan 200 responden Low Involvement produk.
Alat analisis yang digunakan dalam penelitian ini adalah Varian-Based SEM (VB-SEM) atau yang lebih dikenal sebagai Partial Least Square (PLS). Sebelum melakukan uji hipotesis perlu dilakukan beberapa rangkaian uji, yang pertama adalah uji validitas dan reliabilitas yang digunakan untuk menguji apakah data yang diperoleh sudah valid dan reliabel sehingga dapat diproses lebih lanjut, kemudian yang kedua adalah uji kebaikan model (model fit) yang digunakan untuk menguji ketepatan dari model yang dipakai. Apabila kedua uji tersebut telah terpenuhi maka langkah terakhir adalah melakukan uji hipotesis. Alat analisis ini akan dijalankan dengan bantuan software yakni SmartPLS.
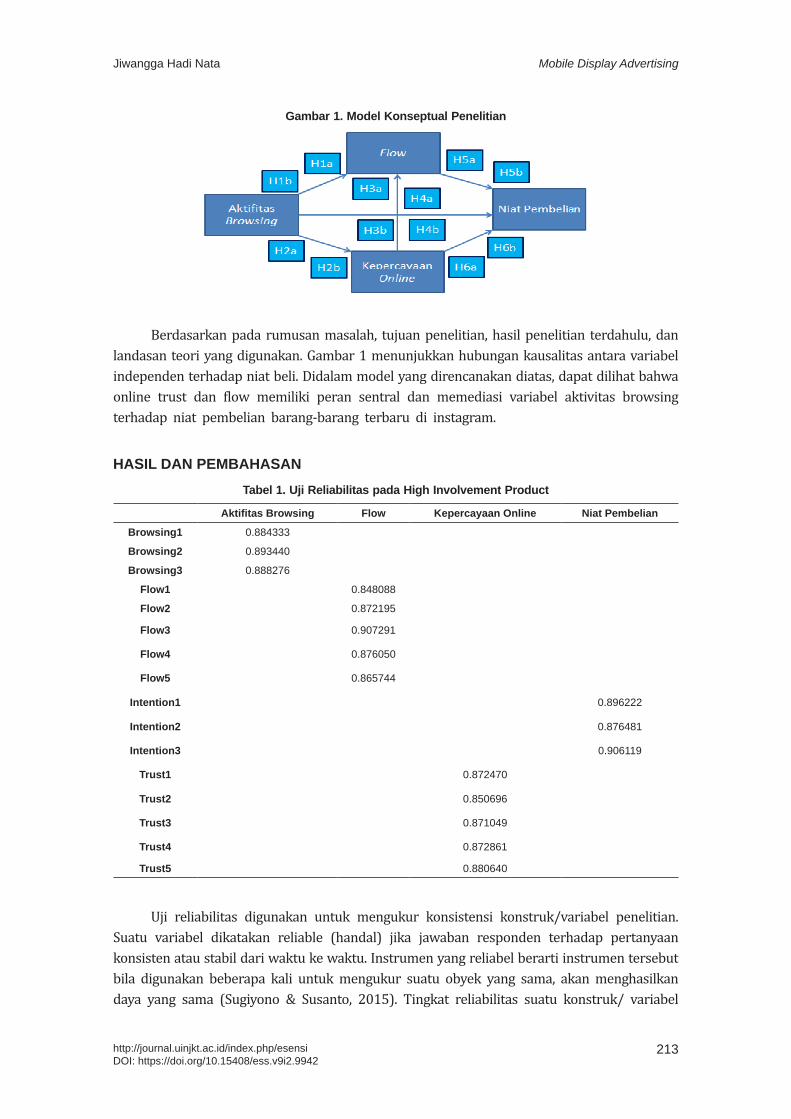
213
Mobile Display AdvertisingJiwangga Hadi Nata
http://journal.uinjkt.ac.id/index.php/esensiDOI: https://doi.org/10.15408/ess.v9i2.9942
Gambar 1. Model Konseptual Penelitian
Berdasarkan pada rumusan masalah, tujuan penelitian, hasil penelitian terdahulu, dan landasan teori yang digunakan. Gambar 1 menunjukkan hubungan kausalitas antara variabel independen terhadap niat beli. Didalam model yang direncanakan diatas, dapat dilihat bahwa online trust dan flow memiliki peran sentral dan memediasi variabel aktivitas browsing terhadap niat pembelian barang-barang terbaru di instagram.
HASIL DAN PEMBAHASANTabel 1. Uji Reliabilitas pada High Involvement Product
Aktifitas Browsing Flow Kepercayaan Online Niat Pembelian
Browsing1 0.884333
Browsing2 0.893440
Browsing3 0.888276
Flow1 0.848088
Flow2 0.872195
Flow3 0.907291
Flow4 0.876050
Flow5 0.865744
Intention1 0.896222
Intention2 0.876481
Intention3 0.906119
Trust1 0.872470
Trust2 0.850696
Trust3 0.871049
Trust4 0.872861
Trust5 0.880640
Uji reliabilitas digunakan untuk mengukur konsistensi konstruk/variabel penelitian. Suatu variabel dikatakan reliable (handal) jika jawaban responden terhadap pertanyaan konsisten atau stabil dari waktu ke waktu. Instrumen yang reliabel berarti instrumen tersebut bila digunakan beberapa kali untuk mengukur suatu obyek yang sama, akan menghasilkan daya yang sama (Sugiyono & Susanto, 2015). Tingkat reliabilitas suatu konstruk/ variabel
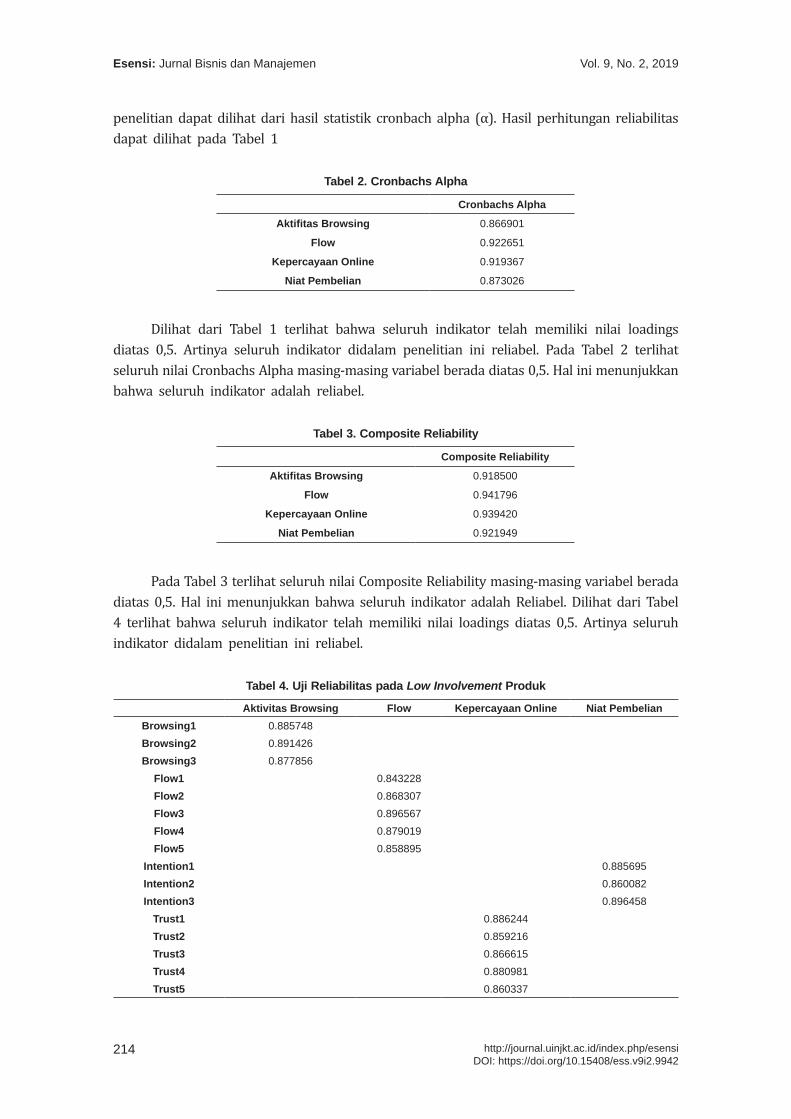
Vol. 9, No. 2, 2019Esensi: Jurnal Bisnis dan Manajemen
214 http://journal.uinjkt.ac.id/index.php/esensiDOI: https://doi.org/10.15408/ess.v9i2.9942
penelitian dapat dilihat dari hasil statistik cronbach alpha (α). Hasil perhitungan reliabilitas dapat dilihat pada Tabel 1
Tabel 2. Cronbachs Alpha
Cronbachs Alpha
Aktifitas Browsing 0.866901
Flow 0.922651
Kepercayaan Online 0.919367
Niat Pembelian 0.873026
Dilihat dari Tabel 1 terlihat bahwa seluruh indikator telah memiliki nilai loadings diatas 0,5. Artinya seluruh indikator didalam penelitian ini reliabel. Pada Tabel 2 terlihat seluruh nilai Cronbachs Alpha masing-masing variabel berada diatas 0,5. Hal ini menunjukkan bahwa seluruh indikator adalah reliabel.
Tabel 3. Composite Reliability
Composite Reliability
Aktifitas Browsing 0.918500
Flow 0.941796
Kepercayaan Online 0.939420
Niat Pembelian 0.921949
Pada Tabel 3 terlihat seluruh nilai Composite Reliability masing-masing variabel berada diatas 0,5. Hal ini menunjukkan bahwa seluruh indikator adalah Reliabel. Dilihat dari Tabel 4 terlihat bahwa seluruh indikator telah memiliki nilai loadings diatas 0,5. Artinya seluruh indikator didalam penelitian ini reliabel.
Tabel 4. Uji Reliabilitas pada Low Involvement Produk
Aktivitas Browsing Flow Kepercayaan Online Niat PembelianBrowsing1 0.885748
Browsing2 0.891426
Browsing3 0.877856
Flow1 0.843228
Flow2 0.868307
Flow3 0.896567
Flow4 0.879019
Flow5 0.858895
Intention1 0.885695
Intention2 0.860082
Intention3 0.896458
Trust1 0.886244
Trust2 0.859216
Trust3 0.866615
Trust4 0.880981
Trust5 0.860337
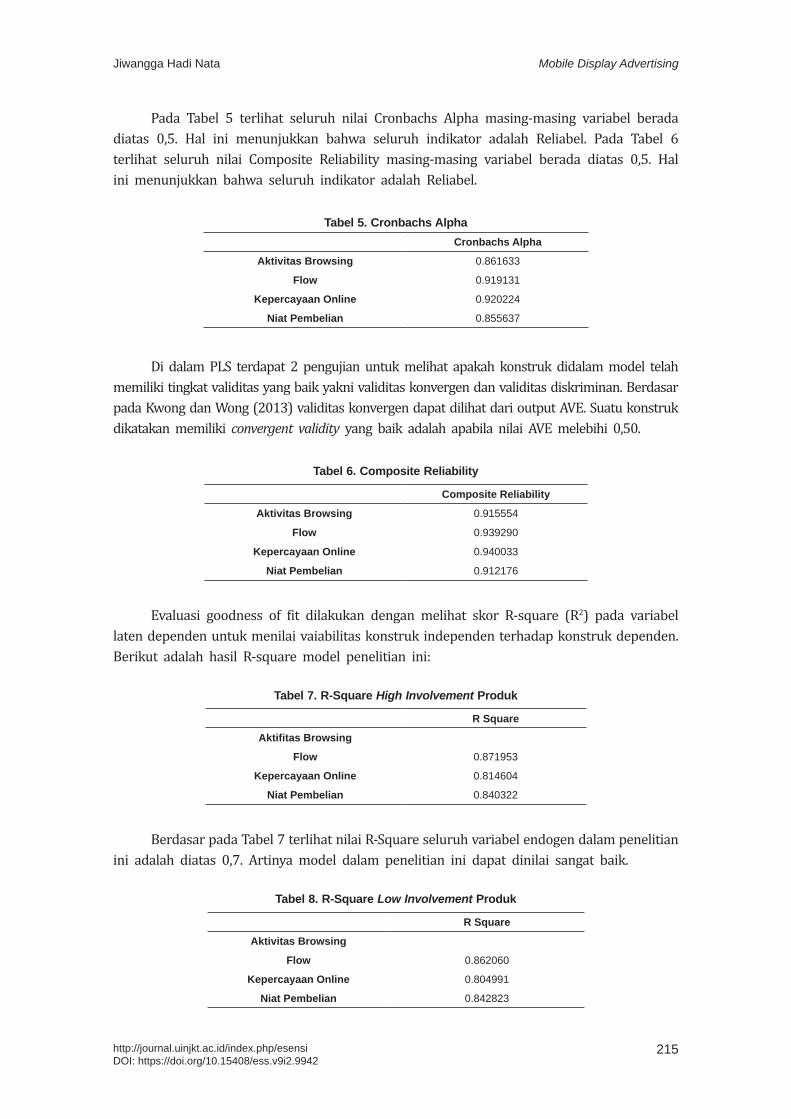
215
Mobile Display AdvertisingJiwangga Hadi Nata
http://journal.uinjkt.ac.id/index.php/esensiDOI: https://doi.org/10.15408/ess.v9i2.9942
Pada Tabel 5 terlihat seluruh nilai Cronbachs Alpha masing-masing variabel berada diatas 0,5. Hal ini menunjukkan bahwa seluruh indikator adalah Reliabel. Pada Tabel 6 terlihat seluruh nilai Composite Reliability masing-masing variabel berada diatas 0,5. Hal ini menunjukkan bahwa seluruh indikator adalah Reliabel.
Tabel 5. Cronbachs Alpha Cronbachs Alpha
Aktivitas Browsing 0.861633
Flow 0.919131
Kepercayaan Online 0.920224
Niat Pembelian 0.855637
Di dalam PLS terdapat 2 pengujian untuk melihat apakah konstruk didalam model telah memiliki tingkat validitas yang baik yakni validitas konvergen dan validitas diskriminan. Berdasar pada Kwong dan Wong (2013) validitas konvergen dapat dilihat dari output AVE. Suatu konstruk dikatakan memiliki convergent validity yang baik adalah apabila nilai AVE melebihi 0,50.
Tabel 6. Composite Reliability
Composite Reliability
Aktivitas Browsing 0.915554
Flow 0.939290
Kepercayaan Online 0.940033
Niat Pembelian 0.912176
Evaluasi goodness of fit dilakukan dengan melihat skor R-square (R2) pada variabel laten dependen untuk menilai vaiabilitas konstruk independen terhadap konstruk dependen. Berikut adalah hasil R-square model penelitian ini:
Tabel 7. R-Square High Involvement Produk
R Square
Aktifitas Browsing
Flow 0.871953
Kepercayaan Online 0.814604
Niat Pembelian 0.840322
Berdasar pada Tabel 7 terlihat nilai R-Square seluruh variabel endogen dalam penelitian ini adalah diatas 0,7. Artinya model dalam penelitian ini dapat dinilai sangat baik.
Tabel 8. R-Square Low Involvement Produk
R Square
Aktivitas Browsing
Flow 0.862060
Kepercayaan Online 0.804991
Niat Pembelian 0.842823
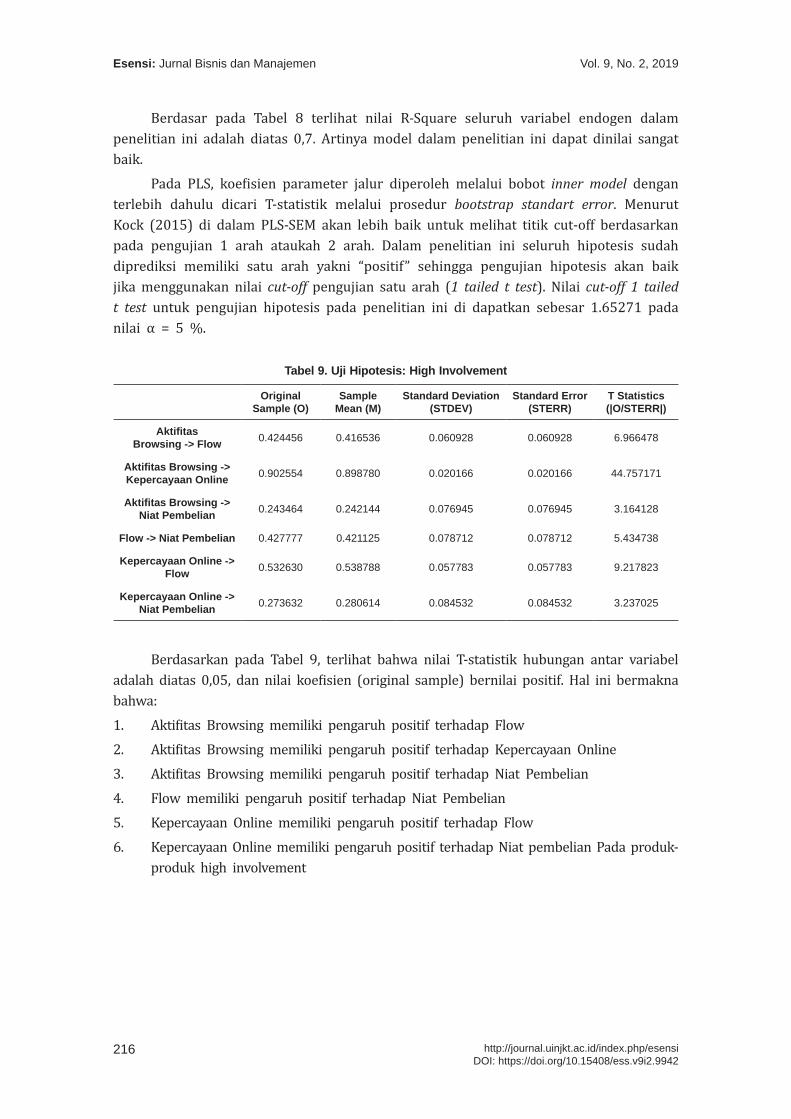
Vol. 9, No. 2, 2019Esensi: Jurnal Bisnis dan Manajemen
216 http://journal.uinjkt.ac.id/index.php/esensiDOI: https://doi.org/10.15408/ess.v9i2.9942
Berdasar pada Tabel 8 terlihat nilai R-Square seluruh variabel endogen dalam penelitian ini adalah diatas 0,7. Artinya model dalam penelitian ini dapat dinilai sangat baik.
Pada PLS, koefisien parameter jalur diperoleh melalui bobot inner model dengan terlebih dahulu dicari T-statistik melalui prosedur bootstrap standart error. Menurut Kock (2015) di dalam PLS-SEM akan lebih baik untuk melihat titik cut-off berdasarkan pada pengujian 1 arah ataukah 2 arah. Dalam penelitian ini seluruh hipotesis sudah diprediksi memiliki satu arah yakni “positif” sehingga pengujian hipotesis akan baik jika menggunakan nilai cut-off pengujian satu arah (1 tailed t test). Nilai cut-off 1 tailed t test untuk pengujian hipotesis pada penelitian ini di dapatkan sebesar 1.65271 pada nilai α = 5 %.
Tabel 9. Uji Hipotesis: High Involvement
Original Sample (O)
Sample Mean (M)
Standard Deviation (STDEV)
Standard Error (STERR)
T Statistics (|O/STERR|)
Aktifitas Browsing -> Flow 0.424456 0.416536 0.060928 0.060928 6.966478
Aktifitas Browsing -> Kepercayaan Online 0.902554 0.898780 0.020166 0.020166 44.757171
Aktifitas Browsing -> Niat Pembelian 0.243464 0.242144 0.076945 0.076945 3.164128
Flow -> Niat Pembelian 0.427777 0.421125 0.078712 0.078712 5.434738
Kepercayaan Online -> Flow 0.532630 0.538788 0.057783 0.057783 9.217823
Kepercayaan Online -> Niat Pembelian 0.273632 0.280614 0.084532 0.084532 3.237025
Berdasarkan pada Tabel 9, terlihat bahwa nilai T-statistik hubungan antar variabel adalah diatas 0,05, dan nilai koefisien (original sample) bernilai positif. Hal ini bermakna bahwa:1. Aktifitas Browsing memiliki pengaruh positif terhadap Flow2. Aktifitas Browsing memiliki pengaruh positif terhadap Kepercayaan Online3. Aktifitas Browsing memiliki pengaruh positif terhadap Niat Pembelian4. Flow memiliki pengaruh positif terhadap Niat Pembelian5. Kepercayaan Online memiliki pengaruh positif terhadap Flow6. Kepercayaan Online memiliki pengaruh positif terhadap Niat pembelian Pada produk-
produk high involvement
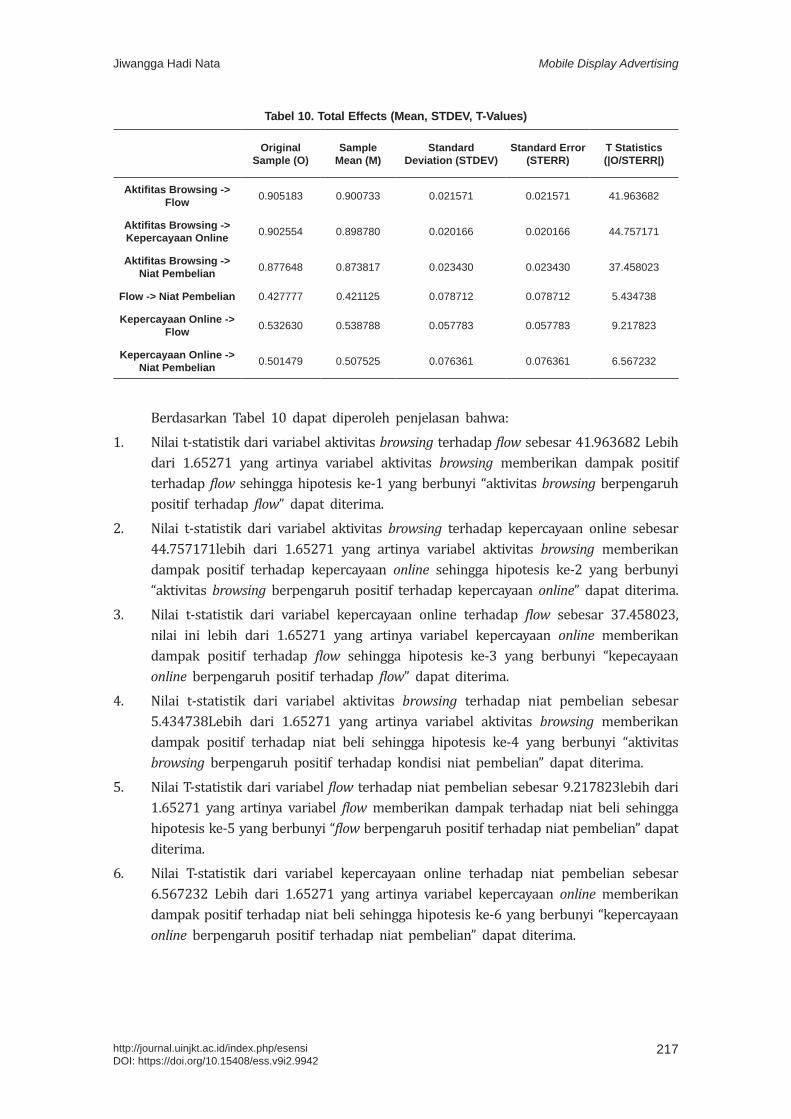
217
Mobile Display AdvertisingJiwangga Hadi Nata
http://journal.uinjkt.ac.id/index.php/esensiDOI: https://doi.org/10.15408/ess.v9i2.9942
Tabel 10. Total Effects (Mean, STDEV, T-Values)
Original Sample (O)
Sample Mean (M)
Standard Deviation (STDEV)
Standard Error (STERR)
T Statistics (|O/STERR|)
Aktifitas Browsing -> Flow 0.905183 0.900733 0.021571 0.021571 41.963682
Aktifitas Browsing -> Kepercayaan Online 0.902554 0.898780 0.020166 0.020166 44.757171
Aktifitas Browsing -> Niat Pembelian 0.877648 0.873817 0.023430 0.023430 37.458023
Flow -> Niat Pembelian 0.427777 0.421125 0.078712 0.078712 5.434738
Kepercayaan Online -> Flow 0.532630 0.538788 0.057783 0.057783 9.217823
Kepercayaan Online -> Niat Pembelian 0.501479 0.507525 0.076361 0.076361 6.567232
Berdasarkan Tabel 10 dapat diperoleh penjelasan bahwa:1. Nilai t-statistik dari variabel aktivitas browsing terhadap flow sebesar 41.963682 Lebih
dari 1.65271 yang artinya variabel aktivitas browsing memberikan dampak positif terhadap flow sehingga hipotesis ke-1 yang berbunyi “aktivitas browsing berpengaruh positif terhadap flow” dapat diterima.
2. Nilai t-statistik dari variabel aktivitas browsing terhadap kepercayaan online sebesar 44.757171lebih dari 1.65271 yang artinya variabel aktivitas browsing memberikan dampak positif terhadap kepercayaan online sehingga hipotesis ke-2 yang berbunyi “aktivitas browsing berpengaruh positif terhadap kepercayaan online” dapat diterima.
3. Nilai t-statistik dari variabel kepercayaan online terhadap flow sebesar 37.458023, nilai ini lebih dari 1.65271 yang artinya variabel kepercayaan online memberikan dampak positif terhadap flow sehingga hipotesis ke-3 yang berbunyi “kepecayaan online berpengaruh positif terhadap flow” dapat diterima.
4. Nilai t-statistik dari variabel aktivitas browsing terhadap niat pembelian sebesar 5.434738Lebih dari 1.65271 yang artinya variabel aktivitas browsing memberikan dampak positif terhadap niat beli sehingga hipotesis ke-4 yang berbunyi “aktivitas browsing berpengaruh positif terhadap kondisi niat pembelian” dapat diterima.
5. Nilai T-statistik dari variabel flow terhadap niat pembelian sebesar 9.217823lebih dari 1.65271 yang artinya variabel flow memberikan dampak terhadap niat beli sehingga hipotesis ke-5 yang berbunyi “flow berpengaruh positif terhadap niat pembelian” dapat diterima.
6. Nilai T-statistik dari variabel kepercayaan online terhadap niat pembelian sebesar 6.567232 Lebih dari 1.65271 yang artinya variabel kepercayaan online memberikan dampak positif terhadap niat beli sehingga hipotesis ke-6 yang berbunyi “kepercayaan online berpengaruh positif terhadap niat pembelian” dapat diterima.

Vol. 9, No. 2, 2019Esensi: Jurnal Bisnis dan Manajemen
218 http://journal.uinjkt.ac.id/index.php/esensiDOI: https://doi.org/10.15408/ess.v9i2.9942
Tabel 11. Uji Hipotesis: Low Involvement
Original Sample (O)
Sample Mean (M)
Standard Deviation (STDEV)
Standard Error (STERR)
T Statistics (|O/STERR|)
Aktivitas Browsing -> Flow 0.412371 0.406705 0.062508 0.062508 6.597039
Aktivitas Browsing -> Kepercayaan Online 0.897213 0.893783 0.023473 0.023473 38.223738
Aktivitas Browsing -> Niat Pembelian 0.263166 0.268029 0.071964 0.071964 3.656890
Flow -> Niat Pembelian 0.392479 0.382158 0.076154 0.076154 5.153756
Kepercayaan Online -> Flow 0.540454 0.544196 0.059573 0.059573 9.072122
Kepercayaan Online -> Niat Pembelian 0.293319 0.298287 0.075683 0.075683 3.875614
Berdasar pada Tabel 11, terlihat bahwa nilai T-statistik hubungan antar variabel adalah diatas 0,05, dan nilai koefisien (original sample) bernilai positif. Hal ini bermakna bahwa:1. Aktifitas Browsing memiliki pengaruh positif terhadap Flow2. Aktifitas Browsing memiliki pengaruh positif terhadap Kepercayaan Online3. Aktifitas Browsing memiliki pengaruh positif terhadap Niat Pembelian4. Flow memiliki pengaruh positif terhadap Niat Pembelian5. Kepercayaan Online memiliki pengaruh positif terhadap Flow6. Kepercayaan Online memiliki pengaruh positif terhadap Niat pembelian pada produk-
produk low involvement
Berdasarkan Tabel 12 diperoleh penjelasan bahwa:1) Nilai T-statistik dari variabel aktivitas browsing terhadap flow sebesar 35.193116 Lebih
dari 1.65271 (1-tailed t test) yang artinya variabel aktivitas browsing memberikan dampak positif terhadap flow sehingga hipotesis ke-1 yang berbunyi “aktivitas browsing berpengaruh positif terhadap flow” dapat diterima.
2) Nilai T-statistik dari variabel aktivitas browsing terhadap kepercayaan online sebesar 38.223738 lebih dari 1.65271 (1-tailed t test) yang artinya variabel aktivitas browsing memberikan dampak positif terhadap kepercayaan online sehingga hipotesis ke-2 yang berbunyi “aktivitas browsing berpengaruh positif terhadap kepercayaan online” dapat diterima.
3) Nilai T-statistik dari variabel kepercayaan online terhadap flow sebesar 34.610899 Lebih dari 1.65271 (1-tailed t test) yang artinya variabel kepercayaan online memberikan dampak positif terhadap flow sehingga hipotesis ke-3 yang berbunyi “kepecayaan online berpengaruh positif terhadap flow” dapat diterima.
4) Nilai T-statistik dari variabel aktivitas browsing terhadap niat pembelian sebesar 5.153756 Lebih dari 1.65271 (1-tailed t test) yang artinya variabel aktivitas browsing memberikan dampak positif terhadap niat beli sehingga hipotesis ke-4 yang berbunyi “aktivitas browsing berpengaruh positif terhadap kondisi niat pembelian” dapat diterima.
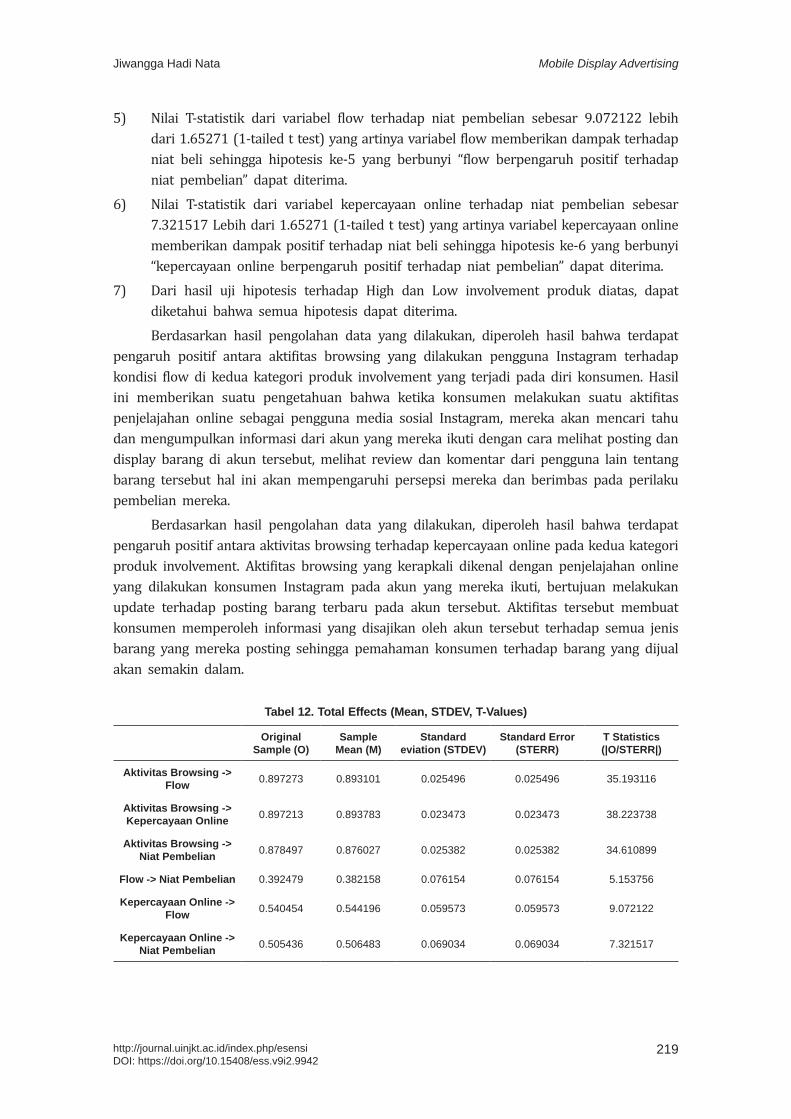
219
Mobile Display AdvertisingJiwangga Hadi Nata
http://journal.uinjkt.ac.id/index.php/esensiDOI: https://doi.org/10.15408/ess.v9i2.9942
5) Nilai T-statistik dari variabel flow terhadap niat pembelian sebesar 9.072122 lebih dari 1.65271 (1-tailed t test) yang artinya variabel flow memberikan dampak terhadap niat beli sehingga hipotesis ke-5 yang berbunyi “flow berpengaruh positif terhadap niat pembelian” dapat diterima.
6) Nilai T-statistik dari variabel kepercayaan online terhadap niat pembelian sebesar 7.321517 Lebih dari 1.65271 (1-tailed t test) yang artinya variabel kepercayaan online memberikan dampak positif terhadap niat beli sehingga hipotesis ke-6 yang berbunyi “kepercayaan online berpengaruh positif terhadap niat pembelian” dapat diterima.
7) Dari hasil uji hipotesis terhadap High dan Low involvement produk diatas, dapat diketahui bahwa semua hipotesis dapat diterima.Berdasarkan hasil pengolahan data yang dilakukan, diperoleh hasil bahwa terdapat
pengaruh positif antara aktifitas browsing yang dilakukan pengguna Instagram terhadap kondisi flow di kedua kategori produk involvement yang terjadi pada diri konsumen. Hasil ini memberikan suatu pengetahuan bahwa ketika konsumen melakukan suatu aktifitas penjelajahan online sebagai pengguna media sosial Instagram, mereka akan mencari tahu dan mengumpulkan informasi dari akun yang mereka ikuti dengan cara melihat posting dan display barang di akun tersebut, melihat review dan komentar dari pengguna lain tentang barang tersebut hal ini akan mempengaruhi persepsi mereka dan berimbas pada perilaku pembelian mereka.
Berdasarkan hasil pengolahan data yang dilakukan, diperoleh hasil bahwa terdapat pengaruh positif antara aktivitas browsing terhadap kepercayaan online pada kedua kategori produk involvement. Aktifitas browsing yang kerapkali dikenal dengan penjelajahan online yang dilakukan konsumen Instagram pada akun yang mereka ikuti, bertujuan melakukan update terhadap posting barang terbaru pada akun tersebut. Aktifitas tersebut membuat konsumen memperoleh informasi yang disajikan oleh akun tersebut terhadap semua jenis barang yang mereka posting sehingga pemahaman konsumen terhadap barang yang dijual akan semakin dalam.
Tabel 12. Total Effects (Mean, STDEV, T-Values)
Original Sample (O)
Sample Mean (M)
Standard eviation (STDEV)
Standard Error (STERR)
T Statistics (|O/STERR|)
Aktivitas Browsing -> Flow 0.897273 0.893101 0.025496 0.025496 35.193116
Aktivitas Browsing -> Kepercayaan Online 0.897213 0.893783 0.023473 0.023473 38.223738
Aktivitas Browsing -> Niat Pembelian 0.878497 0.876027 0.025382 0.025382 34.610899
Flow -> Niat Pembelian 0.392479 0.382158 0.076154 0.076154 5.153756
Kepercayaan Online -> Flow 0.540454 0.544196 0.059573 0.059573 9.072122
Kepercayaan Online -> Niat Pembelian 0.505436 0.506483 0.069034 0.069034 7.321517
Vol. 9, No. 2, 2019Esensi: Jurnal Bisnis dan Manajemen
220 http://journal.uinjkt.ac.id/index.php/esensiDOI: https://doi.org/10.15408/ess.v9i2.9942
Berdasarkan hasil pengolahan data yang dilakukan, diperoleh hasil bahwa terdapat pengaruh positif kepecayaan online terhadap kondisi flow pada kedua kategori produk involvement. Dalam hal perilaku konsumen di ranah online, faktor kepercayaan terhadap virtual store yang dalam hal ini adalah akun Instagram merupakan hal utama karena konsumen lebih dominan dihadapkan pada aktivitas yang berhubungan dengan stimuli visual yang berhubungan dengan display berupa posting barang-barang terbaru di akun Instagram, pemilihan kata-kata dalam komunikasi pemasaran dan juga komitmen untuk memenuhi semua kampanye pemasaran mereka. Ketika suatu akun Instagram dengan segala strategi komunikasi pemasarannya dapat membuat konsumen memiliki kepercayaan pada akun tersebut, maka konsumen tidak segan memberikan perhatian dan fokus pada saat menjelajahi akun tersebut dan kerapkali karena mereka menemukakn perasaan menyenangkan membuat mereka tanpa sadar telah menghabiskan banyak waktu pada aktifitasnya tersebut.
Berdasarkan hasil pengolahan data yang dilakukan, diperoleh hasil bahwa terdapat pengaruh yang signifikan antara aktifitas bowsing terhadap niat pembelian produk terbaru di Instagram pada kedua kategori produk involvement, Analogi yang dapat dijelaskan disini adalah tujuan konsumen melakukan penjelajahan online meliputi beberpa motif, diantaranya ada yang melakukannya untuk motif rekreasional dan eksploratori untuk killing time, ada juga yang memang sengaja melakukan aktifitas tersebut untuk mencari informasi dan update barang terbaru di Insagram.
Berdasarkan hasil pengolahan data yang dilakukan, diperoleh hasil bahwa terdapat pengaruh positif antara kondisi flow terhadap niat pembelian pada kedua kategori produk involvement. Kondisi flow membuat perhatian konsumen terfokus saat melakukan aktifitas menjelajahi akun Instagram yang mereka ikuti. Dari aktifitas tersebut, mereka akan merasakan perasaan yang menyenangkan akibat terpapar komunikasi pemasaran melalui pengalaman audio-visual yang disajikan oleh pemasar. Excellence experience yang dirasakan konsumen hingga konsumen kadangkala lupa waktu membuat konsumen dengan senang hati revisit akun tersebut. imbas dari akttifitas ini akan memunculkan suatu dorongan niat pembelian dari dalam diri konsumen.
Berdasarkan hasil pengolahan data yang dilakukan, diperoleh hasil bahwa terdapat pengaruh positif antara kepercayaan online pada produk terbaru di Instagram pada kedua kategori produk involvement yang pengguna ikuti terhadap niat pembelian. Semakin konsumen percaya dengan suatu akun di Instagram, maka tidak ada denial atau penolakan tentang informasi di akun tersebut. Informasi, promosi, dan spesifikasi yang dipaparkan mendapatkan perhatian konsumen, karena apabila konsumen telah percaya pada suatu akun, maka mereka akan engaged dengan akun tersebut dan dimasa depan mereka tidak aka nada perasaan ragu untuk melakukan transaksi dengan akun tersebut. Apabila mereka membutuhkan suatu produk, dan akun tersebut menawarkan produk sesuai dengan ekpektasi mereka, akan muncul niat dari dalam diri mereka untuk melakukan pembelian barang di akun tersebut.
SIMPULANBerdasarkan hasil yang didapat menunjukkan bahwa aktivitas browsing pada Instagram
baik untuk kategori High maupun Low Involvement produk memiliki pengaruh positif terhadap kondisi flow, kepercayaan online, dan niat pembelian. Kemudian kepercayaan

221
Mobile Display AdvertisingJiwangga Hadi Nata
http://journal.uinjkt.ac.id/index.php/esensiDOI: https://doi.org/10.15408/ess.v9i2.9942
online pada akun di Instagram memiliki pengaruh positif terhadap kondisi flow. Demikian juga dengan variabel kondisi flow dan kepercayaan online juga memiliki pengaruh terhadap niat pembelian barang-barang terbaru di Instagram. Tidak ada perbedaan perilaku konsumen terhadap niat pembelian di ranah online antara High maupun Low Involvement produk.
Secara ilmu pengetahuan, penelitian ini dapat memberikan tambahan referensi bagi akademisi mengenai aktifitas browsing pada ranah online melalui media sosial Instagram dapat memberikan pengaruh terhadap kondisi flow dan kepercayaan online, dan kemudian ketiga variabel tersebut memberikan dampak terhadap munculnya niat pembelian pada barang-barang terbaru yang di posting Instagram. Hasil tersebut tidak hanya diperlihatkan pada penelitian-penelitian terdahulu yang biasanya dilakukan pada personal computer dan laptop , pada saat sekarang ini dimana semuanya serba dapat dilakukan dengan mobile karena adanya peningkatan kualitas koneksi internet dan semakin populernya belanja menggunakan gadget. Maka niat pembelian juga dapat muncul pada saat konsumen melakukan penjelajahan online memakai perangkat smartphone dengan berbagai macam alasan praktis dan benefitnya.
Penelitian ini memberikan kontribusi yang baik bagi para internet marketer dan pemilik akun di Instagram bagaimana dia mendesain strategi kampanya pemasaran mereka sehingga mereka dapat mengintegrasikan segala resource yang mereka miliki untuk memaksimalkan potensi Instagram sebagai salah satu tools pemasaran mereka.
Pada hasil penelitian ini menguraikan bagaimana aktifitas browsing yang dilakukan konsumen pada suatu akun di Instagram untuk mencari informasi dan melihat spesifikasi tentang barang-barang baru yang di posting oleh suatu akun d Instagram dimediasi oleh variabel yakni kondisi flow dan kepercayaan online dapat mempengaruhi munculnya niat pembelian barang-barang tersebut dari dalam diri konsumen. Hal ini memberikan petunjuk kepada para pemasar dalam ranah online yang memanfaatkan media sosial Instagram dalam kampanye pemasaran mereka untuk lebih jeli bagaimana merangsang munculnya niat pembelian dari dalam diri konsumen.
Instagram sebagai media sosial yang popular dan potensial dalam aktifitas pemasaran menawarkan tools untuk memanjakan audio-visual bagi pengguna Instagram yang mengaksesnya. Pemilihan caption tiap posting foto, video dan pemilihan kata-kata untuk memberikan informasi harus diperhatikan dengan baik sehingga dapat mempersuasi pengguna Instagram agar mempunyai persepsi positif terhadap barang atau brand yang mereka miliki.
Dalam dunia yang semakin mobile , dimana segalanya bisa diakses dalam satu genggaman, menumbuhkan kepercayaan online dengan menjaga komitmen baik ketepatan informasi yang diberikan dan juga bagaimana memenuhi semua yang dijanjikan merupakan syarat mutlak. Karena apabila konsumen sudah memiliki kepercayaan terhadap suatu perusahaan yang di wakili oleh akun di Instagram, maka akan semakin mudah pula menstimuli munculnya niat pembelian mereka.
Pada penelitian ini, barang yang di uji dikelompokkan berdasarkan tingkat involvement nya, dengan hasil pengumpulan datanya di analisis secara general dengan cakupan hanya di 3 kota yaitu Surabaya, Gresik, dan Sidoarjo. Di penelitian selanjutnya mungkin bisa juga menguji kategori barang yang lain dengan meneliti perbedaan preferensi gender pada perilaku konsumen mereka dengan cakupan wilayah yang lebih luas.
Vol. 9, No. 2, 2019Esensi: Jurnal Bisnis dan Manajemen
222 http://journal.uinjkt.ac.id/index.php/esensiDOI: https://doi.org/10.15408/ess.v9i2.9942
Pada penelitian ini, pengumpulan data dilakukan secara offline dengan membagikan kuesioner secara langsung kepada para responden, mungkin di penelitian selanjutnya pengumpulan data bisa dilakukan secara online sehingga cakupan wilayah lebih luas dengan jumlah responden yang lebih besar.
REFERENCES Adam Rapp, Lauren Skinner Bietel Spacher, Dhruv Grewal, Douglas E Hughes. (2013).
Understanding Social Media Effect Across Seller, Retailer, and Consumer Interactions. Journal of the Academic Marketing Science. No 41:576-566
Arnold Kamis, Tziporah Stern, Daniel M.Ladik. (2010). A Flow-based Model of Websites Intentions when Users Customize Products in Business-to-Cunsomer Electronic Commerce. Journal of Inf Syst Front. DOI 10.1007
Burns, A. C., & Bush, R. (2014). Marketing Research: Seventh Edition. Harlow, Edinburg Gate: Pearson Education Limited.
Chang, M. K., Cheung, W., & Lai, V. S. (2005). Literature derived reference models for the adoption of online shoping. Information and Management, 42, 543-559.
Chang, M. K., Cheung, W., & Tang, M. (2013). Building trust online: Interactions among trust building mechanisms. Information & Management, 50, 439-445.
Charlas Mathwick and Edward Rigdon. (2004). Play, Flow, and the Online Search Experience. Journal of Consumer Research. Vol 31.
Chia-Lin Hsu, Kuo-Chieng Chang, Mu-Chen Chen. (2012). The Impact of Website Quality on Customer Satisfaction and Purchase Intention : Perceived Playfulness and Perceived Flow as Mediators. Journal of Information System E-Business Managerial. No.10:549-570
Chia-Lin Hsu, Kuo-Chieng Chang, Mu-Chen Chen. (2012). Flow Experience and Internet Shopping Behaviour: Investigating the Moderating Effect of Customer Characteristic. Journal of System Research and Behavioral Science.No.317-332
Chia-Lin Hsu, Kuo-Chien Chang, Nien-Te Kuo, Yi-Sung Cheng. (2016). ResearchThe Mediating Affect of Flow Experience on Social Shopping Behaviour. DOI:10.1177
Ghozali, I. (2014). Structural Equation Modeling: Metode Alternatif Dengan Partial Least Squares (PLS). Semarang: Badan Penerbit Universitas Diponegoro Semarang.
Hair, J. F., Black, W. C., Babin, B. J., & Anderson, R. E. (2010). Multivariate Data Analysis: A Global Perspective, Seventh Edition. New Jersey: Pearson Education, Inc.
Hawkins, D. I., & Mothersbaugh, D. L. (2013). Consumer Behavior: Building Marketing Strategy. New York: McGraw-Hill.
Huang, Ming-Hui (2006), “Flow, Enduring, and Situational Involvement in the Web Environment:ATripartite Second-order Examination,” Psychology and Marketing, 23 (5), 383–411.
Huang, E. (2012). Online experience and virtual goods purchase intention. Internet Research, 22(3), 252-274.
Huang, L. T. (2015) . Flow and social capital theory in online impulse buying. Journal of Business Research, 69(6), 2277-2283.
223
Mobile Display AdvertisingJiwangga Hadi Nata
http://journal.uinjkt.ac.id/index.php/esensiDOI: https://doi.org/10.15408/ess.v9i2.9942
Hsu, C. L., Chang, K. C., & Chen, M. C. (2012). Flow Experience and Internet Shopping Behavior: Investigating the Moderating Effect of Consumer Characteristics. System Research and Behavioral Science, 29, 317-332.
Ibnu Subiyanto. (2000). Metodologi Penelitian. Yogyakarta: UPP AMP YKPN.Jacoby, J. (2002). Stimulus-Organism-Response Reconsidered: An Evolutionary Step in Modeling
(Consumer) Behavior. Journal of Consumer Psychology, 12(1), 51-57.Jas Raj Bohra and Mallika Bishnoi. (2016). Instagram : The New Edge of Online Retailing.
World Journal of Research and Review. Vol 3. Pages 43-46.Jessica Wongso Putri. (2015). Factors Affecting Customers Online Search Intention and Online
Purchase Intention using Social Networks: Case Study of Online Shop on Instagram , iBuss Management Vol. 3, No. 2, 232-240
John L.Sherry. Flow and Media Enjoyment. (2004). Communication Theory. Pages 328-347Koufaris, M. (2002). Applying the Technology Acceptance Model and Flow Theory to Online
Consumer Behavior. Information System research, 13(2), 205-223.Koufaris, M., & Sosa, W. H. (2004). The development of initial trust in an online company
by new customers. Informtion & Management, 41, 377-397.Koufaris, M., Kambil, A., & Labarbera, P. A. (2001). Consumer Behavior in Web-Based
Commerce: An Empirical Study. International Journal of Electronic Commerce, 6(2), 115-138.
Kun Song and Ann Marie Fiore. (2007). Telepresence and Fantasy in Online Appareal Shopping Experience.Journal of Fashion Marketing and Management. Vol.11 No.4 2007
Lin, J., & Chuan, C. H. (2014). A Study on Youth Online Impulse Purchase: The Relationship between Individual Difference, Shopping Enjoyment, Emotion Response and Purchase. Journal of Creative Communication, 8(2&3), 209-229.
Novak, Thomas P., Donna L. Hoffman and Yiu-Fai Yung. (2000). Measuring the Customer Experience in Online Environments: A Structural Modeling Approach. Marketing Science, 19 (1), 22–42.
Nuttamon Amornpashara. (2013). A study of the relationship between using Instagram and purchase intention.. J. Global Business Advancement, Vol. 8, No.3
Ono, A., Nakamura, A., Okuno, A., & Sumikawa, M. (2012). Consumer Motivations in Browsing Online Stores with Mobile Devices. International Journal of Electronic Commerce. 16(4), 153-178.
Park, E. J., Kim, E. Y., Funches, V.M., & Foxx, W. (2012). Apparel product attributes, web browsing, and e-impulse buying on shopping websites. Journal of Business Research, 65, 1583-1589.
Patrick Mikalef, Michael Gianakos, and Admantia Pateli. (2013). Shopping and Word of Mouth Intentions on Social Media. Journal of Theorotical and Applied Electronic Commerce Research. ISSN 0718-1876.
Rene Weber, Ron Tamborini, Amber Westcott=Barker, Benjamin Kantor. (2009). Theorizing Flow and Media Enjoyment as Cognitive Syncronization of Attentional and Rewards Networks.Communication Theory.
Vol. 9, No. 2, 2019Esensi: Jurnal Bisnis dan Manajemen
224 http://journal.uinjkt.ac.id/index.php/esensiDOI: https://doi.org/10.15408/ess.v9i2.9942
Smith, D. N., & Sivakumar, K. (2004). Flow and Internet shopping behavior: A conceptual model and research propositions. Journal of Business Research, 57, 1199-1208.
Sugiyono., & Susanto, A. (2015). SPSS & Risrel, Teori dan Aplikasi untuk Analisis Data Penelitian. Bandung: Penerbit Alfabeta.
Susan Rose. (2012). Online Customer Experience in e-Retailing: An empirical model of, Antecedents and Outcomes, Journal of Retailing 88 (2), 308–322.
Yakov Bart, Andrew T. Stephen, Miklos Sarvary. (2014). Which Product are Best Suited to Mobile Advertising? A Field Study of Mobile Display Advertising Effect on Cunsomer Attitudes and Intentions. Journal of Marketing Research. Vol L1, 270-285.
Nurul Humairo1*, Indah Yuliana2
1, 2 Universitas Islam Negeri Maulana Malik Ibrahim [email protected], [email protected]*Penulis korespondensi
AbstractThis study examines the effect of demographic factors on personal financial management with spiritual intelligence as a moderating variable. The sampling technique is proportionate random sampling, the number of research samples 388 students of State Islamic University Maulana Malik Ibrahim Malang. The test results indicate an influence on personal financial management. The positive influence of demographic factors with age characteristics on personal financial management. As for the characteristics of the sex found no influence on personal financial management. Spiritual intelligence as a moderating variable is able to strengthen the relationship between demographic factors and personal financial management of State Islamic University Maulana Malik Ibrahim Malang students. Education providers to design finance education patterns can use the implications of this study for students.Keywords: demographic factors, personal financial management, spiritual intelligence
AbstrakPenelitian ini menguji pengaruh faktor demografi terhadap manajemen keuangan pribadi dengan kecerdasan spiritual sebagai variabel moderasi. Proportionate random sampling merupakan teknik yang digunakan untuk pengambilan sampel, terdapat 388 mahasiswa UIN Maulana Malik Ibrahim Malang sebagai sampel penelitian. Hasil uji menunjukkan adanya pengaruh terhadap manajemen keuangan pribadi. Adanya pengaruh positif faktor demografi dengan karakteristik usia terhadap manajemen keuangan pribadi. Sedangkan untuk karakteristik jenis kelamin tidak ditemukan pengaruh terhadap manajemen keuangan pribadi. Kecerdasan spiritual sebagai variabel moderasi mampu memperkuat hubungan antara faktor demografi terhadap pengelolaan keuangan pribadi Mahasiswa UIN Maulana Malik Ibrahim Malang. Implikasi penelitian ini agar dapat digunakan bagi penyelenggara pendidikan untuk mendesain pola pendidikan keuangan pada mahasiswa.Kata kunci: faktor demografi, manajemen keuangan pribadi, kecerdasan spiritual
Mampukah Kecerdasan Spiritual Memoderasi Hubungan Faktor Demografi dalam Mengelola Keuangan Pribadi Mahasiswa?
Draft awal: 15 Juli 2019; Revisi: 10 September 2019; Diterima: 05 Oktober 2019http://journal.uinjkt.ac.id/index.php/esensiDOI: https://doi.org/10.15408/ess.v9i2.13236
Esensi: Jurnal Bisnis dan ManajemenVolume 9 (2), 2019
P-ISSN: 2087-2038; E-ISSN:2461-1182Halaman 225 - 234
Vol. 9, No. 2, 2019Esensi: Jurnal Bisnis dan Manajemen
226 http://journal.uinjkt.ac.id/index.php/esensiDOI: https://doi.org/10.15408/ess.v9i2.13236
PENDAHULUANPengetahuan tentang keuangan sangat penting dalam pengelolaan keuangan individu.
Sering sekali melihat fenomena masyarakat luas yang mengalami kesulitan dalam mengelola uangnya, bukan diakibatkan jumlah pendapatan yang sedikit, akan tetapi kurangnya pengetahuan dalam pengelolaan keuangan pribadi. Adanya pengetahuan dalam mengelola keuangan tersebut, individu akan mampu mengelola keuangannya, sehingga akan memperoleh keuntungan yang semakin besar dan dapat meningkatkan taraf kehidupannya, memiliki sikap perilaku keuangan yang baik juga penting untuk seorang individu agar masalah keuangan tidak menghampirinya (Safitri & Sukirman, 2018). Banyak manfaat yang bisa didapat apabila dapat mengelola keuangan dengan baik, antara lain melatih pola hidup hemat, melatih untuk lebih tertib dan teratur, memiliki perlindungan dari perencanaan yang tidak terduga, menghindari diri dari utang, dan masa depan yang terencana dengan baik. Manajemen keuangan dikatakan baik apabila mampu mengelola uang yang masuk dan keluar, memanajemen hutang, memiliki tabungan dan melakukan investasi (Laily, 2016).
Berdasarkan hasil empiris, seseorang dalam mengelola keuangannya dipengaruhi beberapa faktor, diantaranya adalah faktor demografi. Karakteristik dari demografi yaitu umur, gender, status kawin, pendapatan, dan tingkat pendidikan (Lai & Tan, 2009; Purwidianti & Mudjiyanti, 2016). Usia muda sering mengalami kesulitan dalam mengontrol keluar masuknya uang mereka karena faktor ekonomi, seperti tabungan rendah dan pendapatan tidak teratur, mengakibatkan mereka menghadapi kekurangan dana yang berdampak pada bagaimana mereka mempertahankan gaya hidup (Bamforth dkk, 2018). Kelompok usia dewasa akan lebih bijakasana dalam mengatur pengeluaran keuangannya dibandingkan dengan usia muda (Hidayat & Sinaga, 2017). Akan tetapi, kemampuan usia muda dalam mengelola keuangan akan berkembang seiring berjalannya waktu. Hal ini disebabkan karena situasi keuangan yang berubah selama bertahun-tahun, dan diikuti dengan respons individu terhadap pengelolaan situasi tersebut (Serido dkk, 2013). Berbeda dengan hasil penelitian Vhalery dkk (2018), yang tidak menemukan adanya pengaruh usia terhadap pengelolaan keuangan mahasiswa.
Disisi lain, karakteristik demografi yang diduga berpengaruh adalah jenis kelamin. Berdasarkan hasil empiris ada perbedaan antara laki-laki dengan perempuan dalam mengelola keuangan. Adanya dorongan lebih tinggi yang dimiliki perempuan dalam melakukan pembelian dibandingkan dengan laki-laki (Sapitri & Suprapti, 2014). Akan tetapi, pada perempuan yang telah berkeluarga cenderung melihat kembali apa yang telah mereka lakukan terhadap uang yang mereka miliki dibanding laki-laki (Sina, 2013). Apabila dilihat dari keputusan untuk berinvestasi, perempuan lebih menentang resiko daripada laki-laki (Stendardi dkk, 2006). Hal ini disebabkan karena laki-laki lebih percaya diri tentang pengetahuan mereka mengenai pasar saham (Baker dkk, 2019; Mishra & Metilda, 2015). Menurut Ansong & Gyensare (2012), laki-laki memiliki tingkat pengetahuan keuangan lebih tinggi daripada perempuan. Akan tetapi, pernyataan diatas bertolak belakang dengan hasil penelitian Hidayat & Sinaga (2017) tidak menemukan adanya pengelolaan keuangan yang berbeda antara laki-laki dengan perempuan.
Penelitian ini dilakukan untuk menganalisis perilaku mahasiswa S1 UIN Maliki Malang dalam pengelolaan keuangan pribadi. Tujuan penelitian ini untuk menguji hubungan antara

227
Mampukah Kecerdasan Spiritual Memoderasi Hubungan Faktor DemografiNurul Humairo
http://journal.uinjkt.ac.id/index.php/esensiDOI: https://doi.org/10.15408/ess.v9i2.13236
faktor demografi dengan manajemen keuangan pribadi dan bagaimana variabel kecerdasan spiritual memoderasi hubungan antara faktor demografi terhadap manajemen keuangan pribadi. Karakteristik demografi yang digunakan adalah usia dan jenis kelamin.
Di samping itu, peneliti juga ingin menguji apakah kecerdasan spiritual sebagai mampu memperkuat atau justru memperlemah pengaruh faktor demografi terhadap manajemen keuangan pribadi, hasil empiris mengatakan bahwa tidak ada pengaruh signifikan kecerdasan spiritual terhadap manajemen keuangan pribadi (Faridawati & Silvy, 2019; Sina & Noya, 2012). Hasil penelitian ini diperkuat oleh (Ayranci, 2011), faktor kecerdasan spiritual berpengaruh sangat lemah terhadap manajemen keuangan pribadi. Akan tetapi, pernyataan diatas bertolak belakang dengan penelitian (Chotimah & Rohayati, 2015), bahwa manajemen keuangan pribadi tidak dipengaruhi oleh kecerdasan spiritual. Hasil penelitian terdahulu yang yang berbeda membuat peneliti mengambil celah penelitian tentang pengaruh faktor demografi yang dimoderasi oleh kecerdasan spiritual terhadap manajemen keuangan pribadi, dan tujuan penelitian ini adalah untuk mengetahui pengaruh faktor demografi terhadap manajemen keuangan pribadi yang dimoderasi oleh kecerdasan spiritual.
METODEPenelitian ini adalah penelitian deskriptif kuantitatif. Populasi dalam penelitian ini
yaitu Mahasiswa S1 UIN Maliki Malang angkatan 2016 sampai 2019 yang berjumlah 12867 mahasiswa. Menggunakan teknik pengambilan sampel secara acak dengan memperhatikan proporsi dalam populasi tersebut yang disebut teknik proportionate random sampling. Dengan menggunakan error margin sebesar 5% didapatkan jumlah sampel sebanyak 388 mahasiswa. Adapun rincian sebaran responden dapat dilihat pada Tabel 1.
Tabel 1. Jumlah sampel yang digunakan
Mahasiswa Angkatan 2016 2017 2018 2019
Ekonomi 12 12 16 16
Humaniora 12 12 12 12
Saintek 19 16 19 23
Ilmu Tarbiyah dan Keguruan 23 23 23 27
Syariah 16 16 16 19
Psikologi 8 8 8 8
Kedokteran dan Ilmu Kesehatan 4 4 4 4
Sumber: data diolah (2019)
Terdapat 2 data dalam penelitian ini, data primer yang diperoleh dari hasil survey penyebaran kuesioner online dan offline yang diberikan kepada Mahasiswa S1 UIN Maliki Malang, dan data sekunder diperoleh dari BAK Pusat untuk mengetahui jumlah seluruh Mahasiswa S1 UIN Maliki Malang yang masih aktif. Variabel independent penelitian ini adalah faktor demografi dengan karakteristik yang digunakan adalah usia dan jenis kelamin (Hidayat & Sinaga, 2017). Variabel dependent yang digunakan yaitu manajemen keuangan pribadi dengan 3 indikator yang digunakan, yaitu perilaku perencanaan keuangan, perilaku
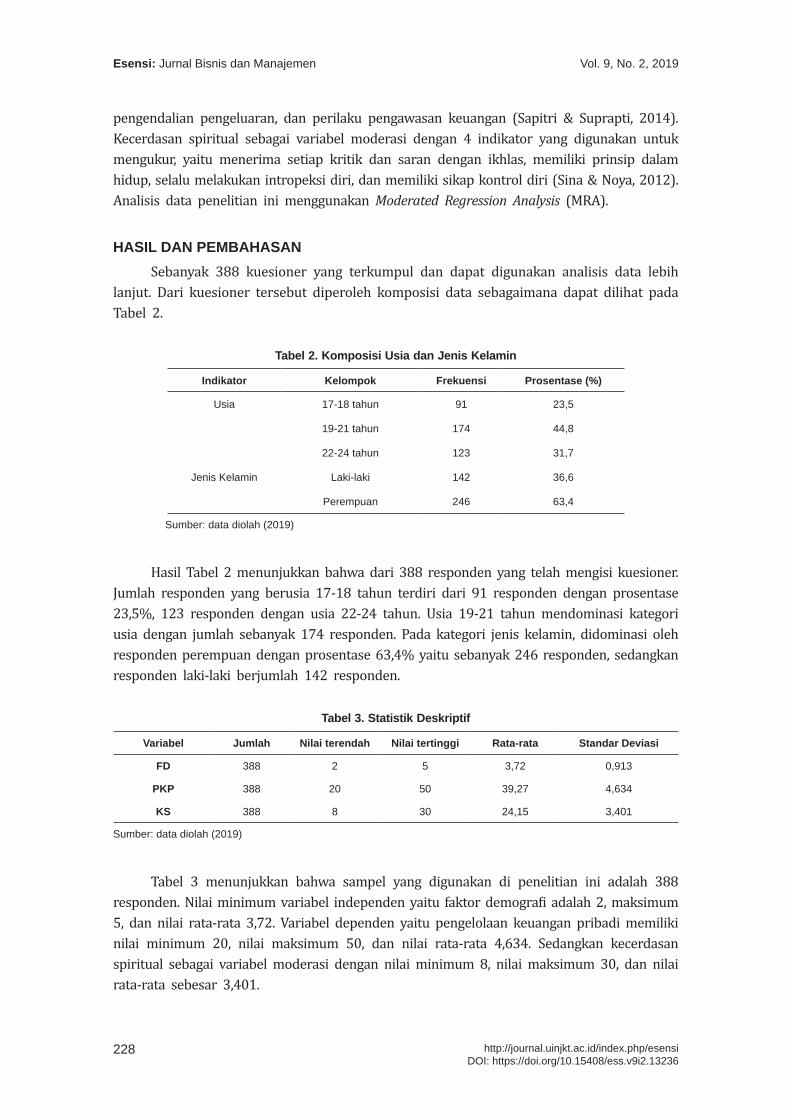
Vol. 9, No. 2, 2019Esensi: Jurnal Bisnis dan Manajemen
228 http://journal.uinjkt.ac.id/index.php/esensiDOI: https://doi.org/10.15408/ess.v9i2.13236
pengendalian pengeluaran, dan perilaku pengawasan keuangan (Sapitri & Suprapti, 2014). Kecerdasan spiritual sebagai variabel moderasi dengan 4 indikator yang digunakan untuk mengukur, yaitu menerima setiap kritik dan saran dengan ikhlas, memiliki prinsip dalam hidup, selalu melakukan intropeksi diri, dan memiliki sikap kontrol diri (Sina & Noya, 2012). Analisis data penelitian ini menggunakan Moderated Regression Analysis (MRA).
HASIL DAN PEMBAHASANSebanyak 388 kuesioner yang terkumpul dan dapat digunakan analisis data lebih
lanjut. Dari kuesioner tersebut diperoleh komposisi data sebagaimana dapat dilihat pada Tabel 2.
Tabel 2. Komposisi Usia dan Jenis Kelamin
Indikator Kelompok Frekuensi Prosentase (%)
Usia 17-18 tahun 91 23,5
19-21 tahun 174 44,8
22-24 tahun 123 31,7
Jenis Kelamin Laki-laki 142 36,6
Perempuan 246 63,4
Sumber: data diolah (2019)
Hasil Tabel 2 menunjukkan bahwa dari 388 responden yang telah mengisi kuesioner. Jumlah responden yang berusia 17-18 tahun terdiri dari 91 responden dengan prosentase 23,5%, 123 responden dengan usia 22-24 tahun. Usia 19-21 tahun mendominasi kategori usia dengan jumlah sebanyak 174 responden. Pada kategori jenis kelamin, didominasi oleh responden perempuan dengan prosentase 63,4% yaitu sebanyak 246 responden, sedangkan responden laki-laki berjumlah 142 responden.
Tabel 3. Statistik Deskriptif
Variabel Jumlah Nilai terendah Nilai tertinggi Rata-rata Standar Deviasi
FD 388 2 5 3,72 0,913
PKP 388 20 50 39,27 4,634
KS 388 8 30 24,15 3,401
Sumber: data diolah (2019)
Tabel 3 menunjukkan bahwa sampel yang digunakan di penelitian ini adalah 388 responden. Nilai minimum variabel independen yaitu faktor demografi adalah 2, maksimum 5, dan nilai rata-rata 3,72. Variabel dependen yaitu pengelolaan keuangan pribadi memiliki nilai minimum 20, nilai maksimum 50, dan nilai rata-rata 4,634. Sedangkan kecerdasan spiritual sebagai variabel moderasi dengan nilai minimum 8, nilai maksimum 30, dan nilai rata-rata sebesar 3,401.
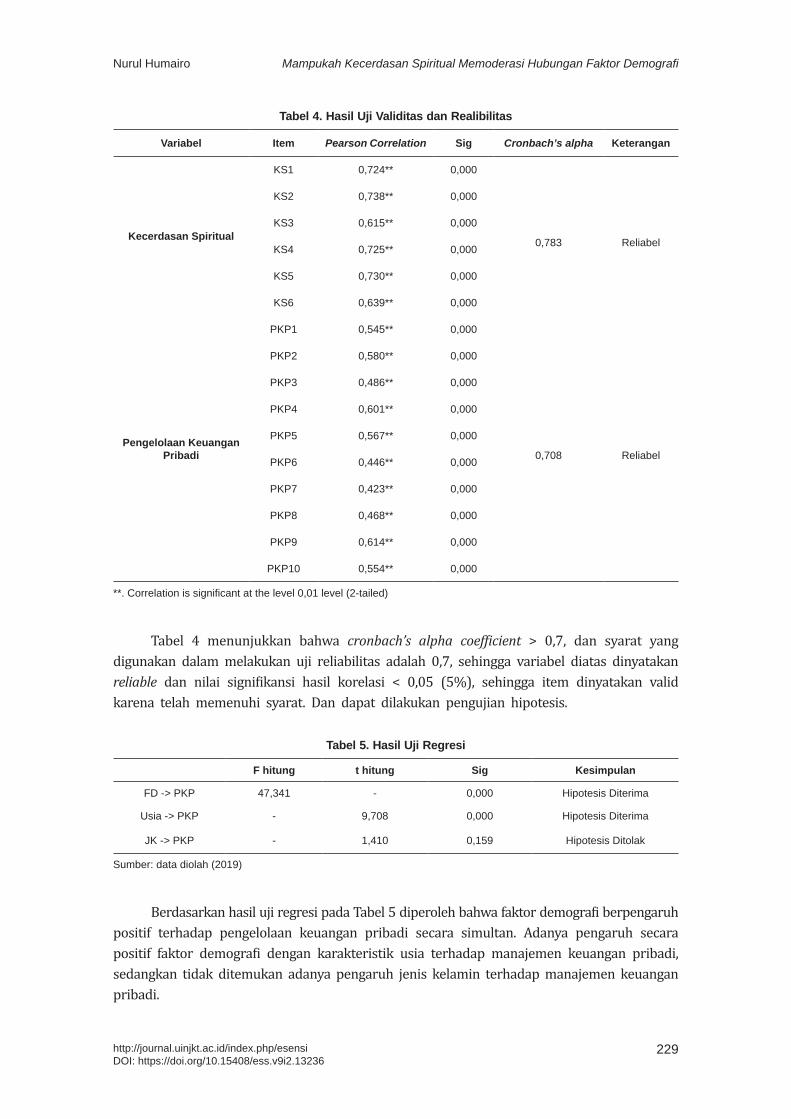
229
Mampukah Kecerdasan Spiritual Memoderasi Hubungan Faktor DemografiNurul Humairo
http://journal.uinjkt.ac.id/index.php/esensiDOI: https://doi.org/10.15408/ess.v9i2.13236
Tabel 4. Hasil Uji Validitas dan Realibilitas
Variabel Item Pearson Correlation Sig Cronbach’s alpha Keterangan
Kecerdasan Spiritual
KS1 0,724** 0,000
0,783 Reliabel
KS2 0,738** 0,000
KS3 0,615** 0,000
KS4 0,725** 0,000
KS5 0,730** 0,000
KS6 0,639** 0,000
Pengelolaan Keuangan Pribadi
PKP1 0,545** 0,000
0,708 Reliabel
PKP2 0,580** 0,000
PKP3 0,486** 0,000
PKP4 0,601** 0,000
PKP5 0,567** 0,000
PKP6 0,446** 0,000
PKP7 0,423** 0,000
PKP8 0,468** 0,000
PKP9 0,614** 0,000
PKP10 0,554** 0,000
**. Correlation is significant at the level 0,01 level (2-tailed)
Tabel 4 menunjukkan bahwa cronbach’s alpha coefficient > 0,7, dan syarat yang digunakan dalam melakukan uji reliabilitas adalah 0,7, sehingga variabel diatas dinyatakan reliable dan nilai signifikansi hasil korelasi < 0,05 (5%), sehingga item dinyatakan valid karena telah memenuhi syarat. Dan dapat dilakukan pengujian hipotesis.
Tabel 5. Hasil Uji Regresi
F hitung t hitung Sig Kesimpulan
FD -> PKP 47,341 - 0,000 Hipotesis Diterima
Usia -> PKP - 9,708 0,000 Hipotesis Diterima
JK -> PKP - 1,410 0,159 Hipotesis Ditolak
Sumber: data diolah (2019)
Berdasarkan hasil uji regresi pada Tabel 5 diperoleh bahwa faktor demografi berpengaruh positif terhadap pengelolaan keuangan pribadi secara simultan. Adanya pengaruh secara positif faktor demografi dengan karakteristik usia terhadap manajemen keuangan pribadi, sedangkan tidak ditemukan adanya pengaruh jenis kelamin terhadap manajemen keuangan pribadi.
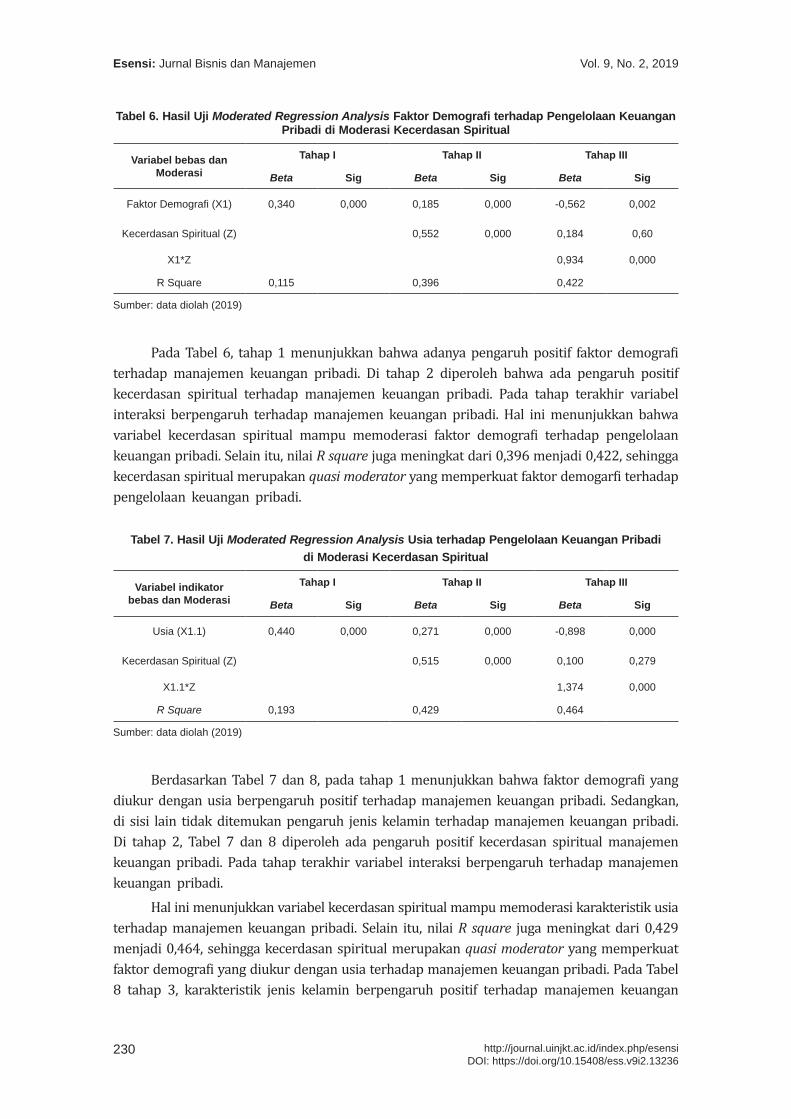
Vol. 9, No. 2, 2019Esensi: Jurnal Bisnis dan Manajemen
230 http://journal.uinjkt.ac.id/index.php/esensiDOI: https://doi.org/10.15408/ess.v9i2.13236
Tabel 6. Hasil Uji Moderated Regression Analysis Faktor Demografi terhadap Pengelolaan Keuangan Pribadi di Moderasi Kecerdasan Spiritual
Variabel bebas dan Moderasi
Tahap I Tahap II Tahap III
Beta Sig Beta Sig Beta Sig
Faktor Demografi (X1) 0,340 0,000 0,185 0,000 -0,562 0,002
Kecerdasan Spiritual (Z) 0,552 0,000 0,184 0,60
X1*Z 0,934 0,000
R Square 0,115 0,396 0,422
Sumber: data diolah (2019)
Pada Tabel 6, tahap 1 menunjukkan bahwa adanya pengaruh positif faktor demografi terhadap manajemen keuangan pribadi. Di tahap 2 diperoleh bahwa ada pengaruh positif kecerdasan spiritual terhadap manajemen keuangan pribadi. Pada tahap terakhir variabel interaksi berpengaruh terhadap manajemen keuangan pribadi. Hal ini menunjukkan bahwa variabel kecerdasan spiritual mampu memoderasi faktor demografi terhadap pengelolaan keuangan pribadi. Selain itu, nilai R square juga meningkat dari 0,396 menjadi 0,422, sehingga kecerdasan spiritual merupakan quasi moderator yang memperkuat faktor demogarfi terhadap pengelolaan keuangan pribadi.
Tabel 7. Hasil Uji Moderated Regression Analysis Usia terhadap Pengelolaan Keuangan Pribadi di Moderasi Kecerdasan Spiritual
Variabel indikator bebas dan Moderasi
Tahap I Tahap II Tahap III
Beta Sig Beta Sig Beta Sig
Usia (X1.1) 0,440 0,000 0,271 0,000 -0,898 0,000
Kecerdasan Spiritual (Z) 0,515 0,000 0,100 0,279
X1.1*Z 1,374 0,000
R Square 0,193 0,429 0,464
Sumber: data diolah (2019)
Berdasarkan Tabel 7 dan 8, pada tahap 1 menunjukkan bahwa faktor demografi yang diukur dengan usia berpengaruh positif terhadap manajemen keuangan pribadi. Sedangkan, di sisi lain tidak ditemukan pengaruh jenis kelamin terhadap manajemen keuangan pribadi. Di tahap 2, Tabel 7 dan 8 diperoleh ada pengaruh positif kecerdasan spiritual manajemen keuangan pribadi. Pada tahap terakhir variabel interaksi berpengaruh terhadap manajemen keuangan pribadi.
Hal ini menunjukkan variabel kecerdasan spiritual mampu memoderasi karakteristik usia terhadap manajemen keuangan pribadi. Selain itu, nilai R square juga meningkat dari 0,429 menjadi 0,464, sehingga kecerdasan spiritual merupakan quasi moderator yang memperkuat faktor demografi yang diukur dengan usia terhadap manajemen keuangan pribadi. Pada Tabel 8 tahap 3, karakteristik jenis kelamin berpengaruh positif terhadap manajemen keuangan
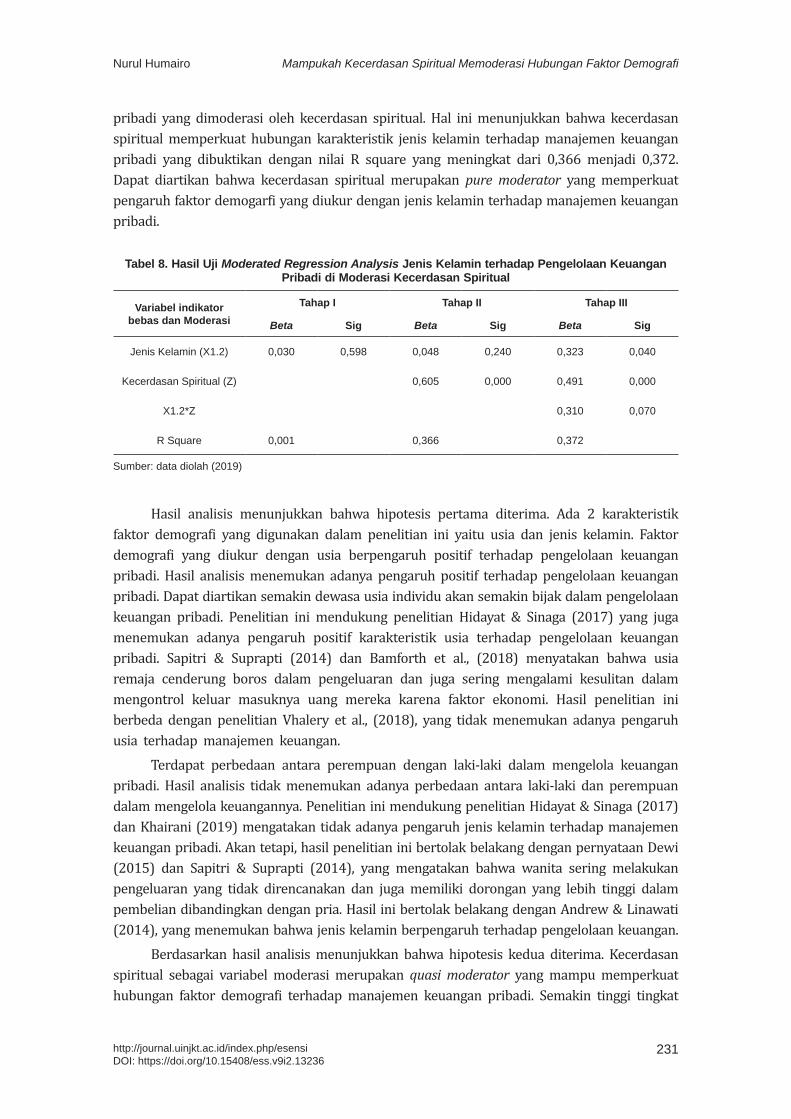
231
Mampukah Kecerdasan Spiritual Memoderasi Hubungan Faktor DemografiNurul Humairo
http://journal.uinjkt.ac.id/index.php/esensiDOI: https://doi.org/10.15408/ess.v9i2.13236
pribadi yang dimoderasi oleh kecerdasan spiritual. Hal ini menunjukkan bahwa kecerdasan spiritual memperkuat hubungan karakteristik jenis kelamin terhadap manajemen keuangan pribadi yang dibuktikan dengan nilai R square yang meningkat dari 0,366 menjadi 0,372. Dapat diartikan bahwa kecerdasan spiritual merupakan pure moderator yang memperkuat pengaruh faktor demogarfi yang diukur dengan jenis kelamin terhadap manajemen keuangan pribadi.
Tabel 8. Hasil Uji Moderated Regression Analysis Jenis Kelamin terhadap Pengelolaan Keuangan Pribadi di Moderasi Kecerdasan Spiritual
Variabel indikator bebas dan Moderasi
Tahap I Tahap II Tahap III
Beta Sig Beta Sig Beta Sig
Jenis Kelamin (X1.2) 0,030 0,598 0,048 0,240 0,323 0,040
Kecerdasan Spiritual (Z) 0,605 0,000 0,491 0,000
X1.2*Z 0,310 0,070
R Square 0,001 0,366 0,372
Sumber: data diolah (2019)
Hasil analisis menunjukkan bahwa hipotesis pertama diterima. Ada 2 karakteristik faktor demografi yang digunakan dalam penelitian ini yaitu usia dan jenis kelamin. Faktor demografi yang diukur dengan usia berpengaruh positif terhadap pengelolaan keuangan pribadi. Hasil analisis menemukan adanya pengaruh positif terhadap pengelolaan keuangan pribadi. Dapat diartikan semakin dewasa usia individu akan semakin bijak dalam pengelolaan keuangan pribadi. Penelitian ini mendukung penelitian Hidayat & Sinaga (2017) yang juga menemukan adanya pengaruh positif karakteristik usia terhadap pengelolaan keuangan pribadi. Sapitri & Suprapti (2014) dan Bamforth et al., (2018) menyatakan bahwa usia remaja cenderung boros dalam pengeluaran dan juga sering mengalami kesulitan dalam mengontrol keluar masuknya uang mereka karena faktor ekonomi. Hasil penelitian ini berbeda dengan penelitian Vhalery et al., (2018), yang tidak menemukan adanya pengaruh usia terhadap manajemen keuangan.
Terdapat perbedaan antara perempuan dengan laki-laki dalam mengelola keuangan pribadi. Hasil analisis tidak menemukan adanya perbedaan antara laki-laki dan perempuan dalam mengelola keuangannya. Penelitian ini mendukung penelitian Hidayat & Sinaga (2017) dan Khairani (2019) mengatakan tidak adanya pengaruh jenis kelamin terhadap manajemen keuangan pribadi. Akan tetapi, hasil penelitian ini bertolak belakang dengan pernyataan Dewi (2015) dan Sapitri & Suprapti (2014), yang mengatakan bahwa wanita sering melakukan pengeluaran yang tidak direncanakan dan juga memiliki dorongan yang lebih tinggi dalam pembelian dibandingkan dengan pria. Hasil ini bertolak belakang dengan Andrew & Linawati (2014), yang menemukan bahwa jenis kelamin berpengaruh terhadap pengelolaan keuangan.
Berdasarkan hasil analisis menunjukkan bahwa hipotesis kedua diterima. Kecerdasan spiritual sebagai variabel moderasi merupakan quasi moderator yang mampu memperkuat hubungan faktor demografi terhadap manajemen keuangan pribadi. Semakin tinggi tingkat
Vol. 9, No. 2, 2019Esensi: Jurnal Bisnis dan Manajemen
232 http://journal.uinjkt.ac.id/index.php/esensiDOI: https://doi.org/10.15408/ess.v9i2.13236
spiritualitas seseorang maka akan semakin baik individu tersebut dalam mengelola keuangannya. Zohar & Marshall (2007) mengatakan bahwa individu yang memiliki kecerdasan spiritual yang tinggi mampu membangun diri secara utuh dan memiliki sikap kreatif dan berwawasan luas. Selain itu, Menurut Darmadi (2018) kecerdasan spiritual mampu memberikan makna dalam setiap perbuatan. Kecerdasan spiritual juga membuat invidu menjadi pribadi yang memiliki sikap tanggung jawab, mandiri, jujur dan optimal (Chotimah & Rohayati, 2015; Sina & Noya, 2012). Pada penelitian terdahulu juga ditemukan bahwa manajemen keuangan pribadi dipengaruhi oleh kecerdasan spiritual (Faridawati & Silvy, 2019; Sina & Noya, 2012). Akan tetapi, Chotimah & Rohayati (2015) yang tidak menemukan adanya pengaruh kecerdasan spiritual terhadap manajemen keuangan pribadi. Hasil analisis juga menguji bagaimana peran kecerdasan spiritual sebagai variabel moderasi pada setiap karakteristik faktor demografi yang digunakan pada penelitian ini.
Hasilnya menunjukkan bahwa: Pertama, ada karakteristik usia, kecerdasan spiritual mampu memperkuat hubungan antara karakteristik usia terhadap pengelolaan keuangan pribadi. Kecerdasan spiritual sebagai quasi moderator memperkuat hubungan usia ke pengelolaan keuangan pribadi dengan kenaikan koefisien determinasi lebih tinggi dibandingkan dengan karakteristik jenis kelamin. Kedua, pada karakteristik jenis kelamin, kecerdasan spiritual juga mampu memperkuat hubungan karakteristik jenis kelamin terhadap pengelolaan keuangan pribadi. Kecerdasan spiritual sebagai pure moderator yang memperkuat hubungan jenis kelamin ke pengelolaan keuangan pribadi, dengan koefisien determinasi yang lebih rendah.
SIMPULANBerdasarkan hasil penelitian ini ditemukan adanya pengaruh positif faktor demografi
terhadap manajemen keuangan pribadi pada Mahasiswa S1 UIN Maulana Malik Ibrahim Malang. Selanjutnya, kecerdasan spiritual sebagai variabel moderasi mampu memperkuat hubungan antara faktor demografi terhadap manajemen keuangan pribadi, semakin tinggi tingkat kecerdasan spiritual individu makan akan semakin bijak dalam mengelola keuangannya. Berdasarkan karakteristik, kecerdasan spiritual juga mampu memperkuat hubungan antara karakteristik jenis kelamin dan usia terhadap manajemen keuangan pribadi, ditemukan bahwa peningkatan koefisien determinasi usia lebih tinggi dibandingkan jenis kelamin, sehingga pengaruh usia yang dimoderasi kecerdasan spiritual lebih tinggi dibanding pengaruh jenis kelamin yang dimoderasi kecerdasan spiritual.
PUSTAKA ACUANAndrew, V., & Linawati, N. (2014). Hubungan Faktor Demografi dan Pengetahuan Keuangan
Dengan Perilaku Keuangan Karyawan Swasta di Surabaya. Finesta. Vol. 2(2), 35–39.Ansong, A., & Gyensare, M. A. (2012). Determinants of University Working-Students’ Financial
Literacy at the University of Cape Coast, Ghana. International Journal of Business and Management. Vol. 7(9), 126.
Ayranci, E. (2011). Effect Of Top Turkish Managers’ Emotional and Spiritual Intelligences on Their Organizations’ Financial Performance. Financial Performance. Vol. 28.
Baker, H. K., Kumar, S., Goyal, N., & Gaur, V. (2019). How financial literacy and demographic
233
Mampukah Kecerdasan Spiritual Memoderasi Hubungan Faktor DemografiNurul Humairo
http://journal.uinjkt.ac.id/index.php/esensiDOI: https://doi.org/10.15408/ess.v9i2.13236
variables relate to behavioral biases. Managerial Finance. Vol. 45(1): 124–146. doi: https://doi.org/10.1108/MF-01-2018-0003.
Bamforth, J., Jebarajakirthy, C., & Geursen, G. (2018). Understanding undergraduates’ money management behaviour: A study beyond financial literacy. International Journal of Bank Marketing. Vol. 36(7): 1285–1310.
Chotimah, C., & Rohayati, S. (2015). Pengaruh Pendidikan Keuangan di Keluarga, Sosial Ekonomi Orang Tua, Pengetahuan Keuangan, Kecerdasan Spiritual, dan Teman Sebaya terhadap Manajamen Keuangan Pribadi Mahasiswa S1 Pendidikan Akuntansi Fakultas Ekonomi Universitas Negeri Surabaya. Vol. 10.
Darmadi, H. (2018). Kecerdasan Spiritual. Bogor: Guepedia.Dewi, H. P. (2015). Cerdas Mengelola Keuangan Pribadi. Yogyakarta: Stiletto Book.Faridawati, R., & Silvy, M. (2019). Pengaruh niat berperilaku dan kecerdasan spiritual terhadap
pengelolaan keuangan keluarga. Journal of Business & Banking. Vol. 7(1). doi: https://doi.org/10.14414/jbb.v7i1.1465.
Herlindawati, D. (2017). Pengaruh Kontrol Diri, Jenis Kelamin, dan Pendapatan terhadap Pengelolaan Keuangan Pribadi Mahasiswa Pascasarjana Universitas Negeri Surabaya. Jurnal Ekonomi Pendidikan dan Kewirausahaan. Vol. 3(2): 158. doi: 10.26740/jepk.v3n2.p158-169.
Hidayat, R., & Sinaga, I. W. (2017). Pengaruh Faktor Demografi dan Kecerdasan Emosional terhadap Manajemen Keuangan Pribadi Mahasiswa Politeknik Negeri Batam. Vol. 11.
Khairani. (2019). Perbedaan Pengelolaan Keuangan Nagari berdasarkan Jenis Kelamin dan Tingkat Pendidikan di Kabupaten Tanah Datar. https://doi.org/10.31227/osf.io/py4uq.
Lai, M.-M., & Tan, W.-K. (2009). An Empirical Analysis of Personal Financial Planning in an Emerging Economy. Vol. (16): 13.
Laily, N. (2016). Pengaruh Literasi Keuangan terhadap Perilaku Mahasiswa dalam Mengelola Keuangan. Journal of Accounting and Business Education. Vol. 1(4). doi: https://doi.org/10.26675/jabe.v1i4.6042.
Mishra, K. C., & Metilda, M. J. (2015). A study on the impact of investment experience, gender, and level of education on overconfidence and self-attribution bias. IIMB Management Review. Vol. 27(4): 228–239. doi: https://doi.org/10.1016/j.iimb.2015.09.001
Purwidianti, W., & Mudjiyanti, R. (2016). Analisis Pengaruh Pengalaman Keuangan Dan Tingkat Pendapatan Terhadap Perilaku Keuangan Keluarga Di Kecamatan Purwokerto Timur. Benefit: Jurnal Manajemen Dan Bisnis. Vol. 1(2): 141-148. doi: 10.23917/benefit.v1i2.3257.
Safitri, N. A., & Sukirman. (2018). Analisis faktor-faktor yang mempengaruhi financial behavior. 14.Sapitri, N. L. G. A., & Suprapti, N. W. S. (2014). Hubungan Variabel Demografi Dengan Perilaku
Pembelian Impulsif Yang Dimoderasi Kepemilikan Kartu Kredit di Kota Denpasar. E-Jurnal Manajemen. Vol. 3(10). https://ojs.unud.ac.id/index.php/Manajemen/article/view/9439.
Serido, J., Shim, S., & Tang, C. (2013). A developmental model of financial capability: A framework for promoting a successful transition to adulthood. International Journal of Behavioral Development. Vol. 37(4): 287–297.
Vol. 9, No. 2, 2019Esensi: Jurnal Bisnis dan Manajemen
234 http://journal.uinjkt.ac.id/index.php/esensiDOI: https://doi.org/10.15408/ess.v9i2.13236
Sina, P. G. (2013). Financial Efficacy dan Financial Satisfaction: Ditinjau dari Perbedaan Gender. Jurnal Manajemen. Vol. 12.
Sina, P. G., & Noya, A. (2012). Pengaruh Kecerdasan Spiritual terhadap Pengelolaan Keuangan Pribadi. Jurnal Manajemen. Vol. 18.
Stendardi, E. J., Graham, J. F., & O’Reilly, M. (2006). The impact of gender on the personal financial planning process: Should financial advisors tailor their process to the gender of the client? Humanomics. Vol. 22(4): 223–238.
Vhalery, R., Leksono, A. W., & Irvan, M. (2018). Pengaruh Literasi Keuangan, Usia, dan Bimbingan Orang Tua terhadap Pengelolaan Uang Saku Mahasiswa UNINDRA. Vol. 8.
Zohar, D., & Marshall, I. (2007). SQ - Kecerdasan Spiritual. Bandung: Mizan Pustaka.
Yuli Dwi Astuti1*, Giawan Nur Fitria2 1, 2 Universitas Mercu Buana [email protected], [email protected]*Penulis korespondensi
AbstractThis study aims to determine the effect of tax planning and profitability on firm value with BOD diversity as a moderating variable. This research is motivated by the importance of information about the factors that can affect the value of the company. Company value in this study used price book value as an indicator of measurement. The population of this research is the property and real estate sector companies in companies listed on the Indonesia Stock Exchange in 2016 - 2018. The sample of this research is 30 issuers or 90 company financial statement data used in this study. This study uses multiple linear regressiosn with statistical tests and moderate regression analysis test with SPSS 23. The results of this study are tax planning and profitability have a positive and significant effect on firm value. Whereas BOD Diversity weakens the relationship between tax planning and profitability on firm value.Keywords: tax planning, profitability, firm value, BOD Diversity;
AbstrakPenelitian ini bertujuan untuk mengetahui pengaruh perencanaan pajak dan profitabilitas terhadap nilai perusahaan dengan BOD diversity sebagai variable moderasi. Penelitian ini dilatarbelakangi oleh pentingnya infomasi mengenai faktor-faktor yang dapat mempengaruhi nilai perusahaan. nilai perusahaan pada penelitian ini menggunakan price book value sebagai indicator pengukurannya. Populasi penelitian ini adalah perusahaan sector property dan real estate pada perusahaan yang terdaftar di BEI tahun 2016 – 2018. Sampel penelitian ini sebanyak 30 emiten atau 90 data laporan keuangan perusahaan yang digunakan dalam penelitian ini. Penelitian ini menggunakan regresi linear berganda dengan uji statistic dan uji moderate regression analysis. Hasil dari penelitian ini adalah perencanaan pajak dan profitabilitas berpegaruh posistif dan signifikan terhadap nilai perusahaan. Sedangkan BOD Diversity memperlemah hubungan antara perencanaan pajak dan profitabilitas terhadap nilai perusahaan. Kata kunci: perencanaan pajak, profitabilitas, nilai perusahaan, BOD Diversity
Pengaruh Perencanaan Pajak dan Profitabilitas Terhadap Nilai Perusahaan dengan BOD Diversity sebagai Variabel Moderasi
Draft awal: 25 Juli 2019; Revisi: 12 September 2019; Diterima: 15 Oktober 2019http://journal.uinjkt.ac.id/index.php/esensiDOI: https://doi.org/10.15408/ess.v9i2.13339
Esensi: Jurnal Bisnis dan ManajemenVolume 9 (2), 2019
P-ISSN: 2087-2038; E-ISSN:2461-1182Halaman 235 - 246
Vol. 9, No. 2, 2019Esensi: Jurnal Bisnis dan Manajemen
236 http://journal.uinjkt.ac.id/index.php/esensiDOI: https://doi.org/10.15408/ess.v9i2.13339
PENDAHULUANNilai perusahaan yang tinggi selalu menjadi keinginan bagi pemilik perusahaan, karena
perusahaan yang memiliki tingkat nilai perusahaan yang tinggi dianggap dapat mensejahterakan pemegang saham dan hal tersebut dapat menarik investor untuk menanamkan modalnya di perusahaan tersebut. Naik turunnya nilai perusahaan dapat dilihat dari harga sahamnya, semakin tinggi harga saham suatu perusahaan maka nilai perusahaan menjadi semakin tinggi begitupun sebaliknya semakin rendah harga saham maka nilai perusahaan menjadi semakin rendah.
Nilai perusahaan menunjukkan seberapa tinggi tingkat keberhasilan suatu perusahaan, selain itu nilai perusahaan yang tinggi akan membuat pasar ataupun investor percaya terhadap kinerja perusahaan pada saat ini dan masa yang akan datang (Cecilia dkk, 2015). Pada penilitan ini nilai perusahaan diukur menggunakan price to book value (PBV) yang merupakan rasio perbandingan harga saham terhadap nilai buku dari perusahaan. Rasio ini digunakan karena dengan rasio ini dapat diketahui apakah tingkat harga sahamnya overvalued atau undervalued dari nilai bukunya, sehingga dapat menilai tinggi atau rendahnya nilai perusahaan yang tercermin dari harga saham tersebut (Ayu & Suarjaya, 2017).
Dalam penelitian ini hanya akan membahas dua faktor yang dapat mempengaruhi nilai perusahaan yaitu manajemen pajak dan profitabilitas, karena dari penelitian yang sudah dilakukan sebelumnya, masih ditemukan ketidakkonsistenan hasil dalam pengaruh variabel tersebut terhadap nilai perusahaan baik secara langsung maupun tidak langsung. Manajemen pajak merupakan sarana yang digunakan perusahaan untuk memenuhi kewajiban perpajakan yang sesuai menurut undang – undang dengan jumlah pajak yang dibayarkan seminimal mungkin untuk memperoleh laba dan likuiditas yang diharapkan. Pajak dari sisi perusahaan adalah biaya yang bersifat mengurangi laba bersih. Perusahaan dalam menjalankan bisnisnya mengharapkan dapat mencapai laba maksimal, laba maksimal akan membuat nilai perusahaan tinggi sehingga dapat memakmurkan pemilik saham. (Marsaid & Pesudo, 2019).
Penelitian terdahulu terkait dengan perencanaan pajak terhadap nilai perusahaan dilakukan oleh Lestari & Wardhani (2015) menyatakan bahwa perencanaan pajak berpengaruh positif terhadap nilai perusahaan. Pengaruh positif ini menunjukkan bahwa dengan melakukan perencanaan pajak yang efektif maka akan dapat meningkatkan nilai perusahaan. Dan penelitian yang dilakukan Dewanta & Achmad (2017) menyatakan bahwa perencanaan pajak berpengaruh positif tidak signifikan terhadap nilai perusahaan. Sedangkan Christina (2019) menemukan hubungan negatif antara perencanaan pajak terhadap nilai perusahaan. Kartini & Apriwenni (2017), Yuliem (2018), Ayem & Tia (2019), menyatakan bahwa perencanaan pajak tidak berpengaruh terhadap nilai perusahaan.
Selain manajemen pajak, nilai perusahaan juga dapat dipengaruhi oleh Profitabilitas. Profitabilitas adalah suatu ukuran dalam menilai kinerja suatu perusahaan, profitabilitas menggambarkan kemampuan perusahaan dalam memanfaatkan asetnya secara efisien dalam menghasilkan laba perusahaan (Novarianto & Dwimulyani, 2019). Besar kecilnya profitabilitas yang dihasilkan suatu perusahaan dapat mempengaruhi nilai perusahaan, prospek perusahaan yang baik menunjukkan profitabilitas yang tinggi, perusahaan yang memiliki tingkat profitabilitas yang tinggi akan diminati sahamnya oleh investor sehingga investor akan merespon positif dan nilai perusahaan akan meningkat (Lumoly dkk, 2018).
237
Pengaruh Perencanaan Pajak dan Profitabilitas Terhadap Nilai PerusahaanYuli Dwi Astuti
http://journal.uinjkt.ac.id/index.php/esensiDOI: https://doi.org/10.15408/ess.v9i2.13339
Dewi (2015), dan Yunita (2016), meneliti bahwa profitabilitas memiliki pengaruh positif signifikan terhadap nilai perusahaan. Penelitian mereka didukung oleh penelitian yang dilakukan Isabela (2017), Agus (2017), Leonardus (2017), Aldea (2017), dan Purwohandoko (2017) yang menyatakan bahwa profitabilitas berpengaruh positif signifikan terhadap nilai perusahaan. Namun, beberapa penelitian mengenai pengaruh profitabilitas terhadap nilai perusahaan juga ada yang memiliki hasil yang berbeda, antara lain Grandy (2016) menyatakan bahwa penelitiannya memiliki hasil bahwa profitabilitas tidak berpengaruh signifikan terhadap nilai perusahaan. Hasil penelitian Grandy (2016) didukung oleh Ratih & Damayanti (2016), dan Kusmayanti & Astika (2016).
Pada penelitian ini ditambahkan variabel pemoderasi yaitu board diversity. Board diversity merupakan persebaran anggota dewan direksi dalam suatu perusahaan. Adanya persebaran dalam anggota dewan dipercaya dapat mempengaruhi nilai perusahaan, baik dalam jangka pendek maupun dalam jangka panjang. Persebaran dewan (board diversity) diduga memberikan dampak yang positif, semakin besar persebaran dalam anggotan dewan dapat menimbulkan semakin banyak konflik, namun persebaran tersebut dapat memberikan alternatif penyelesaian terhadap suatu masalah yang semakin beragam daripada anggota dewan yang homogen. Selain itu keragaman dalam dewan direksi memberikan karakteristik yang unik bagi perusahaan yang dapat menciptakan nilai tambah (Kusumastuti dkk, 2007).
Dalam penelitian ini latar belakang pendidikan dewan direksi merupakan ukuran yang digunakan untuk mengukur board diversity. latar belakang pendidikan anggota dewan yang sesuai dengan bidang yang dikerjakan akan lebih efektif dan efisien dalam mengambil keputusan dan dapat dengan tepat dalam melakukan pengelolaan perusahaan (Kristina & Wiratmaja, 2018). Penelitian terdahulu terkait dengan board diversity terhadap nilai perusahaan dilakukan oleh Lestari & Sinarti (2016) menyatakan bahwa board diversity (BSTUDY) berpengaruh negatif terhadap nilai perusahaan. Sedangkan Dewi & Dewi (2016) menyatakan bahwa board diversity (BSTUDY) berpengaruh signifikan positif terhadap nilai perusahaan sejalan dengan penelitian Khairani dan Harahap (2017) menyatakan bahwa board diversity (BSTUDY) berpengaruh signifikan positif terhadap nilai perusahaan. Sedangkan penelitian Astuti (2017), Kristina dan Wiratmaja (2018) menyatakan bahwa board diversity (BSTUDY) tidak berpengaruh terhadap nilai perusahaan.
Penelitian mengenai nilai perusahaan telah beberapa kali dilakukan, hasil penelitian yang tidak konsisten yang terdapat pada penelitian sebelumnya memotivasi peneliti untuk melakukan pengujian kembali mengenai nilai perusahaan. Tujuan dari penelitian ini adalah untuk mengetahui pengaruh manajemen pajak dan profitabilitas terhadap nilai perusahaan baik secara langsung atau jika dimoderasi dengan BOD Diversity. Hasil penelitian ini bermanfaat bagi para investor, khususnya investor pada perusahaan property dan real estate di Bursa Efek Indonesia agar dapat digunakan sebagai bahan pertimbangan dalam mengambil keputusan berinvestasi pada perusahaan sektor tersebut.
METODEPada penelitian ini termasuk dalam jenis penelitian kuantitatif deskriptif dengan
pendekatan kausal. Variabel yang digunakan dalam penelitian ini adalah manajemen pajak, profitabilitas, diversity board study dan nilai perusahaan. Penelitian ini menggunakan metode
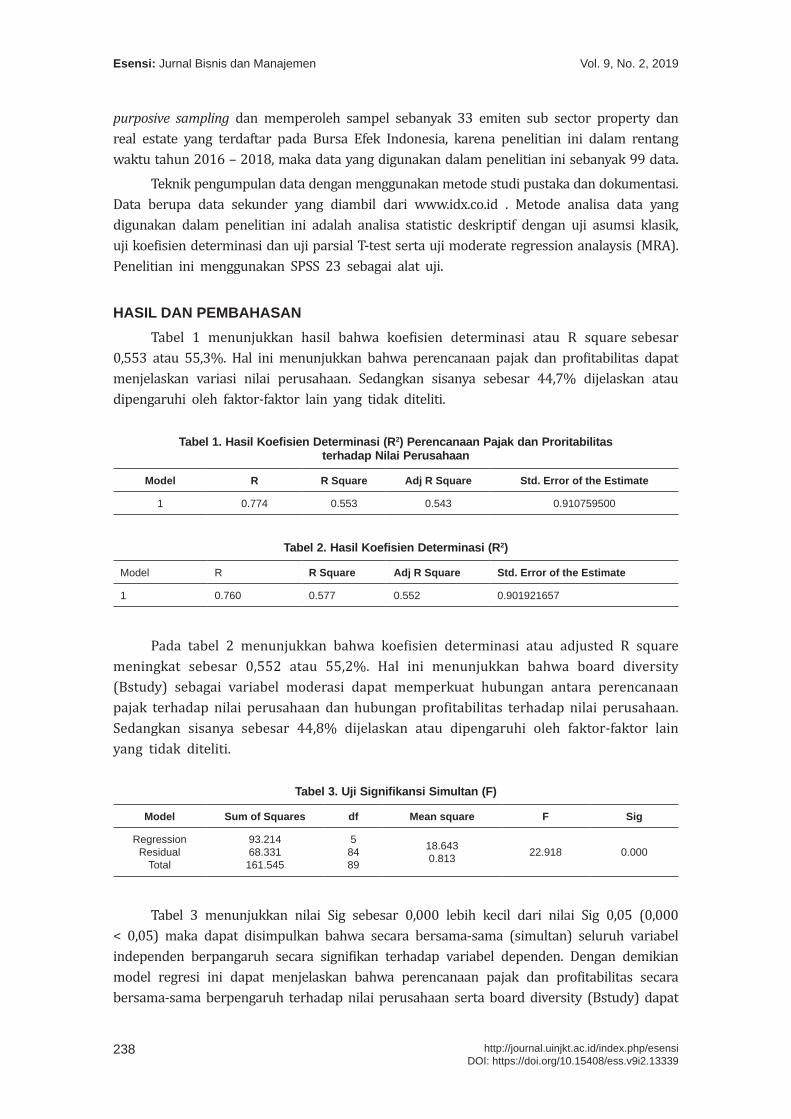
Vol. 9, No. 2, 2019Esensi: Jurnal Bisnis dan Manajemen
238 http://journal.uinjkt.ac.id/index.php/esensiDOI: https://doi.org/10.15408/ess.v9i2.13339
purposive sampling dan memperoleh sampel sebanyak 33 emiten sub sector property dan real estate yang terdaftar pada Bursa Efek Indonesia, karena penelitian ini dalam rentang waktu tahun 2016 – 2018, maka data yang digunakan dalam penelitian ini sebanyak 99 data.
Teknik pengumpulan data dengan menggunakan metode studi pustaka dan dokumentasi. Data berupa data sekunder yang diambil dari www.idx.co.id . Metode analisa data yang digunakan dalam penelitian ini adalah analisa statistic deskriptif dengan uji asumsi klasik, uji koefisien determinasi dan uji parsial T-test serta uji moderate regression analaysis (MRA). Penelitian ini menggunakan SPSS 23 sebagai alat uji.
HASIL DAN PEMBAHASANTabel 1 menunjukkan hasil bahwa koefisien determinasi atau R square sebesar
0,553 atau 55,3%. Hal ini menunjukkan bahwa perencanaan pajak dan profitabilitas dapat menjelaskan variasi nilai perusahaan. Sedangkan sisanya sebesar 44,7% dijelaskan atau dipengaruhi oleh faktor-faktor lain yang tidak diteliti.
Tabel 1. Hasil Koefisien Determinasi (R2) Perencanaan Pajak dan Proritabilitas terhadap Nilai Perusahaan
Model R R Square Adj R Square Std. Error of the Estimate
1 0.774 0.553 0.543 0.910759500
Tabel 2. Hasil Koefisien Determinasi (R2)
Model R R Square Adj R Square Std. Error of the Estimate
1 0.760 0.577 0.552 0.901921657
Pada tabel 2 menunjukkan bahwa koefisien determinasi atau adjusted R square meningkat sebesar 0,552 atau 55,2%. Hal ini menunjukkan bahwa board diversity (Bstudy) sebagai variabel moderasi dapat memperkuat hubungan antara perencanaan pajak terhadap nilai perusahaan dan hubungan profitabilitas terhadap nilai perusahaan. Sedangkan sisanya sebesar 44,8% dijelaskan atau dipengaruhi oleh faktor-faktor lain yang tidak diteliti.
Tabel 3. Uji Signifikansi Simultan (F)
Model Sum of Squares df Mean square F Sig
RegressionResidual
Total
93.21468.331
161.545
58489
18.6430.813 22.918 0.000
Tabel 3 menunjukkan nilai Sig sebesar 0,000 lebih kecil dari nilai Sig 0,05 (0,000 < 0,05) maka dapat disimpulkan bahwa secara bersama-sama (simultan) seluruh variabel independen berpangaruh secara signifikan terhadap variabel dependen. Dengan demikian model regresi ini dapat menjelaskan bahwa perencanaan pajak dan profitabilitas secara bersama-sama berpengaruh terhadap nilai perusahaan serta board diversity (Bstudy) dapat
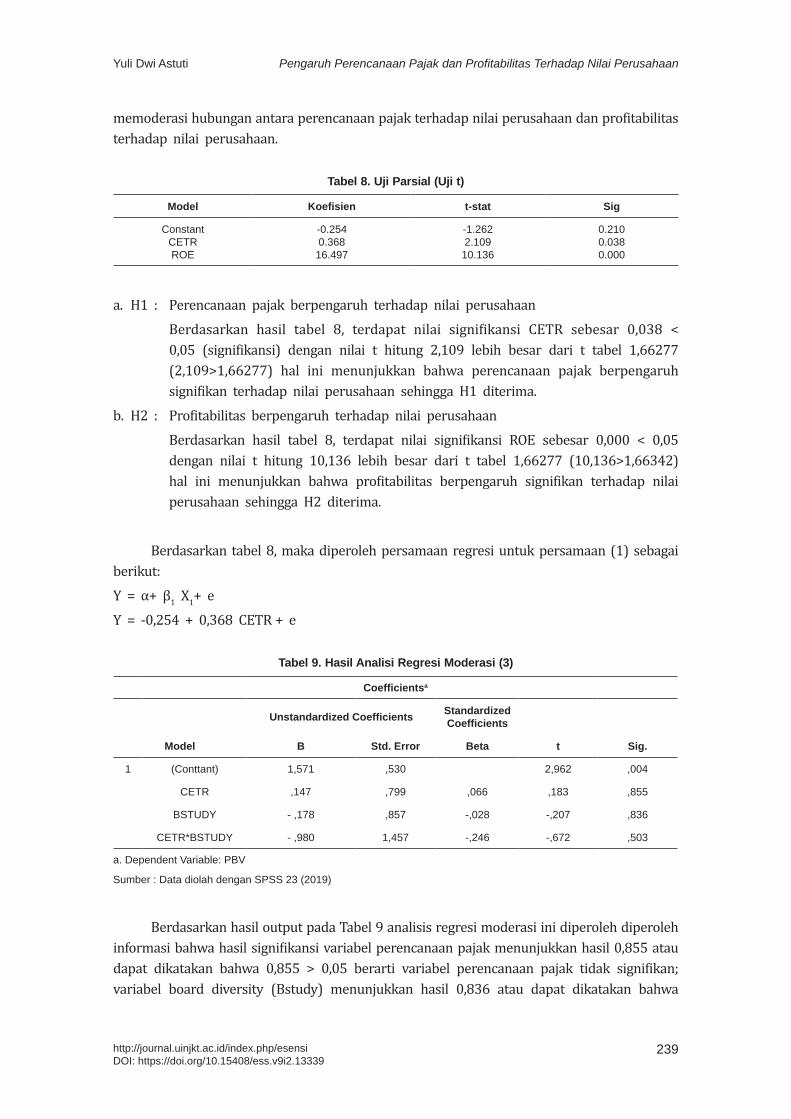
239
Pengaruh Perencanaan Pajak dan Profitabilitas Terhadap Nilai PerusahaanYuli Dwi Astuti
http://journal.uinjkt.ac.id/index.php/esensiDOI: https://doi.org/10.15408/ess.v9i2.13339
memoderasi hubungan antara perencanaan pajak terhadap nilai perusahaan dan profitabilitas terhadap nilai perusahaan.
Tabel 8. Uji Parsial (Uji t)
Model Koefisien t-stat Sig
ConstantCETRROE
-0.2540.368
16.497
-1.2622.109
10.136
0.2100.0380.000
a. H1 : Perencanaan pajak berpengaruh terhadap nilai perusahaan Berdasarkan hasil tabel 8, terdapat nilai signifikansi CETR sebesar 0,038 <
0,05 (signifikansi) dengan nilai t hitung 2,109 lebih besar dari t tabel 1,66277 (2,109>1,66277) hal ini menunjukkan bahwa perencanaan pajak berpengaruh signifikan terhadap nilai perusahaan sehingga H1 diterima.
b. H2 : Profitabilitas berpengaruh terhadap nilai perusahaan Berdasarkan hasil tabel 8, terdapat nilai signifikansi ROE sebesar 0,000 < 0,05
dengan nilai t hitung 10,136 lebih besar dari t tabel 1,66277 (10,136>1,66342) hal ini menunjukkan bahwa profitabilitas berpengaruh signifikan terhadap nilai perusahaan sehingga H2 diterima.
Berdasarkan tabel 8, maka diperoleh persamaan regresi untuk persamaan (1) sebagai berikut:Y = α+ β1 X1+ eY = -0,254 + 0,368 CETR + e
Tabel 9. Hasil Analisi Regresi Moderasi (3)
Coefficientsa
Model
Unstandardized Coefficients Standardized Coefficients
t Sig.B Std. Error Beta
1 (Conttant) 1,571 ,530 2,962 ,004
CETR ,147 ,799 ,066 ,183 ,855
BSTUDY - ,178 ,857 -,028 -,207 ,836
CETR*BSTUDY - ,980 1,457 -,246 -,672 ,503
a. Dependent Variable: PBV
Sumber : Data diolah dengan SPSS 23 (2019)
Berdasarkan hasil output pada Tabel 9 analisis regresi moderasi ini diperoleh diperoleh informasi bahwa hasil signifikansi variabel perencanaan pajak menunjukkan hasil 0,855 atau dapat dikatakan bahwa 0,855 > 0,05 berarti variabel perencanaan pajak tidak signifikan; variabel board diversity (Bstudy) menunjukkan hasil 0,836 atau dapat dikatakan bahwa

Vol. 9, No. 2, 2019Esensi: Jurnal Bisnis dan Manajemen
240 http://journal.uinjkt.ac.id/index.php/esensiDOI: https://doi.org/10.15408/ess.v9i2.13339
0,836 > 0,05 berarti variabel boars diversity (Bstudy) tidak signifikan; dan variabel interaksi antara perencanaan pajak dan board diversity (Bstudy) menunjukkan hasil 0,503 atau dapat dikatakan bahwa 0,503 > 0,05 berarti variabel interaksi perencanaan pajak dengan board diversity (Bstudy) tidak signifikan.
Hal ini membuktikan bahwa variabel moderasi (Bstudy) dan interaksi antara variabel perencanaan pajak dan board diversity (Bstudy) tidak memiliki pengaruh terhadap variabel dependen (nilai perusahaan) dengan tingkat signifikansi 0,503 lebih besar dari alpha yang telah ditetapkan yaitu 5% (0,05) berarti variabel moderasi board diversity (Bstudy) memperlemah hubungan perencanaan pajak dengan nilai perusahaan. Begitu juga dapat disumpulkan bahwa variabel Board diversity (Bstudy) merupakan variabel moderasi (Pure Moderator) dimana variabel Board diversity (Bstudy) tidak dapat memoderasi hubungan antara variabel independen dengan variabel dependen sehingga H3 ditolak.
Tabel 10. Hasil Analisi Regresi Moderasi (4)
Coefficientsa
Model
Unstandardized Coefficients Standardized Coefficients
t Sig.B Std. Error Beta
1 (Conttant) ,018 ,459 ,035 ,972
ROE 21,345 5,654 1,030 3,775 ,000
BSTUDY - ,048 ,775 -,008 -,063 ,950
ROE*BSTUDY - 9,854 8,796 -,332 -1,120 ,266
a. Dependent Variable: PBV
Sumber : Data diolah dengan SPSS 23 (2019)
H4 : Board diversity dapat memoderasi pengaruh profitabilitas terhadap nilai perusahaan.Berdasarkan hasil output pada tabel 11 analisis regresi moderasi ini diperoleh informasi
bahwa hasil signifikansi variabel profitabilitas menunjukkan hasil 0,000 atau dapat dikatakan bahwa 0,000 < 0,05 berarti variabel profitabilitas signifikan; variabel board diversity (Bstudy) menunjukkan hasil 0,950 atau dapat dikatakan bahwa 0,950 > 0,05 berarti variabel board diversity (Bstudy) tidak signifikan; dan variabel interaksi antara profitabilitas dan board diversity (Bstudy) menunjukkan hasil 0,266 atau dapat dikatakan bahwa 0,266 > 0,05 berarti variabel interaksi profitabilitas dengan board diversity (Bstudy) tidak signifikan.
Hal ini membuktikan bahwa variabel moderasi (Bstudy) dan interaksi antara variabel profitabilitas dan board diversity (Bstudy) tidak memiliki pengaruh terhadap variabel dependen (nilai perusahaan) dengan tingkat signifikansi 0,266 lebih besar dari alpha yang telah ditetapkan yaitu 5% (0,05) berarti variabel moderasi board diversity (Bstudy) memperlemah hubungan profitabilitas dengan nilai perusahaan. Begitu juga dapat disumpulkan bahwa variabel Board diversity (Bstudy) merupakan variabel moderasi (Pure Moderator) dimana variabel Board diversity (Bstudy) tidak dapat memoderasi hubungan antara variabel independen dengan variabel dependen sehingga H4 ditolak.
241
Pengaruh Perencanaan Pajak dan Profitabilitas Terhadap Nilai PerusahaanYuli Dwi Astuti
http://journal.uinjkt.ac.id/index.php/esensiDOI: https://doi.org/10.15408/ess.v9i2.13339
Pengaruh Perencanaan Pajak terhadap Nilai Perusahaan Berdasarkan hasil tabel 8 di atas dapat diketahui bahwa perencanaan pajak memiliki
nilai t hitung sebesar 2,109 dengan tingkat signifikansi sebesar 0,038 > 0,05. Hal ini menunjukkan bahwa variabel perencanaan pajak berpengaruh positif dan signifikan terhadap nilai perusahaan, dengan demikian H1 diterima.
Adanya hubungan positif antara perencanaan pajak terhadap nilai perusahaan dikarenakan jumlah kas yang dibayarkan perusahaan untuk membayar kewajiban perpajakannya lebih rendah dari pajak penghasilan badan yang berlaku sehingga laba setelah pajak yang diperoleh perusahaan akan tinggi dan hal tersebut akan berdampak pada peningkatan nilai perusahaan. Perencanaan pajak yang dilakukan oleh manajemen diperuntukkan untuk meningkatkan kesejahteraan pemegang saham, karena nilai perusahaan akan meningkat jika perusahaan memperhatikan kepuasan dan kemakmuran pemegang saham.
Hasil penelitian ini sesuai dengan hasil penelitian yang dilakukan oleh Lestari (2014), Lestari dan Wardhani (2015), Marsaid dan Pesudo (2019) yang menyatakan bahwa perencanaan pajak berpengaruh positif dan signifikan terhadap nilai perusahaan. Namun, hasil penelitian ini tidak sesuai dengan penelitian yang dilakukan oleh Kartini dan Apriwenni (2017), Yuliem (2018), Ayem dan Tia (2019) menyatakan bahwa perencanaan pajak tidak berpengaruh terhadap nilai perusahaan, hal tersebut kemungkinan disebabkan karena adanya perbedaan dalam periode maupun sampel penelitian yang dilakukan oleh setiap penulis.
Pengaruh Profitabilitas terhadap nilai perusahaanBerdasarkan hasil tabel 8 di atas dapat diketahui bahwa profitabilitas memiliki nilai t
hitung sebesar 10,136 dengan tingkat signifikansi sebesar 0,000 > 0,05. Hal ini menunjukkan bahwa variabel profitabilitas berpengaruh positif dan signifikan terhadap nilai perusahaan, dengan demikian H2 diterima.
Sebagian investor cenderung menilai perusahaan melalui laba yang dihasilkan oleh perusahaan, berdasarkan hal itu, ketika profitabilitas perusahaan meningkat maka akan direspon positif oleh investor sehingga nilai perusahaan juga akan meningkat. Hal ini sesuai dengan konsep dari signalling theory yang mengatakan bahwa profitabilitas suatu perusahaan akan menjadi sinyal dari manajemen yang menggambarkan prospek perusahaan.
Hasil penelitian ini sesuai dengan hasil penelitian yang dilakukan oleh Suwardika dan Mustanda (2017), Kusumawati dan Rosady (2018), Musabbihan dan Purnawati (2018) menyatakan bahwa profitabilitas berpengaruh signifikan positif terhadap nilai perusahaan. Namun, hasil penelitian ini tidak sesuai dengan penelitian yang dilakukan oleh Ustiani (2015), Ratih dan Damayanthi (2016), Kusumayanti dan Astika (2016) menyatakan bahwa profitabilitas tidak berpengaruh terhadap nilai perusahaan hal tersebut kemungkinan disebabkan adanya perbedaan dalam periode maupun sampel penelitian yang dilakukan oleh setiap penulis.
Board diversity dapat memoderasi pengaruh perencanaan pajak terhadap nilai perusahaan
Berdasarkan tabel 10 di atas dapat diketahui bahwa perencanaan pajak yang dimoderasi oleh board diversity (bstudy) memiliki nilai t hitung sebesar -0,672. Nilai variabel interaksi
Vol. 9, No. 2, 2019Esensi: Jurnal Bisnis dan Manajemen
242 http://journal.uinjkt.ac.id/index.php/esensiDOI: https://doi.org/10.15408/ess.v9i2.13339
antara perencanaan pajak dan board diversity (Bstudy) menunjukkan hasil 0,503 atau dapat dikatakan bahwa 0,503 > 0,05 (tidak signifikan) maka variabel moderasi board diversity (Bstudy) tidak mampu memperkuat hubungan perencanaan pajak terhadap nilai perusahaan, sehingga board diversity bukan merupakan variabel moderasi sehingga H3 ditolak.
Nilai t dalam penelitian ini minus menandakan arah hubungan negatif, artinya semakin besar porposi dewan direksi dengan latar belakang pendidikan ekonomi dan bisnis maka nilai perusahaan akan semakin rendah.
Hal ini disebabkan perusahaan property dan real estate sebagai sampel penelitian di dominasi oleh dewan direksi berlatar belakang pendidikan teknik dan arsitektur dibandingkan dewan direksi berlatar belakang pendidikan ekonomi dan bisnis. Selain itu, dalam menjalankan perusahaan tentunya diperlukan soft skill yang sesuai dengan bidang perusahaan di luar hard skill yang diperoleh pada bangku pendidikan.
Hasil penelitian ini sesuai dengan hasil penelitian yang dilakukan oleh Astuti (2017), Kristina dan Wiratmaja (2018) menyatakan bahwa board diversity (BSTUDY) tidak berpengaruh terhadap nilai perusahaan. Namun, hasil penelitian ini tidak sejalan dengan penelitian Lestasri dan Wardhani (2015) menyatakan Board diversity (Bstudy) dapat memoderasi hubungan antara tax planning dan nilai perusahaan secara konsisten, Lestari dan Sinarti (2016) menyatakan bahwa board diversity (BSTUDY) berpengaruh negatif terhadap nilai perusahaan, sedangkan Dewi dan Dewi (2016), Khairani dan Harahap (2017) menyatakan bahwa board diversity (BSTUDY) berpengaruh signifikan positif terhadap nilai perusahaan, hal tersebut kemungkinan disebabkan adanya perbedaan dalam periode maupun sampel penelitian yang dilakukan oleh setiap penulis.
Board diversity dapat memoderasi pengaruh profitabilitas terhadap nilai perusahaanBerdasarkan Tabel 10 dapat diketahui bahwa profitabilitas yang dimoderasi oleh board
diversity (bstudy) memiliki nilai t hitung sebesar -1,120. Nilai variabel interaksi antara profitabiltas dan board diversity (Bstudy) menunjukkan hasil 0,266 atau dapat dikatakan bahwa 0,266 > 0,05 (tidak signifikan) maka variabel moderasi board diversity (Bstudy) tidak mampu memperkuat hubungan profitabilitas terhadap nilai perusahaan, sehingga board diversity bukan merupakan variabel moderasi sehingga H4 ditolak.
Hal ini dapat dikarenakan bawah pendidikan dewan direksi yang tidak sesuai dengan kedudukan yang diduduki sekarang sebagai dewan direksi, dan ada beberapa dewan direksi yang tidak mempunyai pendidikan formal melainkan hanya kursus, sedangkan penelitian ini hanya mendefinisikan latar belakang pendidikan secara spesifik pada ekonomi dan bisnis.
Hasil penelitian ini sesuai dengan hasil penelitian yang dilakukan oleh Astuti (2017), Kristina dan Wiratmaja (2018) menyatakan bahwa board diversity (BSTUDY) tidak berpengaruh terhadap nilai perusahaan. Namun, hasil penelitian ini tidak sejalan dengan Lestari dan Sinarti (2016) menyatakan bahwa board diversity (BSTUDY) berpengaruh negatif terhadap nilai perusahaan, sedangkan Dewi dan Dewi (2016), Khairani dan Harahap (2017) menyatakan bahwa board diversity (BSTUDY) berpengaruh signifikan positif terhadap nilai perusahaan hal tersebut kemungkinan disebabkan adanya perbedaan dalam periode maupun sampel penelitian yang dilakukan oleh setiap penulis.
243
Pengaruh Perencanaan Pajak dan Profitabilitas Terhadap Nilai PerusahaanYuli Dwi Astuti
http://journal.uinjkt.ac.id/index.php/esensiDOI: https://doi.org/10.15408/ess.v9i2.13339
SIMPULANPerencanaan pajak berpengaruh positif signifikan terhadap nilai perusahaan. Adanya
hubungan positif antara perencanaan pajak terhadap nilai perusahaan dikarenakan jumlah kas yang dibayarkan perusahaan untuk membayar kewajiban perpajakannya lebih rendah dari pajak penghasilan badan yang berlaku sehingga laba setelah pajak yang diperoleh perusahaan akan tinggi dan hal tersebut akan berdampak pada peningkatan nilai perusahaan. Perencanaan pajak yang dilakukan oleh manajemen diperuntukkan untuk meningkatkan kesejahteraan pemegang saham, karena nilai perusahaan akan meningkat jika perusahaan memperhatikan kepuasan dan kemakmuran pemegang saham.
Profitabilitas berpengaruh positif signifikan terhadap nilai perusahaan. Sebagian investor cenderung menilai perusahaan melalui laba yang dihasilkan oleh perusahaan, berdasarkan hal itu, ketika profitabilitas perusahaan meningkat maka akan direspon positif oleh investor sehingga nilai perusahaan juga akan meningkat.
BOD diversity memperlemah hubungan antara perencanaan pajak dengan nilai perusahaan. selain itu, BOD juga memperlemah hubungan antara profitabilitas dengan nilai perusahaan. Hal ini disebabkan perusahaan property dan real estate sebagai sampel penelitian di dominasi oleh dewan direksi berlatar belakang pendidikan teknik dan arsitektur dibandingkan dewan direksi berlatar belakang pendidikan ekonomi dan bisnis. Selain itu, dalam menjalankan perusahaan tentunya diperlukan soft skill yang sesuai dengan bidang perusahaan di luar hard skill yang diperoleh pada bangku pendidikan.
PUSTAKA ACUANAldea, M. C. (2017). The Effect of Leverage, Profitability, Information Asymmetry, Firm Size on
Cash Holding and Firm Value of Manufacturing Firms Listed at Indonesian Stock Exchang. International Journal of Research in Business Studies and Management, Vol. 4(4). PP 21-31.
Agus, Mustanda. (2017). “Pengaruh Leverage, Ukuran Perusahaan, Pertumbuhan Perusahaan dan Profitabilitas Terhadap Nilai Perusahaan pada Perusahaan Properti”. E-Jurnal Manajemen Unud, Vol. 6, No. 3, 2017: 1248-1277.
Astuti, E. P. (2017). Pengaruh Diversitas Dewan Direksi Terhadap Nilai Perusahaan Pada Perusahaan Manufaktur Yang Terdaftar Di Bursa Efek Indonesia Periode 2008-2011. Kreatif: Jurnal Ilmiah Prodi Manajemen Universitas Pamulang, 4(2).
Ayem, S., & Tia, I. (2019). Pengaruh Perencanaan Pajak, Kebijakan Dividen Dan Kepemilikan Institusional Terhadap Nilai Perusahaan (Studi Kasus Perusahaan LQ45 Yang Tercatat Dalam Bursa Efek Indonesia) Periode 2012-2016. Jurnal Akuntansi Pajak Dewantara, 1(2).
Ayu, D. P., & Suarjaya, A. A. G. (2017). Pengaruh Profitabilitas Terhadap Nilai Perusahaan Dengan Corporate Social Responsibility Sebagai Variabel Mediasi Pada Perusahaan Pertambangan. E-Jurnal Manajemen, 6(2), 1112-1138.
Bursa Efek Indonesia. (2016). Laporan Keuangan & Tahunan. www.idx.co.id. Diakses pada hari Jumat, 21 Juni 2019 jam 16:49 WIB.
Cecilia, R. S., & Torong, M. B. (2015). Analisis Pengaruh Corporate Social Responsibility, Profitabilitas Dan Ukuran Perusahaan Terhadap Nilai Perusahaan Pada Perusahaan

Vol. 9, No. 2, 2019Esensi: Jurnal Bisnis dan Manajemen
244 http://journal.uinjkt.ac.id/index.php/esensiDOI: https://doi.org/10.15408/ess.v9i2.13339
Perkebunan Yang Go Public Di Indonesia, Malaysia, Dan Singapura. Simposium Nasional Akuntansi, 18, 1-22.
Desiana, F., & Hartini, T. (2014). Pengaruh Return On Equity, Earling Per Share Dan Price Earning Ratio Terhadap Return Saham Perusahaan Industri Barang Konsumsi Di Bursa Efek Indonesia.
Dewanata, P., & Achmad, T. (2017). Pengaruh Perencanaan Pajak Terhadap Nilai Perusahaan Dengan Kualitas Corporate Governance Sebagai Variabel Moderasi (Studi Empiris Pada Perusahaan Manufaktur Yang Terdaftar Di BEI Pada Tahun 2012-2014). Diponegoro Journal of Accounting, 6(1), 1-7.
Dewi, Dini. (2015). “Pengaruh Profitabilitas dan Ukuran Perusahaan Terhadap Nilai Perusahaan”. Jurnal Ilmu & Riset Akuntansi Vol. 4 No. 4 (2015).
Dewi, G. K., & Dewi, A. A. (2016). Pengaruh Diversitas Dewan Komisaris Dan Direksi Pada Nilai Perusahaan Pada Perusahaan Sektor Keuangan Yang Terdaftar Di Bursa Efek Indonesia Tahun 2009-2013. E-Jurnal Akuntansi, 16(1), 812-836.
Ghozali, Imam. (2018). Aplikasi Analisis Multivariate dengan Program IBM SPSS 25. Semarang: Badan Penerbit Universitas Diponegoro.
Grandy, Tommy dan Victori. (2016). “Pengaruh Profitabilitas, Keputusan Investasi dan Keputusan Pendanaan Terhadap Nilai Perusahaan Farmasi yang Terdaftar di BEI Periode 2011-2014”. Jurnal Berkala Ilmiah Efisiensi, Volume 16 No. 04 Tahun 2016.
Hakim, L., & Priantinah, D. (2018). Faktor – Faktor Yang Mempengaruhi Nilai Perusahaan Pada Perusahaan Manufaktur Yang Terdaftar Di Bursa Efek Indonesia. Jurnal Profita: Kajian Ilmu Akuntansi, 6(8).
Hidayat, M., & Hairi, M. I. A. (2016). Pengaruh Perencanaan Pajak Dan Modal Intelektual Terhadap Nilai Perusahaan Pada Perusahaan Jasa Keuangan Yang Terdaftar Di Bursa Efek Indonesia Periode 2009-2013. Jurnal Ekonomi Global Masa Kini, 7(2).
Isabella, Satia. (2017). “Pengaruh Pertumbuhan Perusahaan, Struktur Modal, dan Profitabilitas Terhadap Nilai Perusahaan”. Jurnal Riset Akuntansi dan Bisnis Airlangga Vol. 2. No. 1(2017) 135-148.
Kartini, R. D., & Apriwenni, P. (2017). Dampak Perencanaan Pajak, Kebijakan Hutang Dan Kebijakan Dividen Terhadap Nilai Perusahaan. Jurnal Akuntansi, 6(1).
Khairani, N., & Harahap, D. Y. (2017). Firms Value: Form The Board Diversity And Board Compensation Perspective. Jurnal Riset Akuntansi dan Keuangan. 5(3), 1551-1564.
Kristina, I. G. A. R., & Wiratmaja, I. D. N. (2018). Pengaruh Board Diversity Dan Intellectual Capital Pada Nilai Perusahaan. E-Jurnal Akuntansi, 22(3), 2313-2338.
Kusumastuti, S., Supatmi., & Sastra, P. (2007). Pengaruh Board Diversity Terhadap Nilai Perusahaan Dalam Perspektif Corporate Governance. Jurnal Akuntansi dan Keuangan, 9(2), 88-98.
Kusumawati, R., & Rosady, I. (2018). Pengaruh Struktur Modal Dan Profitabilitas Terhadap Nilai Perusahaan Dengan Kepemilikan Manajerial Sebagai Variabel Moderasi. Jurnal Manajemen Bisnis, 9(2), 147-160.
Kusumayani, H. A., & Suardana, K.A. (2017). Kepemilikan Manajerial Dan Kepemilikan
245
Pengaruh Perencanaan Pajak dan Profitabilitas Terhadap Nilai PerusahaanYuli Dwi Astuti
http://journal.uinjkt.ac.id/index.php/esensiDOI: https://doi.org/10.15408/ess.v9i2.13339
Institusional Sebagai Pemoderasi Pengaruh Perencanaan Pajak Pada Nilai Perusahaan. E-Jurnal Akuntansi, 18(1) 646-673.
Kusumayanti, N. K. R., & Astika, I. B. P. (2016). Corporate Social Responsibility Sebagai Pemediasi Pengaruh Ukuran Perusahaan, Profitabilitas Dan Leverage Pada Nilai Perusahaan. E-Jurnal Akuntansi, 15(1), 549-583.
Lestari, N. (2014). Pengaruh Tax Planning Terhadap Nilai Perusahaan. Akuntabilitas, 7(1), 69-83.
Lestari, N., & Sinarti. (2016). Pengaruh Earnings Management Dan Board Diversity Terhadap Nilai Perusahaan. National Conference of Applied Engineering, Business and Information Technology, Politeknik Negeri Padang (pp. 245-257).
Lestasi, N., & Wardhani, R. (2015). The Effect Of The Tax Planning To Firm Value With Moderating Board Diversity. International Journal of Economics and Financial Issues, 5, 315-323.
Leonardus, Bonar dan Hendro. (2017). “Pengaruh Profitabilitas, Struktur Modal dan Likuiditas Terhadap Nilai Perusahaan”. Jurnal Aplikasi Bisnis dan Manajemen, Vol. 3 No. 3, September 2017.
Lumoly, S., Murni, S., & Untu, V. N. (2018). Pengaruh Likuiditas, Ukuran Perusahaan Dan Profitabilias Terhadap Nilai Perusahaan (Studi Pada Perusahaan Logam Dan Sejenisnya Yang Terdaftar Di Bursa Efek Indonesia). Jurnal EMBA: Jurnal Riset Ekonomi, Manajemen, Bisnis dan Akuntansi, 6(3).
Marsaid, M. T., & Pesudo, D. A. (2019). Pengaruh Tax Planning Terhadap Nilai Perusahaan. Jurnal Bingkai Ekonomi, 4(2), 11-24.
Milliken, F. J., & Martins, L. L. (1996). Searching For Common Threads: Understanding The Multiple Effects of Diversity in Organizational Groups. Academy Of Management Review, 21(2), 402-433.
Musabbihan, N. A., & Purnawati, N. K. (2018). Pengaruh Profitabilitas Dan Kebijakan Dividen Terhadap Nilai Perusahaan Dengan Struktur Modal Sebagai Pemediasi. E-Jurnal Manajemen, 7(4), 1979-2009.
Novarianto, A., & Dwimulyani, S. (2019). Pengaruh Penghindaran Pajak, Leverage, Profitabilitas Terhadap Nilai Perusahaan Dengan Transparansi Perusahaan Sebagai Variabel Moderasi. In Prosiding Seminar Nasional Pakar (pp. 2-43).
Prandyana, I. B. G. P., & Noviari, N. (2017). Pengaruh Perencanaan Pajak Terhadap Nilai Perusahaan Dengan Transparansi Perusahaan Sebagai Variabel Moderasi. E-Jurnal Akuntansi, 1398-1426.
Purwohandoko. (2017). The Influence of Firm’s Size, Growth, and Profitability on Firm Value with Capital Structure as the Mediator: A Study on the Agricultural Firms Listed in the Indonesian Stock Exchange. International Journal of Economic and Finance. Vol. 9. No. 8, 103-110.
Ratih, I. D. A., & Damayanthi, I. G. A. E. (2016). Kepemilikan Manajerial Dan Profitabilitas Pada Nilai Perusahaan Dengan Pengungkapan Tanggungjawab Sosial Sebagai Variabel Pemoderasi. E-Jurnal Akuntansi, 14(2), 1510-1538.
Vol. 9, No. 2, 2019Esensi: Jurnal Bisnis dan Manajemen
246 http://journal.uinjkt.ac.id/index.php/esensiDOI: https://doi.org/10.15408/ess.v9i2.13339
Suwardika, I. N. A., & Mustanda, I. K. (2017). Pengaruh Leverage, Ukuran Perusahaan, Pertumbuhan Perusahaan, Dan Profitabilitas Terhadap Nilai Perusahaan Pada Perusahaan Properti. E-Jurnal Manajemen, 6(3), 1248-1277.
Ustiani, N. (2015). Pengaruh Struktur Modal, Kepemilikan Manajerial, Keputusan Investasi, Kebijakan Dividen, Keputusan Pendanaan Dan Profitabilitas Terhadap Nilai Perusahaan (Studi Pada Perusahaan Keuangan Dan Perbankan Di BEI Tahun 2009-2013). Journal Of Accounting, 1(1).
Yuanita, Missy., & Slamet, R. (2016). Infuence of capital structure, size and growth on profitability and corporate value. International Journal of Business and Finance Management Research. IJBFMR 4, 80-101.
Yuliem, M. L. (2018). Pengaruh Perencanaan Pajak (Tax Planning) Terhadap Nilai Perusahaan (Firm Value) Pada Perusahaan Sektor Non Keuangan Yang Terdaftar Di BEI Periode 2013-2015. Calyptra, 7(1), 520-540.
Yuono, C. A. S., & Widyawati, D. (2016). Pengaruh Perencanaan Pajak Dan Corporate Governance Terhadap Nilai Perusahaan. Jurnal Ilmu dan Riset Akuntansi, 5(6), 1-19.

INDEKSASI
Esensi: Jurnal Bisnis dan Manajemen telah tercakup (indeksing dan abstrak) pada lembaga pengindeks berikut:• Directory of Open Access Journal (DOAJ)• CrossRef• Goggle Scholar• SINTA• Dimensions• Portal Garuda• Indonesian Scientific Journal Database (ISJD)• Moraref• Indonesia OneSearch• Bielefiedl Academic Search Engine (BASE)• Open Archive Initiative (OAI)• Open Access Library• Academic Keys
Pernyataan Pengalihan Hak Cipta
Nama Penulis Utama: ………………………………………………………………………………………………………………………………………Alamat Penulis: ………………………………………………………………………………………………………………………………………………………………………………………………………………………………………………………………………………………………………………………………………………………………………………………………Tel/Fax: …………………………………………………………………………………………………………………………E-mail: …………………………………………………………………………………………………………………………..Nama Penulis: ………………………………………………………………………………………………………………..Judul Artikel: ………………………………………………………………………………………………………………………………………………………………………………………………………………………………………………………………………………
1. Kami mengirimkan artikel pada Esensi: Jurnal Bisnis dan Manajemen, kami memastikan bahwa artikel yang kami kirimkan belum pernah dipublikasikan sebelumnya atau sedang dalam proses penelahaan pada jurnal lain atau mengandung materi yang melanggar hak cipta kepada orang atau entitas lain.
2. Kami menyetujui untuk mengalihkan hak cipta kepada Esensi: Jurnal Bisnis dan Manajemen sebagai penerbit artikel ini dengan judul artikel yang tersebut di atas.
Demikian pernyataan ini kami buat, apabila ada terjadi pelanggaran hak cipta terkait artikel ini, maka kami siap untuk menerima sanksi sesuai prosedur yang berlaku.
Tanggal:………………………………Tanda Tangan
………………………….......................(jika ada lebih dari satu penulis, cukup penulis pertama yang menandatangani)
PETUNJUK PENULISAN NASKAHBERKALA ILMIAH ESENSI
1. Tulisan merupakan karya orisinal penulis (bukan plagiasi) dan belum pernah dipublikasikan atau sedang dalam proses publikasi pada media lain yang dinyatakan dengan surat pernyataan yang ditandatangani di atas meterai Rp 6000;
2. Naskah berupa hasil penelitian;3. Naskah dapat berbahasa Indonesia dan Inggris;4. Naskah harus memuat informasi keilmuan dalam bidang ekonomi, manajemen, bisnis,
dan keuangan;5. Aturan penulisan adalah sebagai berikut:
a. Judul. Ditulis dengan huruf kapital, maksimum 12 kata diposisikan di tengah (centered);
b. Nama penulis. Ditulis utuh, tanpa gelar, disertai afiliasi kelembagaan dan email;c. Abstrak. Ditulis dalam bahasa Indonesia dan bahasa Inggris antara 100- 150 kata;d. Sistematika penulisan
1) Judul;2) Nama penulis (tanpa gelar akademik), nama dan alamat afiliasi kelembagaan
penulis, dan e-mail;3) Abstrak ditulis dalam dua bahasa, yaitu bahasa Indonesia dan bahasa Inggris,
antara 100-150 kata;
4) Kata kunci, antara 2-5 konsep;5) Pendahuluan: berisi latar belakang;6) Metode;7) Pembahasan;8) Simpulan; 9) Pustaka acuan (hanya untuk sumber-sumber yang dirujuk).
e. Ukuran kertas yang digunakan adalah kertas HVS 70 gram, ukuran A4, margin: atas 3 cm, bawah 2.5 cm, kiri 3 cm, dan kanan 2.5 cm;
f. Panjang Naskah antara 15 s.d. 20 halaman, spasi 1, huruf Cambria, ukuran 12; g. Pengutipan Kalimat: kutipan kalimat ditulis secara langsung apabila lebih dari empat
baris dipisahkan dari teks dengan jarak satu spasi. Sedangkan kutipan kurang dari empat baris diintegrasikan dalam teks, dengan tanda apostrof ganda di awal dan di akhir kutipan. Setiap kutipan diberi nomor. Sistem pengutipan adalah bodynote; Penulisan bodynote ialah nama belakang penulis dan tahun.
Contoh: Al Arif (2010)h. Pustaka Acuan: daftar pustaka acuan ditulis sesuai urutan abjad, nama akhir penulis
diletakkan di depan. Contoh:1) Buku, contoh:
Al Arif, M. N. R. (2015). Pengantar Ekonomi Syariah. Bandung: Pustaka SetiaAl Arif, M.N.R & E. Amalia. (2010). Teori Mikroekonomi: Suatu Perbandingan
Ekonomi Islam dan Ekonomi Konvensional. Jakarta: Kencana.Amalia, E, dkk. (2012). Potret Pendidikan Ekonomi Islam di Indonesia. Jakarta:
Penerbit Gramata2) Jurnal, contoh:
Al Arif, M. N. R. (2014). Tipe Pemisahan dan Pengaruhnya Terhadap Nilai Aset Bank Umum Syariah Hasil Pemisahan. Kinerja, Vol. 18, No. 2: 168-179.
Al Arif, M.N.R. & T. Nurasiah. (2015). Customer Relationship Management dan Pengaruhnya Terhadap Loyalitas Nasabah Bank: Studi Pada Bank Muamalat Indonesia. Esensi: Jurnal Bisnis dan Manajemen, Vol. 5, No. 1: 51-64
i. Simpulan: artikel ditutup dengan kesimpulan;j. Biografi singkat: biografi penulis mengandung unsur nama (lengkap dengan gelar
akademik), tempat tugas, riwayat pendidikan formal (S1, S2, S3), dan bidang keahlian akademik;
k. Penggunaan bahasa Indonesia. Para penulis harus merujuk kepada ketentuan bahasa Indonesia yang baik dan benar berdasarkan EYD, antara lain:1) Penulisan huruf kapital
a) Huruf kapital atau huruf besar dipakai sebagai huruf pertama kata pada awal kalimat;
b) Huruf kapital dipakai sebagai huruf pertama petikan langsung;
c) Huruf kapital dipakai sebagai huruf pertama ungkapan yang berhubungan dengan nama Tuhan dan nama kitab suci, termasuk ganti untuk Tuhan;
d) Huruf kapital dipakai sebagai huruf pertama unsur nama gelar kehormatan, keturunan, dan keagamaan yang diikuti nama orang;
e) Huruf kapital dipakai sebagai huruf pertama unsur nama jabatan dan pangkat yang diikuti nama orang atau yang dipakai sebagai pengganti nama orang, nama instansi, atau nama tempat;
f) Huruf kapital dipakai sebagai huruf pertama unsur-unsur nama orang;g) Huruf kapital dipakai sebagai huruf pertama nama bangsa, suku bangsa-
bangsa dan bahasa. Perlu diingat, posisi tengah kalimat, yang dituliskan dengan huruf kapital hanya huruf pertama nama bangsa, nama suku, dan nama bahasa; sedangkan huruf pertama kata bangsa, suku, dan bahasa ditulis dengan huruf kecil;
h) Huruf kapital dipakai sebagai huruf pertama nama tahun, bulan, hari, hari raya, dan peristiwa sejarah;
i) Huruf kapital dipakai sebagai huruf pertama nama khas dalam geografi;j) Huruf kapital dipakai sebagai huruf pertama semua unsur nama negara,
nama resmi badan/lembaga pemerintah dan ketatanegaraan, badan, serta nama dokumen resmi;
k) Huruf kapital dipakai sebagai huruf kapital setiap unsur bentuk ulang sempurna yang terdapat pada nama badan/lembaga;
l) Huruf kapital dipakai sebagai huruf pertama semua kata (termasuk semua unsur kata ulang sempurna) dalam penulisan nama buku, majalah, surat kabar, dan judul karangan, kecuali kata seperti di, ke, dari, dan, dalam, yang, untuk yang tidak terletak pada posisi awal;
m) Huruf kapital tidak dipakai sebagai huruf pertama kata penunjuk hubungan kekerabatan yang dipakai dalam penyapaan;
n) Huruf kapital dipakai sebagai huruf pertama unsur singkatan nama gelar, pangkat, dan sapaan;
o) Huruf kapital dipakai sebagai huruf pertama kata ganti Anda. 2) Penulisan tanda baca titik (.)
a) Tanda titik dipakai pada akhir kalimat yang bukan pertanyaan atau seruan. Tanda titik dipakai di belakang angka atau huruf pengkodean suatu judul bab dan subbab;
b) Tanda titik dipakai untuk memisahkan angka, jam, menit, dan detik yang menunjukan waktu dan jangka waktu;
c) Tanda titik tidak dipakai untuk memisahkan bilangan ribuan atau kelipatannya yang tidak menunjukkan jumlah;
d) Tanda titik dipakai di antara nama penulis, judul tulisan yang tidak berakhir dengan tanda tanya dan tanda seru, dan tempat terbit dalam daftar pustaka;

e) Tanda titik dipakai untuk memisahkan bilangan ribuan atau kelipatannya;f) Tanda titik tidak dipakai pada akhir judul, misalnya judul buku, karangan
lain, kepala ilustrasi, atau tabel;g) Tanda titik tidak dipakai di belakang (1) alamat pengirim atau tanggal
surat atau (2) nama dan alamat penerima surat.3) Penulisan tanda koma (,)
a) Tanda koma dipaki di antara unsur-unsur dalam suatu perincian atau pembilangan;
b) Tanda koma dipakai untuk memisahkan kalimat setara yang satu dari kalimat setara berikutnya yang didahului oleh kata seperti tetapi atau melainkan;
c) Tanda koma dipakai untuk memisahkan anak kalimat dari induk kalimat jika anak kalimat itu mendahului induk kalimatnya;
d) Tanda koma harus dipakai di belakang kata atau ungkapan penghubung antarkalimat yang terdapat pada awal kalimat, seperti oleh karena itu, jadi, lagi pula, meskipun begitu, akan tetapi;
e) Tanda koma dipakai untuk memisahkan kata seperti o, ya, wah, aduh, kasihan dari kata yang lain yang terdapat di dalam kalimat;
f) Tanda koma dipakai untuk memisahkan petikan langsung dari bagian lain dalam kalimat;
g) Tanda koma dipakai di antara bagian-bagian dalam catatan kaki;h) Tanda koma dipakai di antara orang dan gelar akademik yang mengikutinya
untuk membedakannya dari singkatan nama diri, keluarga, atau marga;i) Tanda koma dipakai untuk mengapit keterangan tambahan yang sifatnya
tidak membatasi;j) Tanda koma dipakai untuk menghindari salah baca di belakang keterangan
yang terdapat pada awal kalimat;k) Tanda koma tidak dipakai untuk memisahkan petikan langsung dari bagian
lain yang mengiringinya dalam kalimat jika petikan langsung itu berakhir dengan tanda tanya atau tanda seru.
4) Tanda titik koma (;)a) Tanda titik koma untuk memisahkan bagian-bagian kalimat yang sejenis
dan setara;b) Tanda titik koma dipakai sebagai pengganti kata penghubung untuk
memisahkan kalimat yang setara di dalam kalimat majemuk;c) Tanda titik koma dipakai untuk memisahkan unsur-unsur dalam kalimat
kompleks yang tidak cukup dipisahkan dengan tanda koma demi memperjelas arti kalimat secara keseluruhan.
5) Penulisan huruf miringa) Huruf miring dalam cetakan dipakai untuk menuliskan nama buku, majalah,
dan surat kabar yang dikutip dalam karangan;
b) Huruf miring dalam cetakan dipakai untuk menegaskan atau mengkhususkan huruf, bagian kata, atau kelompok kata;
c) Huruf miring dalam cetakan dipakai untuk menuliskan kata ilmiah atau ungkapan asing, kecuali yang sudah disesuaikan ejaannya.
6) Penulisan kata dasarKata yang berupa kata dasar ditulis sebagai satu kesatuan.
7) Penulisan kata turunan a) Imbuhan (awalan, sisipan, akhiran) ditulis serangkai dengan kata dasarnya; b) Jika bentuk dasar berupa gabungan kata, awalan, atau akhiran ditulis
serangkai dengan kata yang langsung mengikuti atau mendahuluinya;c) Jika bentuk dasar yang berupa gabungan kata mendapat awalan dan akhiran
sekaligus, unsur gabungan kata itu ditulis serangkai.8) Bentuk ulang
Bentuk ulang ditulis secara lengkap dengan menggunakan tanda hubung.9) Gabungan Kata
a) Gabungan kata yang lazim disebutkan kata majemuk, termasuk istilah khusus, unsur-unsurnya ditulis terpisah;
b) Gabungan kata, termasuk istilah khusus, yang mungkin menimbulkan salah pengertian dapat ditulis dengan tanda hubung untuk menegaskan pertalian unsur yang berkaitan;
c) Gabungan kata berikut ditulis serangkai karena hubungannya sudah sangat padu sehingga tidak dirasakan lagi sebagai dua kata;
d) Jika salah satu unsur gabungan kata hanya dipakai dalam kombinasi, gabungan kata itu ditulis serangkai.
10) Kata ganti ku, kau, mu, dan nya
Kata ganti ku dan kau sebagai bentuk singkat kata aku dan engkau, ditulis serangkai dengan kata yang mengikutinya.
11) Kata depan di, ke, dan dari
Kata depan di, ke, dan dari ditulis terpisah dari kata yang mengikutinya, kecuali di dalam gabungan kata yang sudah dianggap kata yang sudah dianggap sebagai satu kata seperti kepada dan daripada.
12) Kata sandang si dan sang
Kata si dan sang ditulis terpisah dari kata yang mengikutinya.13) Penulisan partikel
a) Partikel –lah dan –kah ditulis serangkai dengan kata yang mendahuluinya;b) Partikel pun ditulis terpisah dari kata yang mendahuluinya;c) Partikel per yang berarti (demi), dan (tiap) ditulis terpisah dari bagian
kalimat yang mendahului atau mengikutinya.

6. Setiap naskah yang tidak mengindahkan pedoman penulisan ini akan dikembalikan kepada penulisnya untuk diperbaiki.
7. Naskah sudah diserahkan kepada penyunting, selambat-lambatnya empat bulan sebelum waktu penerbitan. Artikel dapat dikirimkan melalui email di [email protected] atau melalui online submission: http://journal.uinjkt.ac.id/index.php/esensi/user/register.