universitas kristen satya wacana - konsentrasi manajemen...
TRANSCRIPT
• S1 - Sarjana Ekonomi Universitas Kristen Satya
Wacana - Konsentrasi Manajemen Keuangan
• S2 - Magister Manajemen Universitas Kristen Satya
Wacana - Konsentrasi Manajemen Keuangan (Lulusan
Terbaik - IPK Tertinggi)
• S3 – Doktor Ilmu Manajemen Universitas Katolik
Whidya Mandala - Konsentrasi Manajemen Keuangan
(Lulusan Terbaik - IPK Tertinggi)
• PT. Russley Future- 2006-2007: Analyst Capital Market- 2006-2007: Analyst Foreign Exchange
• Universitas Ciputra- 2007-2012: Koordinator Galeri Investasi Universitas
Ciputra- 2009-2013: Koordinator Peneltian Program Studi
Internasional Business Management Universitas Ciputra- 2007-Now: Fasilitator Entrepreneurial Project Universitas
Ciputra- 2007-Now: Pengajar Program Studi International Business
Management Universitas Ciputra- 2014-Now: Pengajar Program Pascasarjana Universitas
Ciputra- 2015-Now: Wakil Ketua Program Studi International
Business Management
• Setifikasi Profesional- 2008: Certified Financial Planner (CFP®)- 2011: Sertifikasi Pendidik Sebagai Dosen Profesional
pada Bidang Ilmu Manajemen- 2011: Asesor Penilaian Beban Akademik Dosen- 2016: Asesor Entrepreneurship LSP 1
• Bidang Keahlian- Manajemen Keuangan- Investasi dan Pasar Modal- Metodologi Penelitian- Human Resource Management- Pembelajaran Entreprenurship
Ratio analysis
Limitations of ratio analysis
Qualitative factors
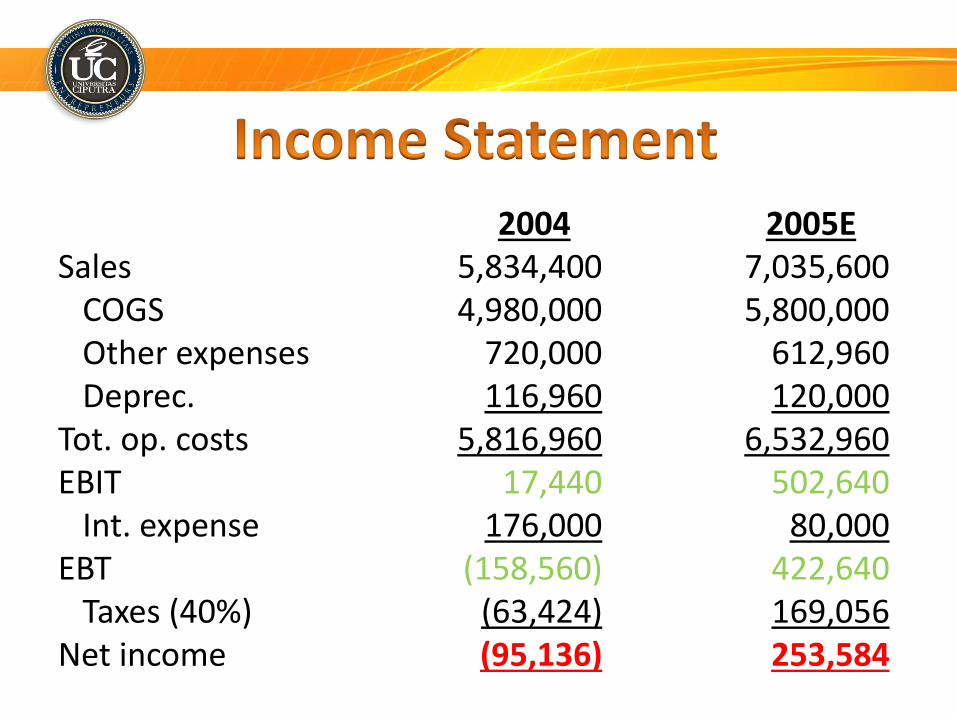
2004 2005ESales 5,834,400 7,035,600
COGS 4,980,000 5,800,000Other expenses 720,000 612,960Deprec. 116,960 120,000
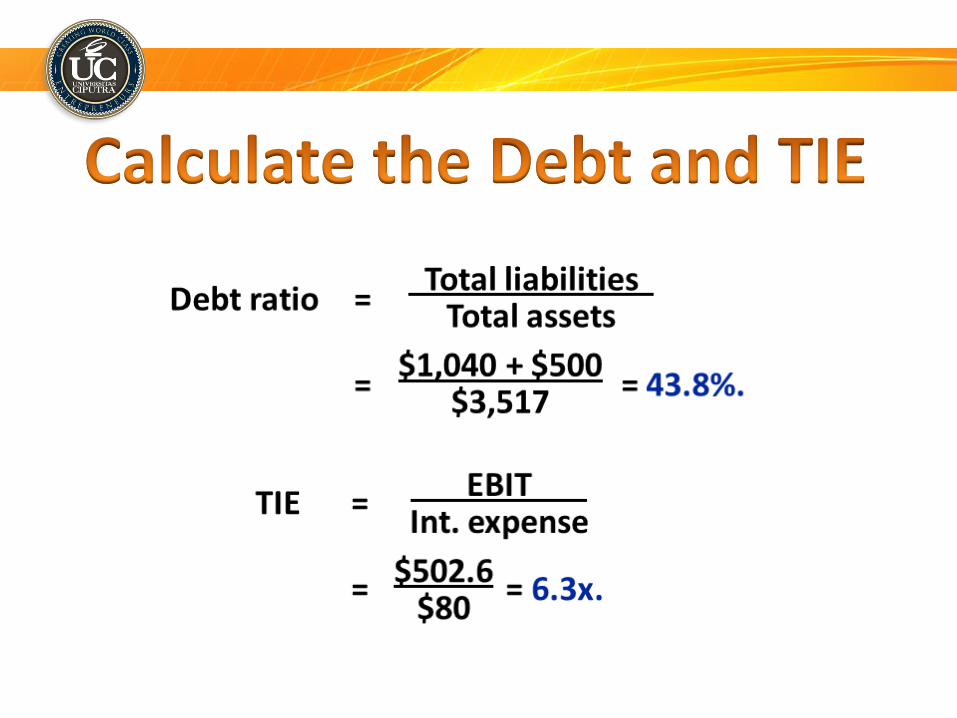
Tot. op. costs 5,816,960 6,532,960EBIT 17,440 502,640
Int. expense 176,000 80,000EBT (158,560) 422,640
Taxes (40%) (63,424) 169,056Net income (95,136) 253,584

2004 2005E
Cash 7,282 14,000
S-T invest. 20,000 71,632
AR 632,160 878,000
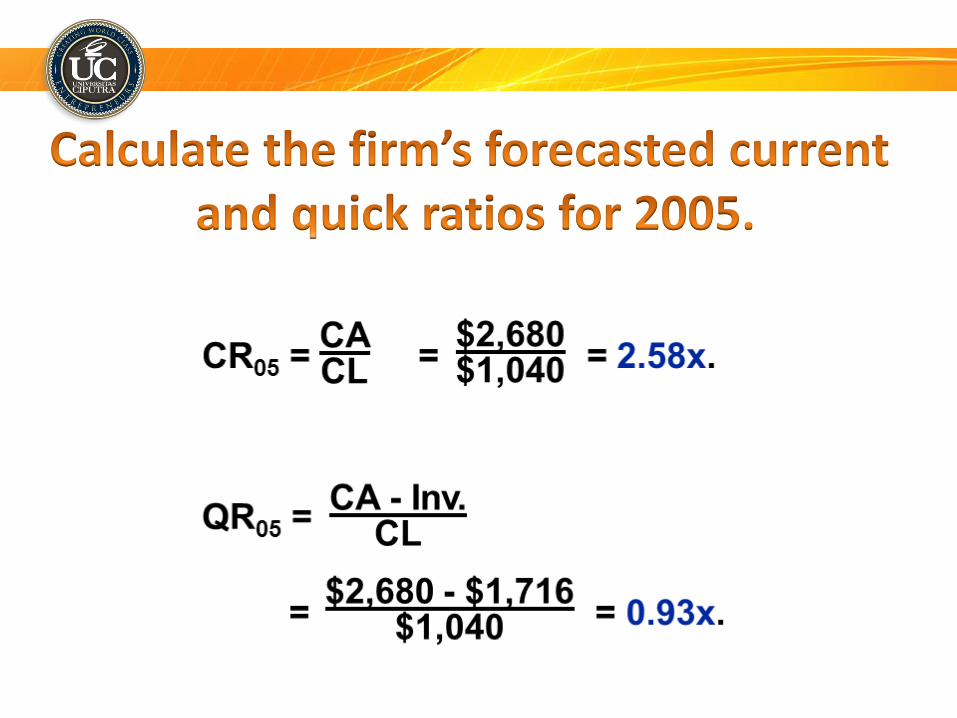
Inventories 1,287,360 1,716,480
Total CA 1,946,802 2,680,112
Net FA 939,790 836,840
Total assets 2,886,592 3,516,952
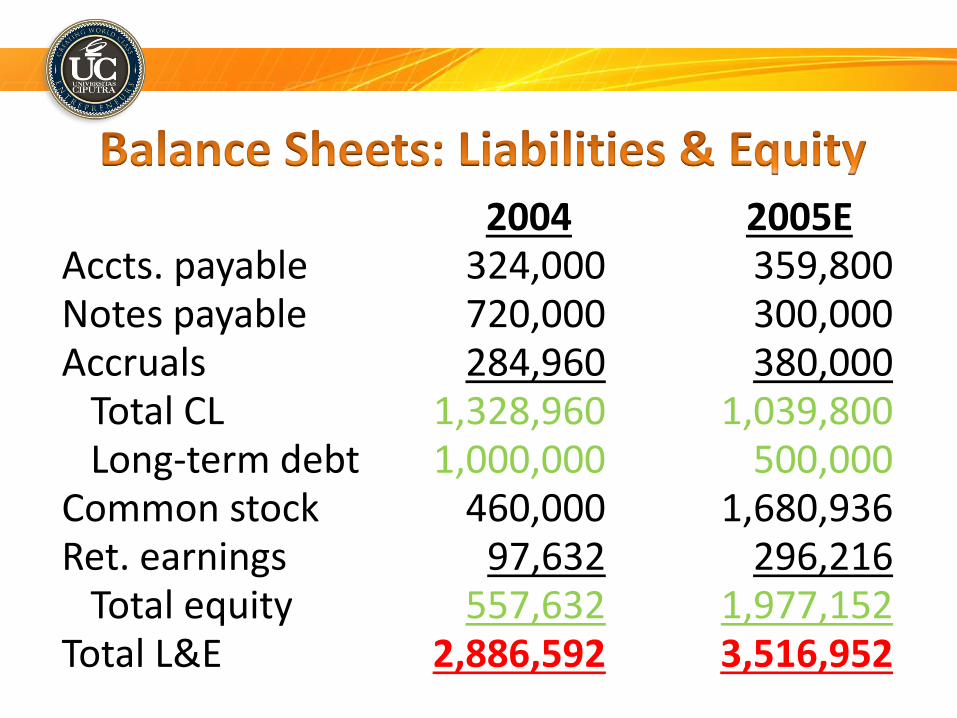
2004 2005EAccts. payable 324,000 359,800Notes payable 720,000 300,000Accruals 284,960 380,000
Total CL 1,328,960 1,039,800Long-term debt 1,000,000 500,000
Common stock 460,000 1,680,936Ret. earnings 97,632 296,216
Total equity 557,632 1,977,152Total L&E 2,886,592 3,516,952
Standardize numbers; facilitate comparisons
Used to highlight weaknesses and strengths
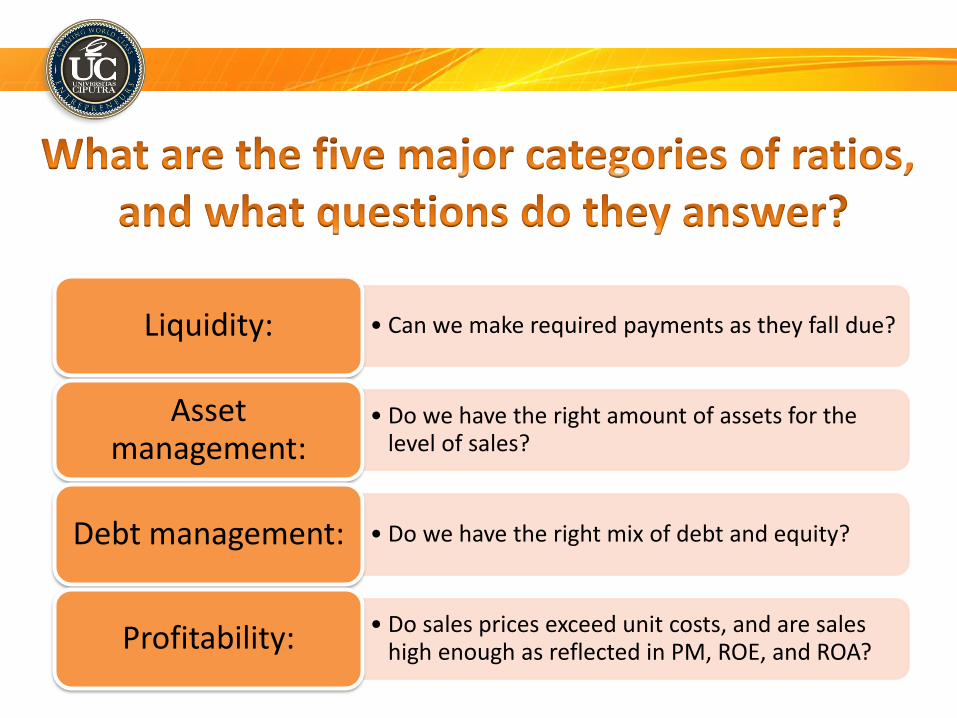
• Can we make required payments as they fall due?Liquidity:
• Do we have the right amount of assets for the level of sales?
Asset management:
• Do we have the right mix of debt and equity?Debt management:
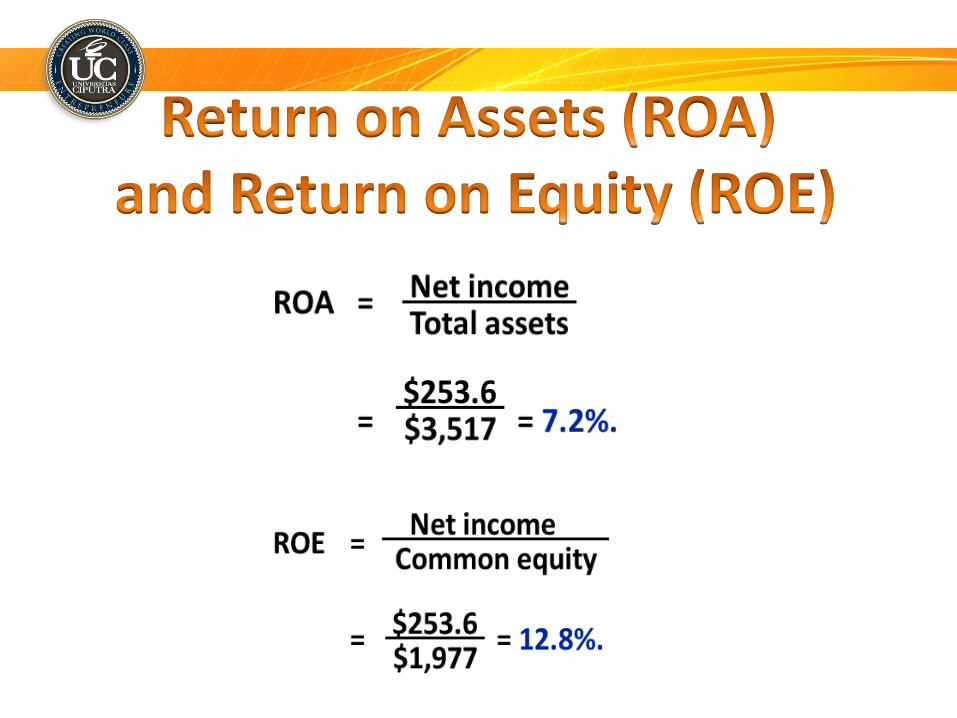
• Do sales prices exceed unit costs, and are sales high enough as reflected in PM, ROE, and ROA?Profitability:

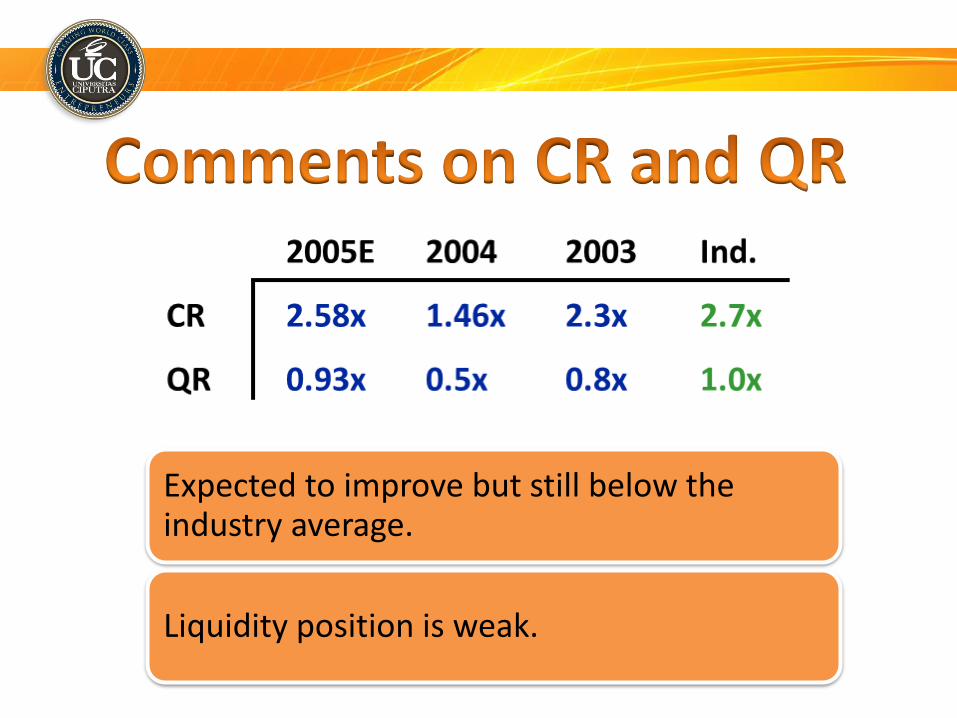
Expected to improve but still below the industry average.
Liquidity position is weak.


(More…)
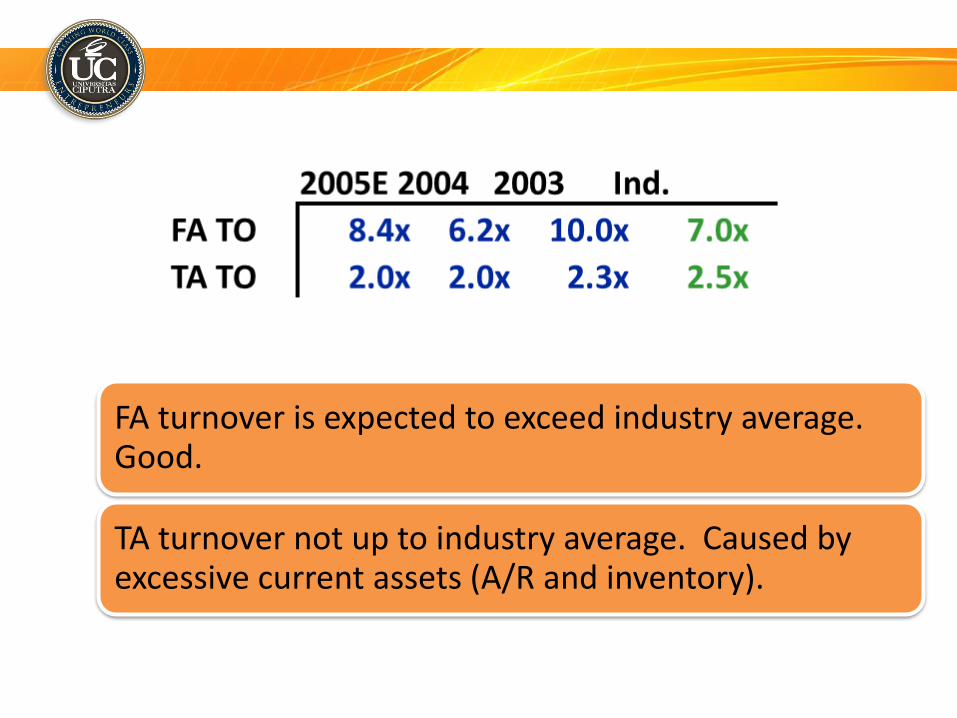
FA turnover is expected to exceed industry average. Good.
TA turnover not up to industry average. Caused by excessive current assets (A/R and inventory).

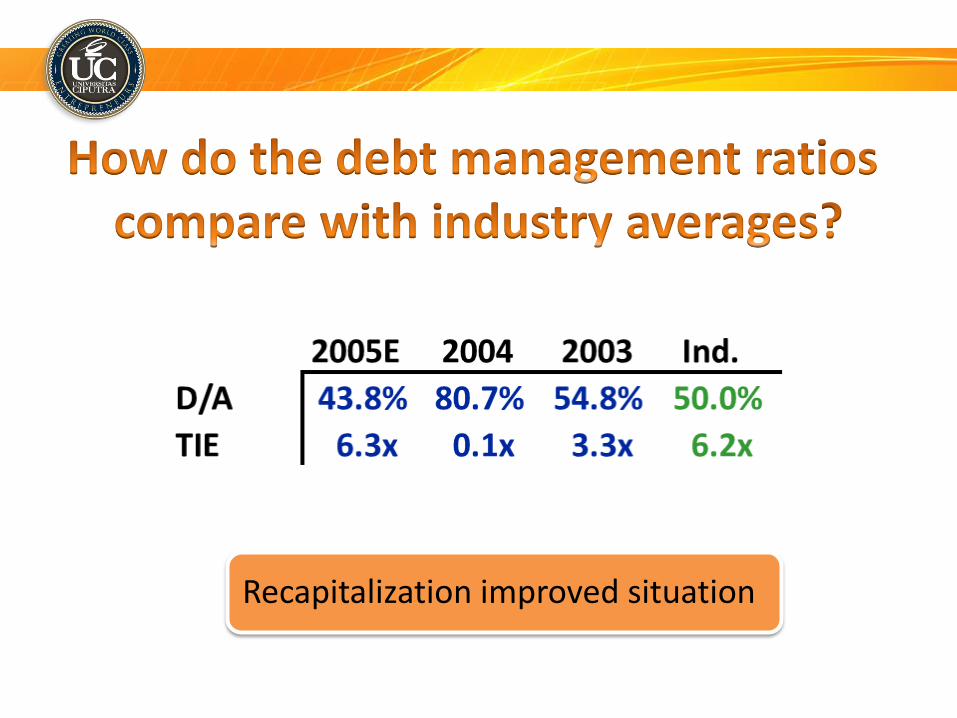
Recapitalization improved situation
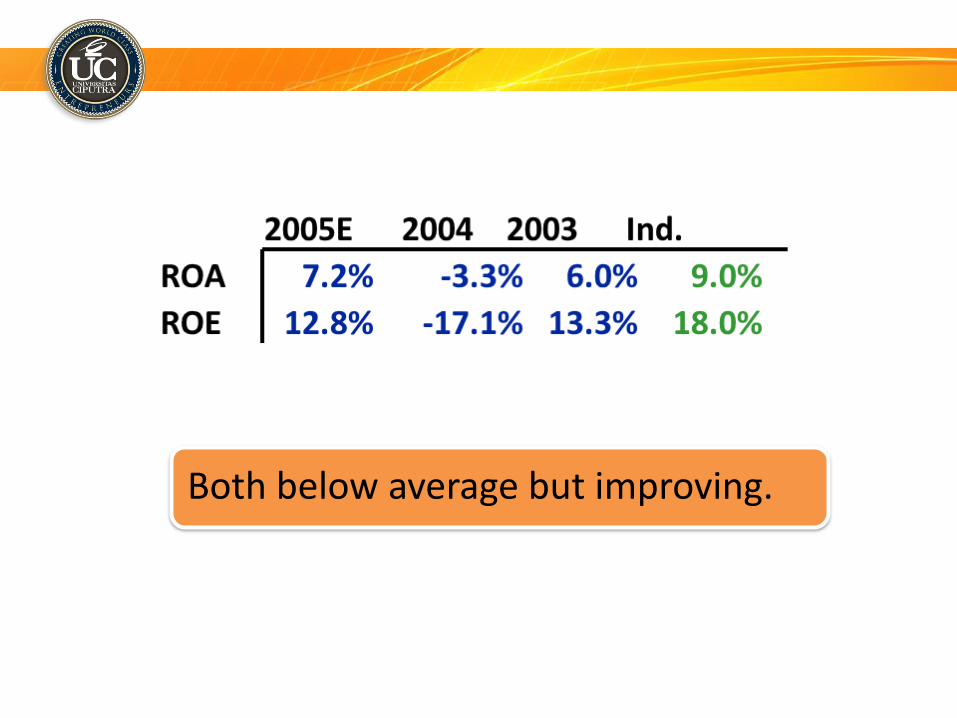
Both below average but improving.
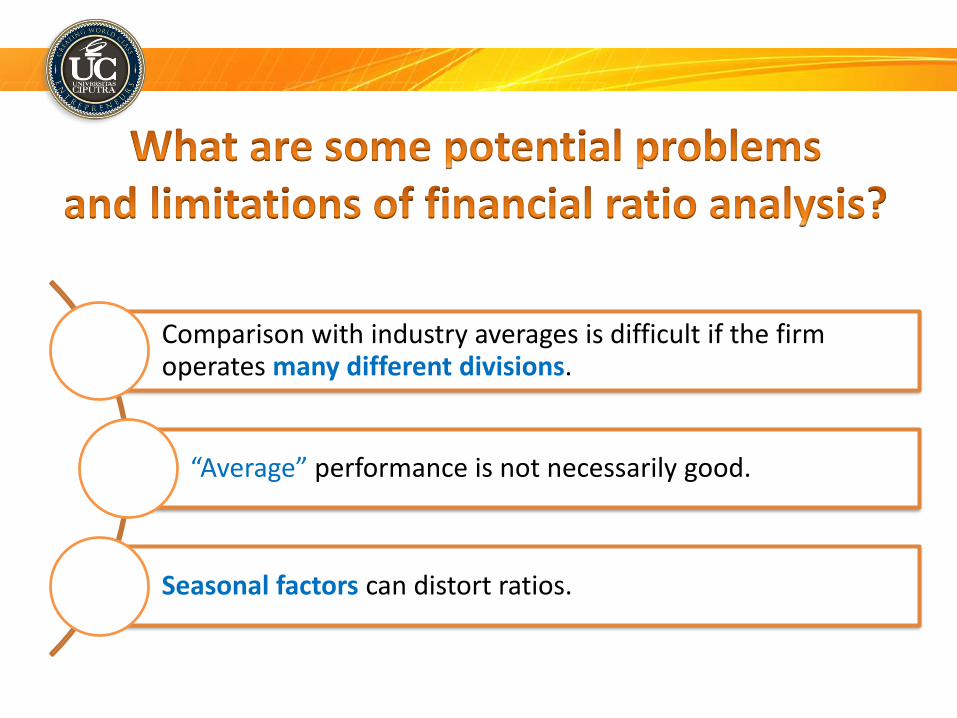
Comparison with industry averages is difficult if the firm operates many different divisions.
“Average” performance is not necessarily good.
Seasonal factors can distort ratios.
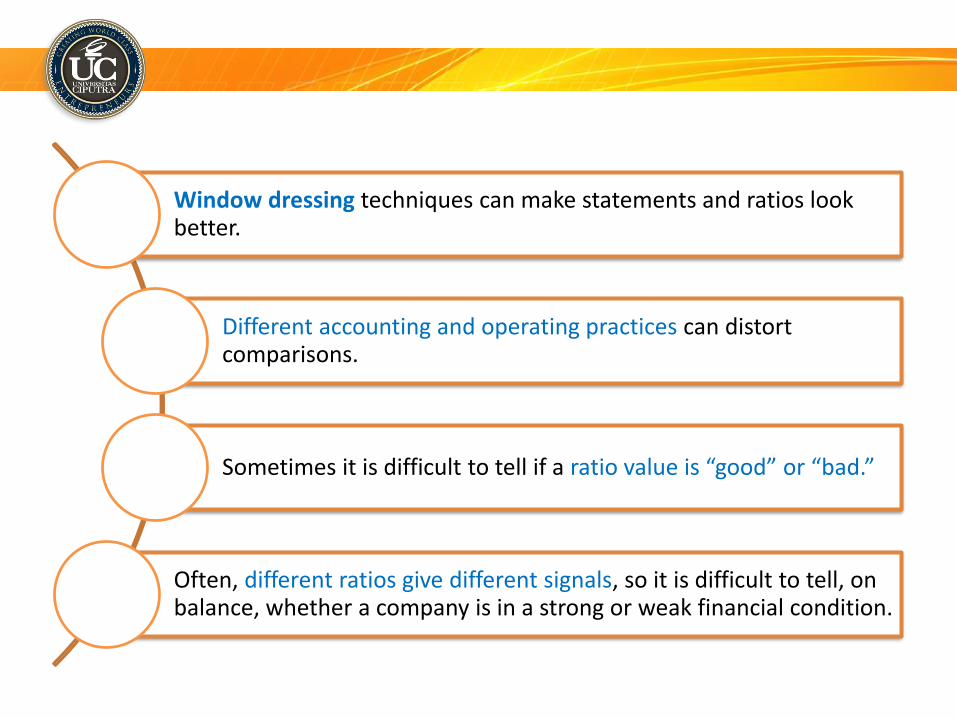
Window dressing techniques can make statements and ratios look better.
Different accounting and operating practices can distort comparisons.
Sometimes it is difficult to tell if a ratio value is “good” or “bad.”
Often, different ratios give different signals, so it is difficult to tell, on balance, whether a company is in a strong or weak financial condition.
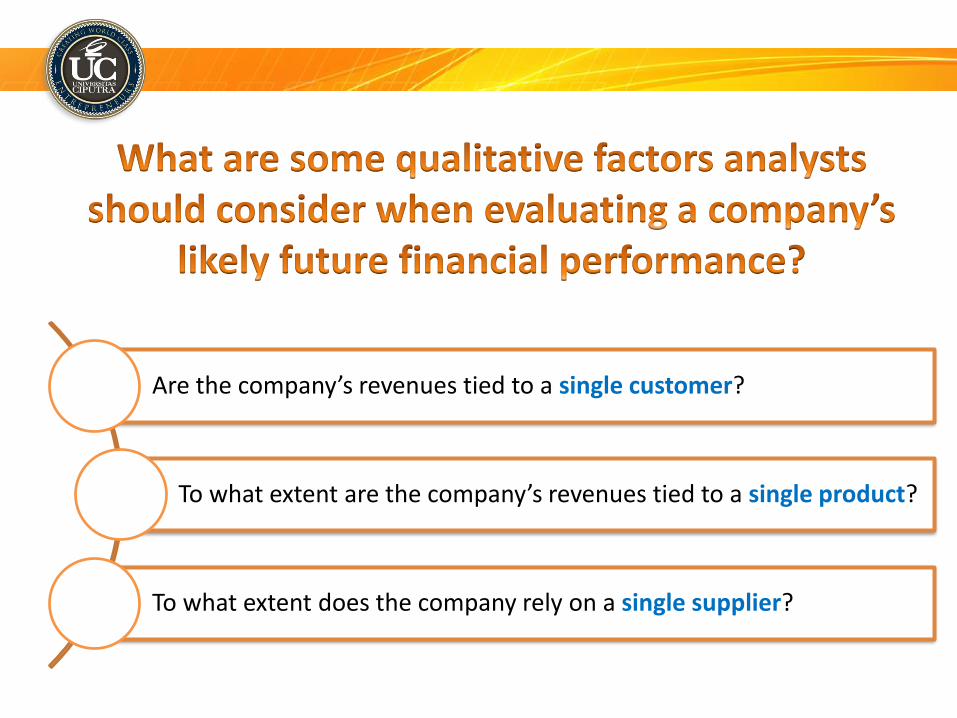
Are the company’s revenues tied to a single customer?
To what extent are the company’s revenues tied to a single product?
To what extent does the company rely on a single supplier?
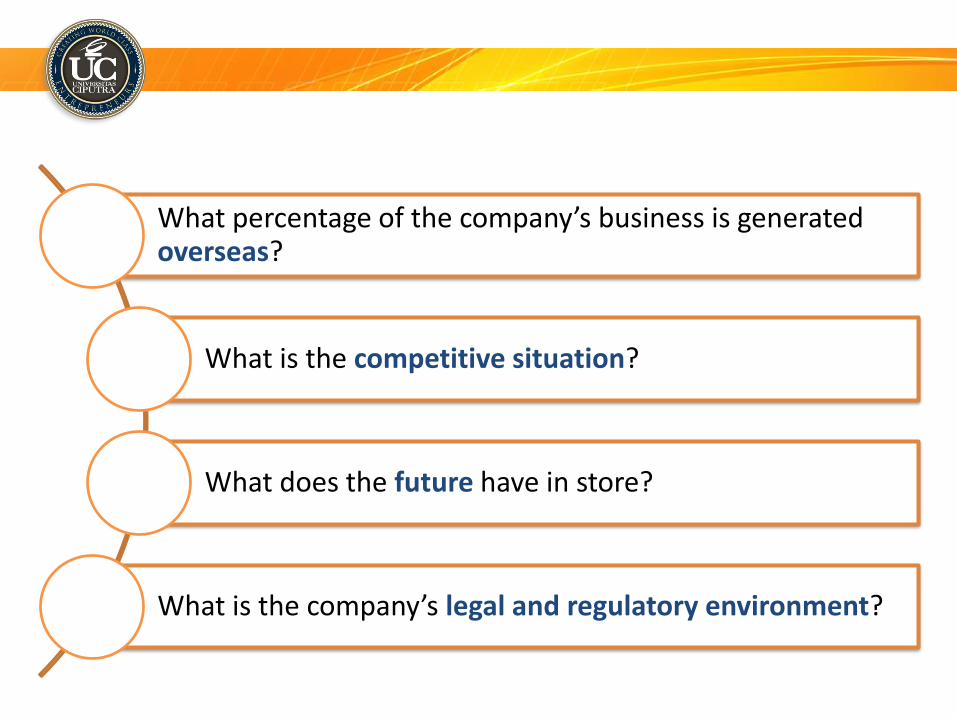
What percentage of the company’s business is generated overseas?
What is the competitive situation?
What does the future have in store?
What is the company’s legal and regulatory environment?