the influence of motivations and discipline … influence of motivations and discipline employee...
TRANSCRIPT
The Influence of Motivations and Discipline Employee
Performance at PMB Trisakti School of Tourism Jakarta
Johannes Kurniawan1, Doni Muhardiansyah
2 and Nurbaeti
3
1Bunda Mulia University, Jakarta, Indonesia
2 3Sekolah Tinggi Pariwisata Trisakti, Jakarta, Indonesia
Email: [email protected],
Abstract—The purpose of this study was to analyze the motivation and discipline on employee
performance at PMB Trisakti School of Tourism as well as to analyze dominant factors that influence the
employee performance. In this study, researchers conducted a study on the employees that work at PMB
Trisakti School of Tourism to find out the relationship and influence of the motivation and discipline on
employee performance. The method used is descriptive research method is method to analyze and explain
the data to what it is. The collection of data by distributing questionnaires as much as 40 respondents with
random sampling technique by using a calculation slovin. While the method of analysis using the
correlation coefficient formula and simple regression analysis was analyzed and drawn a hypothesis in
which hypothesis are confirmed. From the result of this study concluded that there is a relationship and
influence of the discipline variable trough to the employee performance of PMB Trisakti School of
Tourism. The dominant factors that influence the employee performance from discipline variable is
attitude factors.
Keywords—motivations, disciplines, employee performances, SPSS, PMB STP Trisakti
I. INTRODUCTION
The survival of a company depends heavily on the productivity, effectiveness and efficiency of its
workforce. The existence of manpower in carrying out its activities must be supported by facilities and
infrastructure and good management in accordance with the expectations of the company without any
sense of doubt and disappointment. Workers within a company are an important resource in
supporting business fluency. The success of the company in achieving its objectives, which is
determined by the human resources that exist within the company in performing their duties according
to their respective fields-each. Human resources that are the main resources must be processed by
management in order to perform their duties properly in accordance with the intended purpose.
Trisakti School of Tourism which is engaged in hospitality management education, requires good
human resources to run its operations. Without good human resource management the company will
not be able to run well and smoothly, so it is very important for the company to take full advantage of
all human resources possessed as much as possible.
The decline or improvement of worker performance is the most important element in supporting
the survival of the company especially in Trisakti School of Tourism, the human element is the most
important because most of the work process is done by humans. So that the need for work motivation
that can support and provide continuous support for workers to have high performance and will be
able to do the job very well.
Trisakti School of Tourism is one of the universities that have enough big name. Having a vision of
"Becoming a Higher Education of Global Quality Tourism and Center of Excellence (Center of
Excellence) Development of Tourism Science and Hospitality". Where to achieve that vision, Trisakti
School of Tourism continues to seek and form qualified candidates. So this is where Trisakti School
of Tourism formed the department of Ka. Center for Cooperation & Marketing led by Mr. Ismeth
Emier O, SE., MM., Which has two units under it namely, UPT Cooperation & Public Relations led
by Dian Octarina, M.Si. Par and UPT Marketing led by Tri Djoko Sulistyo, S.Sos.
Marketing is one of the principal activities undertaken by entrepreneurs in their endeavors to
sustain their survival, to grow and to earn profits. Success or failure in achieving business goals
depends on the skills of entrepreneurs in the field of marketing, production, finance and other fields. It
161Copyright © 2018, the Authors. Published by Atlantis Press. This is an open access article under the CC BY-NC license (http://creativecommons.org/licenses/by-nc/4.0/).
2nd International Conference on Tourism, Gastronomy, and Tourist Destination (ICTGTD 2018)Advances in Economics, Business and Management Research (AEBMR), volume 52
also depends on the ability of entrepreneurs to combine these functions so that the company's business
can run smoothly.
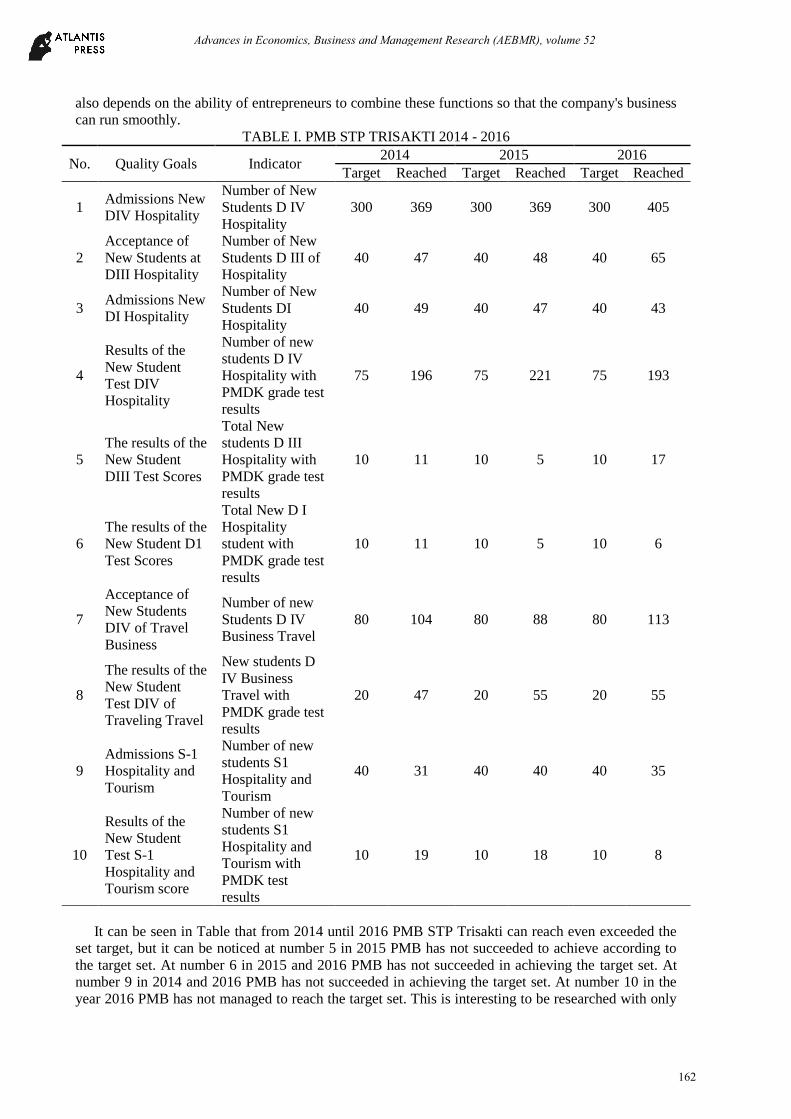
TABLE I. PMB STP TRISAKTI 2014 - 2016
No. Quality Goals Indicator 2014 2015 2016
Target Reached Target Reached Target Reached
1 Admissions New
DIV Hospitality
Number of New
Students D IV
Hospitality
300 369 300 369 300 405
2
Acceptance of
New Students at
DIII Hospitality
Number of New
Students D III of
Hospitality
40 47 40 48 40 65
3 Admissions New
DI Hospitality
Number of New
Students DI
Hospitality
40 49 40 47 40 43
4
Results of the
New Student
Test DIV
Hospitality
Number of new
students D IV
Hospitality with
PMDK grade test
results
75 196 75 221 75 193
5
The results of the
New Student
DIII Test Scores
Total New
students D III
Hospitality with
PMDK grade test
results
10 11 10 5 10 17
6
The results of the
New Student D1
Test Scores
Total New D I
Hospitality
student with
PMDK grade test
results
10 11 10 5 10 6
7
Acceptance of
New Students
DIV of Travel
Business
Number of new
Students D IV
Business Travel
80 104 80 88 80 113
8
The results of the
New Student
Test DIV of
Traveling Travel
New students D
IV Business
Travel with
PMDK grade test
results
20 47 20 55 20 55
9
Admissions S-1
Hospitality and
Tourism
Number of new
students S1
Hospitality and
Tourism
40 31 40 40 40 35
10
Results of the
New Student
Test S-1
Hospitality and
Tourism score
Number of new
students S1
Hospitality and
Tourism with
PMDK test
results
10 19 10 18 10 8
It can be seen in Table that from 2014 until 2016 PMB STP Trisakti can reach even exceeded the
set target, but it can be noticed at number 5 in 2015 PMB has not succeeded to achieve according to
the target set. At number 6 in 2015 and 2016 PMB has not succeeded in achieving the target set. At
number 9 in 2014 and 2016 PMB has not succeeded in achieving the target set. At number 10 in the
year 2016 PMB has not managed to reach the target set. This is interesting to be researched with only
162
Advances in Economics, Business and Management Research (AEBMR), volume 52
40 workers who are all students who work well so that the target of PMB in several years can be
achieved or even exceeded the target set by the institution achieved. This achievement is whether
motivation and work discipline affect the performance of PMB workers.
Based on the background of the above problem then the formulation of problems that can be
prepared is;
1. What is the effect of motivation on the performance of PMB Trisakti School of Tourism - Jakarta?
2. How does the effect of work discipline on the performance of PMB Trisakti School of Tourism -
Jakarta?
3. How does the motivation and work discipline work together on the performance of PMB Trisakti
School of Tourism - Jakarta?
4. What are the factors that most affect the performance of PMB Trisakti School of Tourism -
Jakarta?
II. LITERATURE REVIEW
A. Motivation
Motivation is often interpreted in terms of encouragement. Encouragement or energy is a
movement of the soul and body to do. In essence, working people tend to be driven by the desire to
meet their needs, as well as social activities to maintain the survival and satisfaction in himself and
others. Physiological factors are factors who related to physical things or riel associated with the
employees themselves such as financial factors (salary, wages, letters of appreciation and so forth),
the work factor itself as well as supervision and supervisory factors. Need for affiliation is the desire
to establish a friendly and intimate interpersonal relationship. Need for achievement is the urge to go
beyond, reach the standards, and strive to succeed (Robbins, 2012).
B. Discipline
Discipline is a form of obedience to the rules, both written and unwritten set. Discipline must be
developed to grow also order and efficiency. Attitude is the mental and employee behavior derived
from the awareness or willingness of himself / herself in carrying out the duties and regulations of the
company, consisting of: a. Attendance relates to the existence of employees in the workplace for
work, b. Able to utilize and use the equipment well. Norm is the rules on what employees can and
should not do while inside the company and as a reference in attitude consist of: a. Obeying the rules
is that employees consciously comply with company-specified rules, b. Following the way the
company determined work. Responsible is the ability to carry out the duties and regulations within the
company. Complete the work at the time specified by the employee should be responsible for his work
by completing the job at exactly the time specified company (Hasibuan, 2005).
C. Employee Performance
Employee performance is the achievement or work result both quality and quantity achieved
human resources in carrying out its duties in accordance with the responsibilities given to him. Quality
of work is the ability of employees to show the quality of work in terms of thoroughness and neatness.
Quantity of work is the ability of employees in completing a number of daily tasks. Knowledge of
work is understanding of all levels of work and matters relating to it. Initiative is related to the power
of thought and creativity in the form of ideas for an organizational purpose. Each initiative should
receive the attention or positive response from the boss. If the employer always tackles the employee's
initiative then the organization will lose energy or the impetus to move forward. Creativeness is the
authenticity of the ideas raised and the actions to resolve the problems that arise (Artana, 2002).
163
Advances in Economics, Business and Management Research (AEBMR), volume 52
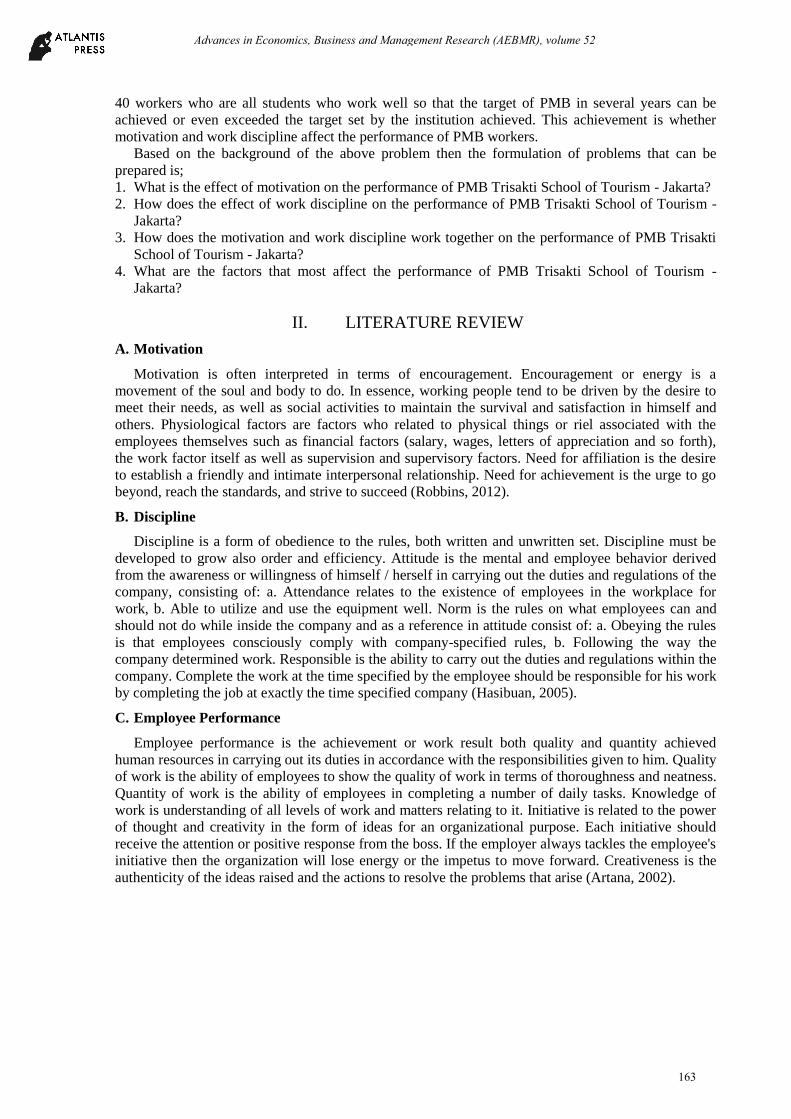
Motivation (X1)
Physiological factors
Need for affiliation
Need for achievement
Discipline (X1)
Attitude, Norm
Responsible
FIG I. FRAMEWORKS
III. METHODS
A. Data
1. Population
Population is a generalization area consisting of objects / subjects that have certain qualities and
characteristics set by the researchers to be studied and then drawn conclusions (Sugiyono, 2004).
Population in research on UPT workers. Marketing is the division of PMB Trisakti School of
Tourism, amounting to 40 workers.
2. Sample
The sample is part of the number and characteristics possessed by that population. When the
population is large, and researchers are not likely to study everything in the population, for example
due to limited funds, energy and time, the researchers can use samples taken from that population
(Sugiyono, 2004). Irawan (1999) suggested that some experts say if the population ≤ 100 taken all as a
sample, but if the population ≥ 100 taken at least 25-30%. So, the sample in this study is all workers at
PMB Trisakti School of Tourism. The sample of primary data questionnaire is taken 100%
(instrument percent) that is 40 workers in PMB Trisakti School of Tourism.
B. Method
Method of taking data used in this research is by using questioner or questionnaire. Questionnaire
method according to Indriantoro (2002) is the collection of research data on certain conditions may
not require the presence of researchers. Researcher's questions and respondents' answers can be put
forward in writing through a questionnaire. The purpose of making the questionnaire is to obtain
relevant information from the research respondents. The questionnaire in this study consisted of
questions derived from each of the research instruments.
The questionnaire is distinguished into a closed questionnaire, i.e the correspondent is only given
the opportunity to choose the answers that have been provided in accordance with his opinion and
open questionnaire that respondents are given the opportunity to answer in accordance with his
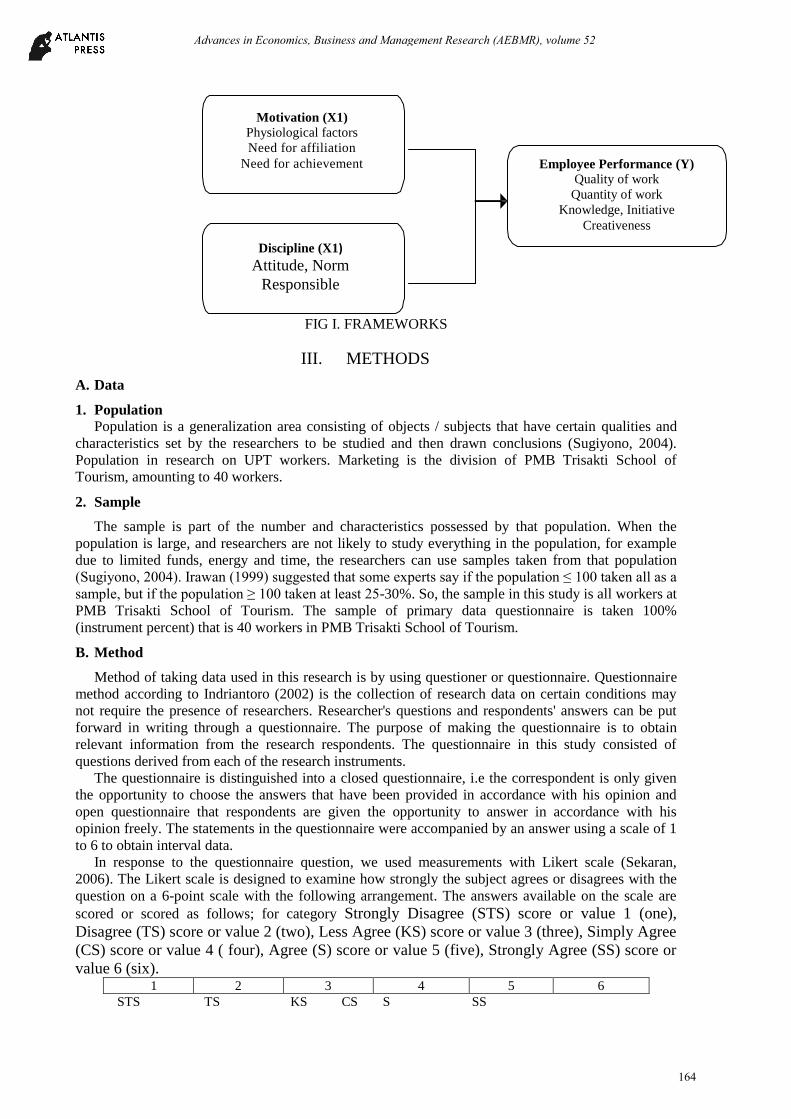
opinion freely. The statements in the questionnaire were accompanied by an answer using a scale of 1
to 6 to obtain interval data.
In response to the questionnaire question, we used measurements with Likert scale (Sekaran,
2006). The Likert scale is designed to examine how strongly the subject agrees or disagrees with the
question on a 6-point scale with the following arrangement. The answers available on the scale are
scored or scored as follows; for category Strongly Disagree (STS) score or value 1 (one),
Disagree (TS) score or value 2 (two), Less Agree (KS) score or value 3 (three), Simply Agree
(CS) score or value 4 ( four), Agree (S) score or value 5 (five), Strongly Agree (SS) score or
value 6 (six). 1 2 3 4 5 6
STS TS KS CS S SS
Employee Performance (Y)
Quality of work
Quantity of work
Knowledge, Initiative
Creativeness
164
Advances in Economics, Business and Management Research (AEBMR), volume 52
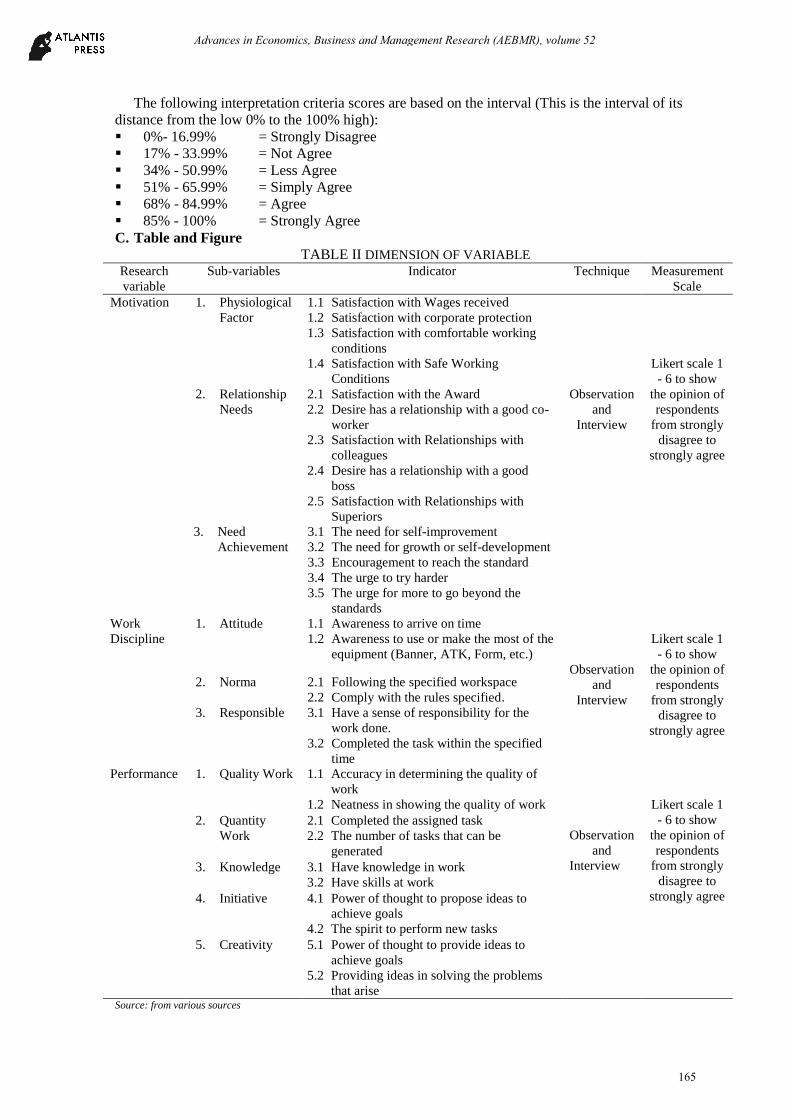
The following interpretation criteria scores are based on the interval (This is the interval of its
distance from the low 0% to the 100% high):
0%- 16.99% = Strongly Disagree
17% - 33.99% = Not Agree
34% - 50.99% = Less Agree
51% - 65.99% = Simply Agree
68% - 84.99% = Agree
85% - 100% = Strongly Agree
C. Table and Figure TABLE II DIMENSION OF VARIABLE
Research
variable
Sub-variables Indicator Technique Measurement
Scale
Motivation 1. Physiological
Factor
1.1 Satisfaction with Wages received
1.2 Satisfaction with corporate protection
1.3 Satisfaction with comfortable working
conditions
1.4 Satisfaction with Safe Working
Conditions
Observation
and
Interview
Likert scale 1
- 6 to show
the opinion of
respondents
from strongly
disagree to
strongly agree
2. Relationship
Needs
2.1 Satisfaction with the Award
2.2 Desire has a relationship with a good co-
worker
2.3 Satisfaction with Relationships with
colleagues
2.4 Desire has a relationship with a good
boss
2.5 Satisfaction with Relationships with
Superiors
3. Need
Achievement
3.1 The need for self-improvement
3.2 The need for growth or self-development
3.3 Encouragement to reach the standard
3.4 The urge to try harder
3.5 The urge for more to go beyond the
standards
Work
Discipline
1. Attitude 1.1 Awareness to arrive on time
1.2 Awareness to use or make the most of the
equipment (Banner, ATK, Form, etc.)
Observation
and
Interview
Likert scale 1
- 6 to show
the opinion of
respondents
from strongly
disagree to
strongly agree
2. Norma 2.1 Following the specified workspace
2.2 Comply with the rules specified.
3. Responsible 3.1 Have a sense of responsibility for the
work done.
3.2 Completed the task within the specified
time
Performance 1. Quality Work 1.1 Accuracy in determining the quality of
work
1.2 Neatness in showing the quality of work
Observation
and
Interview
Likert scale 1
- 6 to show
the opinion of
respondents
from strongly
disagree to
strongly agree
2. Quantity
Work
2.1 Completed the assigned task
2.2 The number of tasks that can be
generated
3. Knowledge 3.1 Have knowledge in work
3.2 Have skills at work
4. Initiative 4.1 Power of thought to propose ideas to
achieve goals
4.2 The spirit to perform new tasks
5. Creativity 5.1 Power of thought to provide ideas to
achieve goals
5.2 Providing ideas in solving the problems
that arise Source: from various sources
165
Advances in Economics, Business and Management Research (AEBMR), volume 52
1. Linear Regression Analysis
According Sugiyono (2010) parametric statistics are used to analyze interval and ratio data. The
regression analysis model used in this research is linear regression analysis. To test the effect of
independent variable to one dependent variable is expressed by the following formula;
The formula Y = α + β1X1 + β2X2
Y = dependent variable, i.e employee performance
α = Constants
β1 = variable regression coefficient 1
β2 = regression coefficient of variable 2
X1 = independent variable 1
X2 = independent variable 2
IV. RESULTS AND DISCUSSION
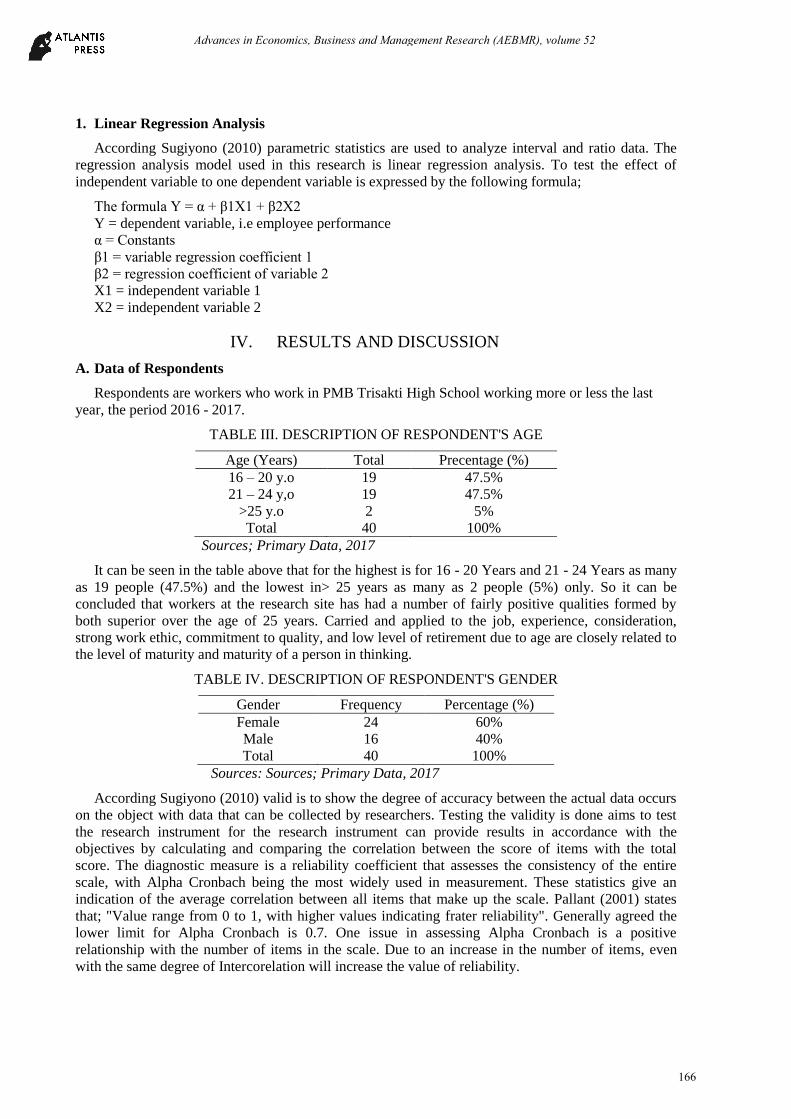
A. Data of Respondents
Respondents are workers who work in PMB Trisakti High School working more or less the last
year, the period 2016 - 2017.
TABLE III. DESCRIPTION OF RESPONDENT'S AGE
Age (Years) Total Precentage (%)
16 – 20 y.o
21 – 24 y,o
>25 y.o
19
19
2
47.5%
47.5%
5%
Total 40 100%
Sources; Primary Data, 2017
It can be seen in the table above that for the highest is for 16 - 20 Years and 21 - 24 Years as many
as 19 people (47.5%) and the lowest in> 25 years as many as 2 people (5%) only. So it can be
concluded that workers at the research site has had a number of fairly positive qualities formed by
both superior over the age of 25 years. Carried and applied to the job, experience, consideration,
strong work ethic, commitment to quality, and low level of retirement due to age are closely related to
the level of maturity and maturity of a person in thinking.
TABLE IV. DESCRIPTION OF RESPONDENT'S GENDER
Gender Frequency Percentage (%)
Female
Male
24
16
60%
40%
Total 40 100%
Sources: Sources; Primary Data, 2017
According Sugiyono (2010) valid is to show the degree of accuracy between the actual data occurs
on the object with data that can be collected by researchers. Testing the validity is done aims to test
the research instrument for the research instrument can provide results in accordance with the
objectives by calculating and comparing the correlation between the score of items with the total
score. The diagnostic measure is a reliability coefficient that assesses the consistency of the entire
scale, with Alpha Cronbach being the most widely used in measurement. These statistics give an
indication of the average correlation between all items that make up the scale. Pallant (2001) states
that; "Value range from 0 to 1, with higher values indicating frater reliability". Generally agreed the
lower limit for Alpha Cronbach is 0.7. One issue in assessing Alpha Cronbach is a positive
relationship with the number of items in the scale. Due to an increase in the number of items, even
with the same degree of Intercorelation will increase the value of reliability.
166
Advances in Economics, Business and Management Research (AEBMR), volume 52
B. Statement of results
According Sugiyono (2010) parametric statistics are used to analyze interval and ratio data. The
regression analysis model used in this research is linear regression analysis. To test the effect of
independent variables on one dependent variable.
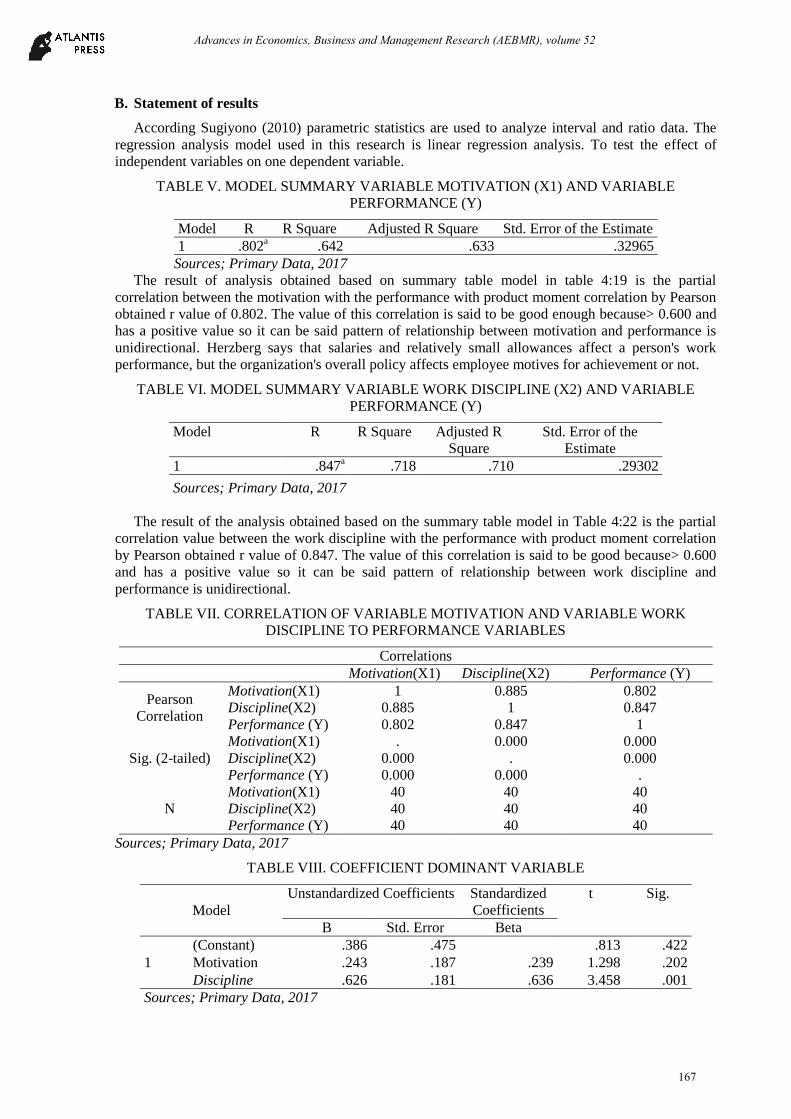
TABLE V. MODEL SUMMARY VARIABLE MOTIVATION (X1) AND VARIABLE
PERFORMANCE (Y)
Model R R Square Adjusted R Square Std. Error of the Estimate
1 .802a .642 .633 .32965
Sources; Primary Data, 2017
The result of analysis obtained based on summary table model in table 4:19 is the partial
correlation between the motivation with the performance with product moment correlation by Pearson
obtained r value of 0.802. The value of this correlation is said to be good enough because> 0.600 and
has a positive value so it can be said pattern of relationship between motivation and performance is
unidirectional. Herzberg says that salaries and relatively small allowances affect a person's work
performance, but the organization's overall policy affects employee motives for achievement or not.
TABLE VI. MODEL SUMMARY VARIABLE WORK DISCIPLINE (X2) AND VARIABLE
PERFORMANCE (Y)
Model R R Square Adjusted R
Square
Std. Error of the
Estimate
1 .847a .718 .710 .29302
Sources; Primary Data, 2017
The result of the analysis obtained based on the summary table model in Table 4:22 is the partial
correlation value between the work discipline with the performance with product moment correlation
by Pearson obtained r value of 0.847. The value of this correlation is said to be good because> 0.600
and has a positive value so it can be said pattern of relationship between work discipline and
performance is unidirectional.
TABLE VII. CORRELATION OF VARIABLE MOTIVATION AND VARIABLE WORK
DISCIPLINE TO PERFORMANCE VARIABLES
Correlations
Motivation(X1) Discipline(X2) Performance (Y)
Pearson
Correlation
Motivation(X1) 1 0.885 0.802
Discipline(X2) 0.885 1 0.847
Performance (Y) 0.802 0.847 1
Sig. (2-tailed)
Motivation(X1) . 0.000 0.000
Discipline(X2) 0.000 . 0.000
Performance (Y) 0.000 0.000 .
N
Motivation(X1) 40 40 40
Discipline(X2) 40 40 40
Performance (Y) 40 40 40
Sources; Primary Data, 2017
TABLE VIII. COEFFICIENT DOMINANT VARIABLE
Model
Unstandardized Coefficients Standardized
Coefficients
t Sig.
B Std. Error Beta
1
(Constant) .386 .475 .813 .422
Motivation .243 .187 .239 1.298 .202
Discipline .626 .181 .636 3.458 .001
Sources; Primary Data, 2017
167
Advances in Economics, Business and Management Research (AEBMR), volume 52
Seen in the correlation table then the value that has the closest and significant relationship is the
work discipline and then known in the coefficient variable table is more dominant in determining the
improvement of performance is the discipline of 0.626 in accordance with the said work discipline
should be grown to grow also order and efficiency.
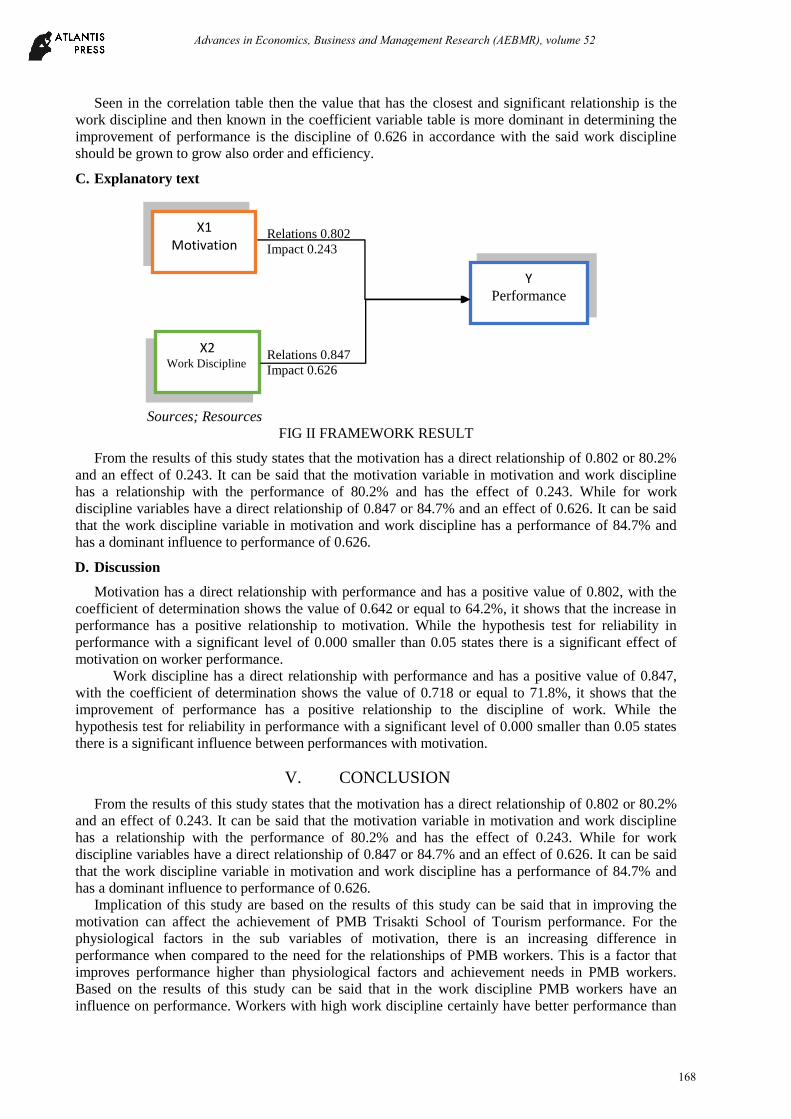
C. Explanatory text
Relations 0.802 Impact 0.243
Relations 0.847 Impact 0.626
Sources; Resources
FIG II FRAMEWORK RESULT
From the results of this study states that the motivation has a direct relationship of 0.802 or 80.2%
and an effect of 0.243. It can be said that the motivation variable in motivation and work discipline
has a relationship with the performance of 80.2% and has the effect of 0.243. While for work
discipline variables have a direct relationship of 0.847 or 84.7% and an effect of 0.626. It can be said
that the work discipline variable in motivation and work discipline has a performance of 84.7% and
has a dominant influence to performance of 0.626.
D. Discussion
Motivation has a direct relationship with performance and has a positive value of 0.802, with the
coefficient of determination shows the value of 0.642 or equal to 64.2%, it shows that the increase in
performance has a positive relationship to motivation. While the hypothesis test for reliability in
performance with a significant level of 0.000 smaller than 0.05 states there is a significant effect of
motivation on worker performance.
Work discipline has a direct relationship with performance and has a positive value of 0.847,
with the coefficient of determination shows the value of 0.718 or equal to 71.8%, it shows that the
improvement of performance has a positive relationship to the discipline of work. While the
hypothesis test for reliability in performance with a significant level of 0.000 smaller than 0.05 states
there is a significant influence between performances with motivation.
V. CONCLUSION
From the results of this study states that the motivation has a direct relationship of 0.802 or 80.2%
and an effect of 0.243. It can be said that the motivation variable in motivation and work discipline
has a relationship with the performance of 80.2% and has the effect of 0.243. While for work
discipline variables have a direct relationship of 0.847 or 84.7% and an effect of 0.626. It can be said
that the work discipline variable in motivation and work discipline has a performance of 84.7% and
has a dominant influence to performance of 0.626.
Implication of this study are based on the results of this study can be said that in improving the
motivation can affect the achievement of PMB Trisakti School of Tourism performance. For the
physiological factors in the sub variables of motivation, there is an increasing difference in
performance when compared to the need for the relationships of PMB workers. This is a factor that
improves performance higher than physiological factors and achievement needs in PMB workers.
Based on the results of this study can be said that in the work discipline PMB workers have an
influence on performance. Workers with high work discipline certainly have better performance than
X2 Work Discipline
Y Performance
X1 Motivation
168
Advances in Economics, Business and Management Research (AEBMR), volume 52
workers with moderate and low work discipline. It is expected that the management of PMB can
foster work discipline in the workers in various ways, especially in improving attitude factors. Based
on the results of this study can be said that the performance in the PMB has a relationship. The
existence of interaction between motivation and discipline of work high, medium and low in this
study, is expected to increase higher in performance to be able to maintain and can achieve targets that
if not met by the PMB workers. It is this initiative factor that in which PMB workers have an impact
and has a significant impact on performance.
PMB Trisakti School of Tourism to be able to maintain motivation in the factors of relationship
needs, and more to increase motivation in physiological factors of its workers, with one of them
increase wage and job protection guarantee to the worker of PMB Trisakti School of Tourism works
discipline is good enough, but must be able to maintain the attitude has already been established and
upgraded the application in the established norms, by establishing regulations which can be discussed
with workers to reach a collective agreement. Performance in PMB Trisakti School of Tourism where
the initiative factor is good enough and must be maintained. Where the quality factor of work in
accuracy and tidiness in work should be improved even more, by conducting an audit per two weeks
or at a time at the end of the month.
REFERENCES
Artana, I Wayan Arta, 2002, “Pengaruh Kepemimpinan, Kompensasi, dan Lingkungan Kerja terhadap
Performance Karyawan Studi Kasus di Maya Ubud Resto dan Spa”, Jurnal Perhotelan dan
dan Pariwisata, Vol. 2 No. 1:66.
Basu Swastha dan Irawan, (1999), Manajemen Pemasaran Modern, Edisi 2, Yogyakarta : Liberty
FIMI Dataset Repository, http://fimi.cs.helsinki.fi/data/ Retrieved 09 August, 2011.
Han, J., Kamber, M., and Pei, J., “Data Mining: Concepts and Techniques, 3rd
edition,” Morgan
Kaufmann, 2011.
Hasibuan, Malayu S.P, 2005. Manajemen Sources Daya Manusia. Jakarta: PT Bumi Aksara
J. P. Wilkinson, “Nonlinear resonant circuit devices,” U.S. Patent 3 624 12, July 16, 1990.
Leung, C. K-S, Khan Q.I., Li, Z., and Hoque, T., “CanTree: A Canonical-Order Tree for Incremental
Frequent-Pattern Mining,” Knowledge and Information Systems 11 (3), 287–311 (2007).
Pallant, Julie. (2001). SPSS survival guide: a step-by-step guide to data analysis using SPSS. Victoria:
McPherson Printing Group
Pei, J., Han, J., Lu, H., Nishio, S., Tang, S., and Yang, D, “Hmine: Hyper-Structure Mining of
Frequent Patterns in Large Databases,” In the Proceedings of IEEE International Conference
on Data Mining, IEEE Press, 441–448 (2001).
Robbins. Stephen. P., Coulter. Mary. (2012). Management. Eleventh Edition. Jakarta:
England
Robbins. Stephen. P., Coulter. Mary. (2012). Management. Eleventh Edition. Jakarta: England
Sugiyono. 2004. Metode Penelitian Bisnis: Penerbit CV. Alfabeta: Bandung
Sugiyono. 2010. Metode Penelitian Kuantitatif Kualitatif & RND. Bandung: CV.ALFABETA
Tanbeer, S.K., Chowdhury, F.A., Jeong, B.S., Lee, Y-K.,”CP-Tree: A Tree Structure for Single-Pass
Frequent Pattern Mining,” In T. Washio et al. (Eds.), Lecture Notes in Artificial Intelligence
5012, Springer, 1022–1027. (2008).
Williams, J., “Narrow-band analyzer,” Ph.D. dissertation, Department of Electrical Engineering,
Harvard University, Cambridge, MA, 1993.
169
Advances in Economics, Business and Management Research (AEBMR), volume 52