the export supply of indonesian crude palm oil (cpo) …
TRANSCRIPT
Agro Ekonomi Vol. 29/No. 1, Juni 201818
THE EXPORT SUPPLY OF INDONESIAN CRUDE PALM OIL (CPO) TO INDIA
Penawaran Ekspor Crude Palm Oil (CPO) Indonesia ke India
Marizha Nurcahyani, Masyhuri, Slamet Hartono Master of Agribussiness Management, Faculty of Agriculture, Universitas Gadjah Mada
Jl. Flora, Bulaksumur, Kec.Depok, Sleman District Daerah Istimewa Yogyakarta 55281
Diterima tanggal : 6 November 2017; Disetujui tanggal : 20 Maret 2018
ABSTRACTPalm oil is one of the world’s most consumed vegetable oils other than soybean oil, canola oil and sunflower seed oil. Indonesia is one of the largest CPO producers in the world, while India is the biggest consumer in Indonesia as well as in the world. This study was conducted to analyze the rate of Indonesia’s CPO export growth to India by using the annual data from 2003 to 2015 and the factors affecting Indonesia’s CPO exports to India by using the annual data from 1990 to 2015. The method used is market share analysis by standard growth calculation to measure the growth rate and Error Correction Model (ECM) method to know the factors that give short-term and long-term effects. Factors tested in this study include international CPO prices, soybean oil prices, Malaysian CPO export duty and Indonesian CPO export duty. The analysis shows that the growth rate of Indonesian CPO exports to India is fluctuate and the export volume of Indonesian CPO to India is influenced by export duty of CPO Indonesia negatively and significantly in the long-term and short-term.
Keywords: CPO, ECM, export, India
INTISARIMinyak sawit merupakan salah satu dari jenis minyak nabati yang paling banyak dikonsumsi dunia di samping minyak kedelai, minyak kanola dan minyak biji bunga matahari. Salah satu produsen terbesar minyak sawit di dunia adalah Indonesia sedangkan konsumen terbesarnya adalah India. Penelitian ini dilakukan untuk menganalisa laju pertumbuhan ekspor CPO Indonesia ke India tahun 2003 sampai 2015 serta faktor-faktor yang memengaruhi ekspor CPO Indonesia ke India tahun 1990 sampai 2015. Metode yang digunakan adalah analisis pangsa pasar dengan perhitungan pertumbuhan standar untuk mengukur laju pertumbuhan serta metode Error Correction Model (ECM) untuk mengetahui faktor yang berpengaruh pada jangka pendek dan jangka panjang. Faktor-faktor yang diujikan dalam penelitian ini antara lain harga CPO internasional, harga minyak kedelai, bea ekspor CPO Malaysia dan bea ekspor CPO Indonesia. Hasil analisis menunjukkan bahwa laju pertumbuhan ekspor CPO Indonesia ke India berfluktuatif serta volume ekspor CPO Indonesia oleh India dipengaruhi oleh bea ekspor CPO Indonesia secara negatif dan signifikan baik dalam jangka panjang maupun dalam jangka pendek.
Kata kunci : CPO, ECM, ekspor, India
AGRO EKONOMI, Vol 29, No 1, Juni 2018, Hal.18-31DOI : http://doi.org/ 10.22146/ae.29931
ISSN 0215-8787 (print), ISSN 2541-1616 (online)Tersedia online di https://jurnal.ugm.ac.id/jae/
19Agro Ekonomi Vol. 29/No. 1, Juni 2018
the need for imports of CPO is filled by exporting edible oil of countries.
Indonesia, as the major producer of CPO in 2015 has been exporting to India with the volume was 3,820,702 tons (49% of Indonesia’s total CPO exports) with a total value of 2,112,621,223 US$ (Central Bureau of Statistics, 2016). Despite the huge total of CPO exports to India, research by (Dewanta, Arfani, & Erfita, 2016) resulted that there is a decline in the competitiveness of Indian’s market. It is also said that CPO is normal goods and can be easily substituted with the same product from other countries or other vegetable oils.
Previous research was conducted by Syadullah (2014), to examine the impact of export duties on Indonesian CPO exports. Significant variables that influence CPO prices in the international market, the rupiah exchange rate against the US dollar and the CPO export duty policy in 2011. The export duty policy has an impact on increasing the downstream CPO program
The same thing was stated in previous research conducted by Rifin (2014). He said that the implementation of export tax has negative effect on export, production, domestic CPO price and competitiveness. On the other hand, the policy especially the progressive export tax had been made a refined palm oil export to increase and be able to stabilize the cooking oil price.
INTRODUCTIONPalm oil has an important position
in Indonesian economy. First, palm oil is the main export commodity that produces high foreign exchange for the country. According to the Ministry of Agriculture (2016), from the twelve primary export commodities, palm oil ranks first in export by 2015 at 81.36% with a value of 15.38 billion US dollar. Second, palm oil is used as the main source of cooking oil in domestic.
Since 2006, the highest Crude Palm Oil (CPO) production in the world had been produced by Indonesia which is followed by Malaysia. While other countries such as Thailand, Nigeria and Colombia have a little contribution of the total. The growth of CPO export was encouraged by its demand and price which is competed with the most consumed vegetables oils, such as soybean, sunflower, rapeseed, and coconut oils (Sulistyanto & Akyuwen, 2011).
India plays an important role in the global edible oils market, accounting for 15.70 % share in consumption and 4.04 % share in oilseeds production in 2015. The production of India’s edible oils also increased over the years, following a similar trend to consumption, but the increase in production of domestic edible oils has been unable to keep pace with the increase consumption. Thus, this gap is being met by imports (Zakaria, Mohamed Salleh, & Balu, 2017). Furthermore,
Agro Ekonomi Vol. 29/No. 1, Juni 201820
Based on these conditions, the purpose of this study are (1) to provide an overview of the growth rate of CPO exports from Indonesia to India and (2) to identify the factors affecting the supply of Indonesian CPO exports in India.
METHODSThe type of data used in this study is
secondary data, which is a time series data from 1990 to 2015. The data was obtained from various sources, those are Food and Agriculture Organization (FAO), World Bank, International Monetary Fund (IMF), Central Bureau of Statistics (BPS), United States Department of Agriculture (USDA) and Directorate General of Plantation.
The analytical method used was standard growth rate to find out the growth rate of export volume of CPO Indonesia by India and Error Correction Model (ECM) method to know the factors that have short-term and long-term effects.
Measuring The Growth Rate:The approach used to look at the
position of a commodity in the market in the context of growth was a model of market share analysis. One of them is the Constant Market Share (CMS) model. Analysis of Constant Market Share (CMS) used to see how far the performance export of Indonesian CPO in the international market in the context
of growth, composition, distribution, and competition (Prasetyo & Marwanti, 2017).This study will only discuss about export growth with the equation used is the following CMS analysis:
g =
Description:g = The export growthEt = Total Indonesian CPO exports in
year (t)E(t-1) = The total Indonesian CPO exports
in the previous year (t-1)
Error Correction Model (ECM)The initial step in this research
was by conducting some analysis, for example Unit Root Test to know whether the data is used by stationer or not. After that, analysis for degree of integration as well as cointegration test to determine the relationship were done. Furthermore, to know the long-term relationship, this study used Engle-Granger Cointegration Test, while to know the short-term relationship, it used ECM. The application used to process the data in this study was EVIEWS 9.0. The steps are as follow:
The Unit Root Test and Integration Degrees Test
Unit root tes t or a lso ca l led stationary stochastic process was usually done in the estimation of economic model

21Agro Ekonomi Vol. 29/No. 1, Juni 2018
with time series data. This test can be done by using Augmented Dickey-Fuller (ADF) at the same test level (level or different) to obtain a stationary data, that the data whose variance is not too large and has a tendency to approach the average value. If the result of the test shows the value of ADF statistic is greater than Mackinnon critical value, it can be seen that the data is stationary because it does not contain the root unit. Conversely, if the ADF statistics of the Mackinnon critical value is smaller (the negative marks on the numbers do not affect the magnitude of the numbers alone), then it can be concluded that the data is not stationary at the degree level.
The next step is to test the degree of integration. This test is done if the stationary assumption does not met at the level. In this test, the observed variables are differentiated to a certain degree, so expect all variables to be stationer on the same degree.
Cointegrated Test with Engle-GrangerCointegration occurs when the
independent variable and the dependent variable are both trends, obtain that each is not stationary. But when both re-generate the resulting linear combination becomes stationary. Cointegration test is a method to indicate the possibility of a long-term relationship (equilibrium) between the dependent variable and the independent
variable. However, although there is a long-term equilibrium but in the short term it may not achieve balance (Muhammad, 2014)
There are several ways to perform the cointegration tests, among others, the Engle-Granger Cointegration Test, the Johansen Cointegration test and the Durbin-Watson Cointegration Regression Test. The method used in this study to examine the existence of cointegration is the Engle-Granger method. The Engle-Granger cointegration method used the Augmented Dickey-Fuller (ADF) method which consists of two stages. The first stage is to regress the OLS (Ordinary Least Square) equation and then find the residual of the equation. The second stage, the ADF test method is used to test the residuals of the equation. If the residual test results are significant at the level stage, then the residual variable is the stationer. This means that although the variables used are not stationary but in the long run, those variables tend to be in balance. Therefore, the linear combination of these variables is called as cointegration regression. Parameters generated from such combinations can be called long-term coefficients or cointegrated parameters (Yusuf & Widyastutik, 2007). The equation used to see the effect of the number of Indonesian CPO exports to India in the long-term by using cointegration test is as follows:

Agro Ekonomi Vol. 29/No. 1, Juni 201822
LOGVXCPOi = α + β1LOGHCPOI + β2LOGHMKed + β3LOGJPI + β4BEM + β5BEID
Description:VXCPOi = Volume of Indonesia’s CPO
Exports to India (Ton)Α = Constants or intersectionsβ1, β2.... = Regression coefficientsHCPOI = International CPO Price
(US$/ton)HMKed = Soybean oil price (US $ /
ton)JPI = Indian Population (People)BEM = Malaysian Export Duty (%)BEID = Indonesian Export tax (%)
Error Correction ModelECM (Error Correction Model)
is a model of econometric analysis that can be used to overcome the problem of time series data which individually is not stationary to return the equilibrium value in the long-term. The main requirement is the existence of cointegration relationships among the constituent variables. The emergence of ECM is to overcome the shortcomings of short-term and long-term consonance differences. Factors affecting the amount of Indonesian CPO exports to India in the short-term are as follow:
ΔLOGVXCPOi = α + β1ΔLOGHCPOI + β2ΔLOGHMKed + β3ΔLOGJPI + β4ΔBEM + β5ΔBEID
Description:VXCPOi = The volume of Indonesia’s
CPO Exports to India (Ton)α = Constants or intersections β1, β2... = Regression coefficientsHCPOI = International CPO Price
(US$/ton)HMKed = Soybean oil price (US$ / ton)JPI = Indian Population (People)BEM = Malaysian Export Duty (%)BEID = Indonesian Export tax (%)
RESULTS AND DISCUSSIONThe Growth Rate of Indonesian CPO Exports to India
On the 1st of August 2003, the Indian government began to enforce the policy of beta-carotene content in the CPO of 500-2,500 ppm. This resulted in the rejection of thousands tons of CPO from Indonesia because the CPO of Indonesian origin is still below the standard. As a result, the national entrepreneurs diverted CPO exports to a number of other countries. Both governments of Indonesia and India entered bilateral free trade agreements between the two countries beginning with the signing of the MoU within the framework of the II-CECA Indonesia - India (Comprehensive Economic Cooperation Agreement). The impact of this agreement is an increase in the sector that is considered to represent and contribute positively to the trade of both countries with CPO

23Agro Ekonomi Vol. 29/No. 1, Juni 2018
in 2009 is the global crisis (Ministry of Trade, 2010) and the weakening of CPO prices in the world market. The decrease of 25.36% from USD 862.94 metric ton in 2008 to USD 644.07 per metric ton in 2009 (Tuti Ermawati, 2013).
The decline in the number of exports starting in 2010 can also be related to one of the enforcement of CPO export tax rate according to the price of The regulation of Minister of Finance No.67/ PMK.011/2010 which requires CPO of 0-25%. The Regulation of Minister of Finance No. 128/PMK.011/2011, the regulation of Minister of Finance No.75/PMK.011/2012, and the regulation of Minister of Finance No.128/ PMK.011/2013 require flexible export duty of 0-22%.
as one of its commodities. The result of this agreement is the achievement of the 2008.
Trade target shows that the trade between the two countries has more than doubled (Ministry of Trade, 2010) . The increase in export volume in 2008 was also triggered by situation of the financial crisis and the global economic recession that impacted CPO prices fell sharply. As an illustration, CPO price Cif Rotterdam in July 2008 had reached US $ 1,200 / ton to US $ 700 / ton in the second week of October 2008. Between October 2008 and March 2009 CPO price reached US $ 483 / ton (Dradjat, 2011). Furthermore, one of the factors of the decline in volume and export value
The graph of the amount and value of Indonesian CPO exports to India can be seen in figure 1 with the calculation of growth rate in 2003-2015.
Figure 1. Growth rate of Indonesian CPO Exports to India

Agro Ekonomi Vol. 29/No. 1, Juni 201824
The Analysis Result of Indonesian CPO Export Volume Model to IndiaUnit Roots Test and Integration Degrees
The assumption is that if the value of the ADF t-statistic is greater than the Mackinnon critical value, it can be seen that the data is stationary because it does not contain the root unit or the probability value is smaller than the significant level used (5%). Based on the
ADF test in table 1, the data contains the root unit or the data are considered not stationer. Furthermore, if there is a root unit, then the study needs to do a second test (integration degree test) by using a first difference.
Root unit test results on first difference by using ADF can be seen in the Table 2. All variables of ADF test results on the first difference used
Table 1. ADF test results at level
Variable ADF t-Statistic MacKinnon Crictical Value 5% ProbLOG(VXCPOI) -2.595365 -3.603202 0.2850LOG(HCPOI) -2.384328 -3.603202 0.3779LOG(HMKED) -1.784382 -3.603202 0.6818LOG(JPI) -1.978860 -3.612199 0.5829BEM -3.310851 -3.644963 0.0917BEID -2.085538 -2.986225 0.2516
* stationary data
Source: Secondary Data Analysis, 2017
Table 2. ADF test results at first difference
Variabel ADFt-Statistik MacKinnon Crictical Value 5% ProbD(LOGVXCPOI) -4.9694 -3.6220 0.0031*D(LOGHCPOI) -4.8982 -3.6122 0.0036*D(LOGHMKED) -3.8730 -3.6121 0.0297*D(LOGJPI) -9.09380 -1.9564 0.0000*D(BEM) -4.7888 -3.6121 0.0043*D(BEID) -5.3285 -2.9918 0.0002*
*stationary data
Source: Secondary Data Analysis, 2017
Table 3. Engle-Granger test results
Variable ADF score Critical Value of Mac Kinnon Prob1% 5% 10%RESID1 -3.764576 -4.394309 -3.612199 -3.243079 0.0370*
Source: Secondary Data Analysis, 2017* stationary data
25Agro Ekonomi Vol. 29/No. 1, Juni 2018
in the study have been stationary both dependent and independent variables. The stationary can be seen from the value at the ADF t-statistic which is greater than the Mackinnon critical value.
Cointegration TestCointegration means that although
the individual is not stationary, the linear combination between these variables can be a stationary. The variables are said to be mutually cointegrated if there is a linear combination between the non stationary and residual variables of the linear combination must be stationary.
Based on the test results in table 3, RESID1 is the residual of the Indonesian CPO export volume regression equation to India. The equation shows that the stationary equation is at the level stage. This can be seen from the probability
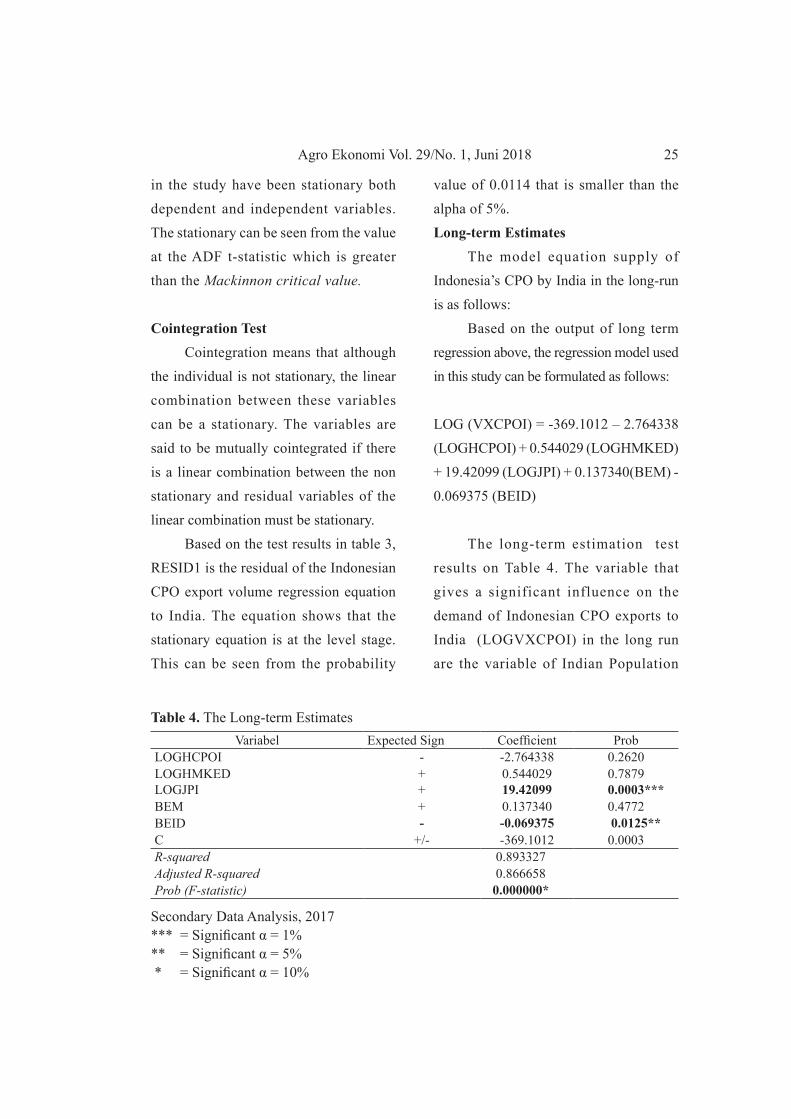
value of 0.0114 that is smaller than the alpha of 5%.Long-term Estimates
The model equation supply of Indonesia’s CPO by India in the long-run is as follows:
Based on the output of long term regression above, the regression model used in this study can be formulated as follows:
LOG (VXCPOI) = -369.1012 – 2.764338 (LOGHCPOI) + 0.544029 (LOGHMKED) + 19.42099 (LOGJPI) + 0.137340(BEM) - 0.069375 (BEID)
The long-term estimation test results on Table 4. The variable that gives a significant influence on the demand of Indonesian CPO exports to India (LOGVXCPOI) in the long run are the variable of Indian Population
Table 4. The Long-term EstimatesVariabel Expected Sign Coefficient Prob
LOGHCPOI - -2.764338 0.2620LOGHMKEDLOGJPI
++
0.54402919.42099
0.7879 0.0003***
BEM + 0.137340 0.4772BEID - -0.069375 0.0125**C +/- -369.1012 0.0003R-squared 0.893327Adjusted R-squared 0.866658Prob (F-statistic) 0.000000*
Secondary Data Analysis, 2017*** = Significant α = 1%** = Significant α = 5% * = Significant α = 10%
Agro Ekonomi Vol. 29/No. 1, Juni 201826
(LOGJPI) and Indonesian export duty (BEID). While the international price of CPO (LOGHCPOI), soybean oil price (LOGHMKED), Malaysian CPO export duty (BEM) have no significant effect, due to the critical value of these variables which exceeds the alpha value of 5%.
International CPO Price (LOGHCPOI)The probability of International
CPO price (LOGHCPOI) variable was 0.2620 which means that it is greater than α = 10% or 0.10. It means that the international CPO price had no significant effect on the supply of Indonesian CPO exports to India (LOGVXCPOI). Long time ago, India used domestic vegetable oil and then gradually switched to use imported palm oil due to the shortage of domestic supply. India has experienced a change in the consumption patterns. Although the price of CPO increases, the price of this commodity is still lower than the vegetable oil from other plant sources, so the increasing price of CPO does not significantly affect the amount of Indonesian CPO exports to India.
Soybean Oil Price (LOGHMKED)The probability of soybean oil
price variable (LOGHMKED) is 0.7879 which means that it is greater than α = 10% or 0.10. It means that the soybean oil price has no significant effect on the
supply of Indonesian CPO export to India (LOGVXCPOI).
The function of soybean oil tends to be the same as CPO oil which is the most widely used as foodstuff and can be used as biodesel. In other word, CPO is a substitute for soybean oil. Generally, in developing countries substitution effect comes from high CPO competitiveness, so that people in developing countries (India) tend to prefer cheaper oil (Saragih et al., 2013).
Indian Population (LOGJPI)The probability of Indian population
variable (LOGJPI) is 0.0003 which means that variable had significant effect on the supply of Indonesian CPO export to India (LOGVXCPOI). The coefficient of 19.4209 means that if there is any increase of Indian population by 1 percent, it will reduce the supply for Indonesian CPO exports to India by 19.42 percent. Similar results were also obtained from a research conducted by Alatas (2015), he mentioned that the increasing of Indian population will be followed by the increase of the amount of palm oil exported to India. Zakaria, Mohamed Salleh, & Balu (2017) observed that in the long run, the portion of Indian pulation aged between 15 and 64 years in relation to the total population also shapes the country’s importing pattern of palm oil.
27Agro Ekonomi Vol. 29/No. 1, Juni 2018
CPO Export Duty of Malaysia (BEM)The probability of CPO export duty
of Malaysia (BEM) is 0.4772 which is larger than α = 10%. It means that the variable does not have any significant effect on the supply of Indonesia’s CPO exports to India (LOGVXCPOI). This shows that any increase in CPO Export duty of Malaysia is not significantly would increase the supply of CPO Indonesia to India. This is because the Malaysian government since 1970 has restricted CPO exports by imposing high export taxes. Then starting January 1, 2013, the Government of Malaysia to change the policy of imposition of export duty for CPO in the country. Quotas are abolished and when CPO exports are subject to export duty in accordance with prevailing prices. It aims to encourage the downstream palm oil industry in Malaysia. In Indonesia the enthusiasm of downstream started in September 2011. Before September 2011, CPO export duties of Indonesia applied the same with its downstream products. Therefore, the number of Indonesian CPO exports to India is superior compared to Malaysian exports. However, for exports of CPO derivatives, Malaysia is superior to Indonesia (Pengkajian & Perdagangan, 2013)
Indonesian CPO Export tax (BEID)
Indonesian CPO export tax (BEID) variables had significant effect on for the supply of Indonesian CPO exports to
India (LOGVXCPOI). This can be seen in table 4 where the probability is 0.0125. The coefficient of -0.069375 means that if there is any increase of CPO export duties of Indonesia by 1 percent, it will reduce the supply for Indonesian CPO exports to India by 0.06 percent. Increasing the export duties of a commodity will affect the final price of the commodity and will also decrease the purchasing power of the consumer country. Similar results were also obtained from a research conducted by Munadi (2007) in which in his research, he mentioned that the decrease of export tax will be followed by the increase of the amount of palm oil exported to India.
Error Correct ion Model (ECM) Estimation
ECM is used to look at the short-term behavior of the regression equation by estimating the dynamics of the residuals. The ECM equation for Indonesia’s CPO export demand model by India derived from this research is as follows:
Based on the output of short term regression above , the regression model used in this study can be formulated as follows:
Δ ( L O G V X C P O I ) = - 0 . 9 2 5 9 8 9 -2.859935Δ(LOGHCPOI) + 2.762149Δ (LOGHMKED) + 79.72592 Δ(LOGJPI) + 0.139165 Δ(BEM) -0.089458 Δ(BEID)

Agro Ekonomi Vol. 29/No. 1, Juni 201828
International CPO Price D(LOGHCPOI) In the short-term, the probability
value of international CPO price variables (DLOGHCPOI) is 0.1619 which means that it is greater than 10 %. It shows the International CPO price variable (DLOGHCPOI) does not significantly affect the supply of Indonesian CPO exports to India (DLOGVXCPOI). Although the price of palm oil increases, palm oil being the cheapest among the edible oil segment is widely consumed among the Indian household.
Soybean Oil Price D(LOGHMKED) The probability value of soybean oil
price (DLOGHMKED) is 0.2291 which means that it is greater than 10 %. It shows that the soybean oil price variable (DLOGHCPOI) does not significantly affect the supply of Indonesian CPO exports to India (DLOGVXCPOI). This is because the amount of palm oil usage by
the Indian population is much more than the use of soybean oil
Indian Population D(LOGJPI) The probability value of Indian
population variable (DLOGJPI) is 0.4701
which means that it is greater than 10 %. It shows that the population variable (DLOGJPI) does not significantly affect the supply of Indonesian CPO exports to India (DLOGVXCPOI). The Indian population only affects in long-term Indonesian CPO exports.
CPO Export Duty of Malaysia D(BEM) The probability of export duty
of Malaysia D(BEM) is 0.3874 which indicates that the CPO export duty of Malaysia variable D(BEM) does not significantly affect the supply of Indonesian CPO exports to India (DLOGVXCPOI). Indonesia or Malaysia equally set export
Table 5. ECM Estimation Results (Short-term Estimation)Variable Expected Sign Coefficient ProbD(LOGHCPOI) - -2.859935 0.1619D(LOGHMKED)D(LOGJPI)
++
2.76214979.72592
0.22910.4701
D(BEM) + 0.139165 0.3874D(BEID) - -0.089458 0.0006C +/- -0.925989 0.6019RESID1(-1) - -0.907624 0.0010R-squared 0.733848Adjusted R-squared 0.645131Prob (F-stati stic) 0.000213
Source: Secondary Data Analysis, 2017*** = Significant α = 1% ** = Significant α = 5% * = Significant α = 10%
29Agro Ekonomi Vol. 29/No. 1, Juni 2018
tax for CPO depending on market price. Indonesia is superior in exporting CPO to India compared to Malaysia
Indonesian CPO Export tax D(BEID)Similar to the long-term estimation
of the model, the Indonesian CPO export tax (DBEID) has a negative and significant impact on the supply of Indonesian CPO export to India (DLOGVXCPOI). The coefficient of -0.089458 means that if there is an increase of CPO export duties of Indonesia by 1 percent, it will reduce the supply of Indonesian CPO export to India by 0.08 percent. The probability of 0.0006 indicates that Indonesian CPO export tax (DBEID) variables significantly affect the supply of Indonesian CPO export to India (DLOGVXCPOI). This is because the effect of CPO prices is lower than other vegetable oils. In developing countries, people’s consumption choices are limited by income (Pan et al., 2008).
Resid1 (-1) shows that the value of Error Correction Term (ECT) which serves to determine how quickly the equilibrium is recovered or in the other words the mechanism to return to long-term balance. The minus value on the coefficient and the significant on the probability indicate that a long-term Equilibrium works. The value of Error Correction Term (ECT) above is -0,486351, which means that 48 % of the
previous period imbalance is corrected in the current period.
CONCLUSION AND SUGGESTIONThe study found that the growth rate
of Indonesia’s CPO exports to India in 2003 to 2015 is fluctuate. This is due to the policy of free trade agreement, Indonesian CPO export tax and the economic circumstances (crisis) that affects it .
I ndones i a ’s CPO expor t s t o India (LOGVXCPOI) in the long term are influenced by Indian population (LOGJPI) and Indonesian CPO export tax (BEID). In the short term, Indonesia’s CPO exports to India (DLOGVXCPOI) is influenced by Indonesian CPO export tax (DBEID).
Based on this result of the research, the variables which significantly influence in the long and short term is the Indonesian CPO export duty. Therefore, the government in determining the fare of export duties should be expected to pay attention to the interests of palm oil business actors, domestic consumers and consumers abroad in order to obtain maximum profit.
REFERENCESAlatas, A. (2015). Trend Produksi dan
Ekspor Minyak Sawit (CPO) Indonesia. AGRARIS: Journal of Agribusiness and Rural Development Research, 1(2), 114–124. https://doi.org/10.18196/agr.1215
Agro Ekonomi Vol. 29/No. 1, Juni 201830
Central Bureau of Statistics. (2016). Negara Tujuan Ekspor Minyak S a w i t I n d o n e s i a . R e t r i e v e d February 20, 2017, from https://www.bps.go.id/linkTabelStatis/view/id/1026
Dewanta, A. S. , Arfani , R. N. , & Erfi ta . (2016). Elast ici ty and competitiveness of Indonesia’s palm oil export in India market. Economic Journal of Emerging Market, 8(2), 148–158.
Dradjat, B. (2011). Dampak Krisis Finansial Global dan Kebijakan Antisipatif Pengembangan Industri Kelapa Sawit. Analisis Kebijakan Pertanian, 9(3), 237–260.
Ministry of Agriculture. (2016). Statistik Perkebunan Indonesia 2015 -2017 Kelapa Sawit. Sekretariat Direktorat Jenderal Perkebunan.
Ministry of Trade. (2010). Misi Dagang Indonesia dan Bilateral ke India: Mendorong Kemitraan Kedua Negara yang Lebih Strategis. Siaran Pers.
Muhammad, M. (2014). Kointegrasi dan estimasi ecm pada data time series. Jurnal Konvergensi, 4(1), 41–51.
Munadi, E. (2007). Penurunan Pajak Ekspor Dan Dampaknya Terhadap Ekspor Minyak Kelapa Sawit Indonesia Ke
India (Pendekatan Error Correction Model). Jurnal Pertanian, 16(2), 1019–1036.
Pan, S., Mohanty, S., & Welch, M. (2008). India edible oil consumption: A censored incomplete demand approach. Journal of Agricultural a n d A p p l i e d E c o n o m i c s , 40(December), 821–835. Retrieved from http://www.aaec.ttu.edu/ceri/Published Papers/Journal Article/IndiaEdibleOilConsumption.pdf
Pengkajian, B., & Perdagangan, K. (2013). Analisis Kebijakan Bea Keluar ( BK ) CPO Dan Produk Turunannya.
Prasetyo, A., & Marwanti, S. (2017). Keunggulan Komparatif dan Kinerja Ekspor Minyak Sawit Mentah Indonesia di Pasar Internasional, 35(2), 89–103.
Rifin, A. (2014). The Effect of Progressive Export Tax on Indonesian Palm Oil Industry. Oil Palm Industry Economic Journal, 14(1), 1–8.
Saragih, F. H., Darwanto, D. H., & Masyhuri. (2013). Analisis Daya Saing Ekspor Minyak Kelapa Sawit (CPO) Sumatera Utara di Indonesia. Agro Ekonomi, 24(1), 37–49.
Sulistyanto, A. I., & Akyuwen, R. (2011). Factors Affecting the Performance of

31Agro Ekonomi Vol. 29/No. 1, Juni 2018
Indonesia ’ s Crude Palm Oil Export, 4, 281–289.
Syadullah, M. (2014). Dampak Bea Keluar Terhadap Ekspor CPO Indonesia. Kajian Ekonomi Dan Keuangan, 18(3), 241–254.
Tuti Ermawati, Y. S. (2013). Kinerja ekspor minyak kelapa sawit indonesia. Buletin Ilmiah Litbang Perdagangan, 7(10), 129–148.
Yusuf, & Widyastutik. (2007). Analisis Pengaruh Ekspor-Impor Komoditas Pangan Utama dan Liberalisasi Perdagangan Terhadap Neraca Perdagangan Indonesia. Jurnal Manajemen Agribisnis, IV(1), 46–56.
Zakaria, K., Mohamed Salleh, K., & Balu, N. (2017). Factors Affecting Palm Oil Demand in India. Oil Palm Industry Economic Journal, 17(2), 25–33.