tesis noemi puig moron para deposito...
TRANSCRIPT

UNIVERSIDAD DE SALAMANCA
DEPARTAMENTO DE MEDICINA
HEMATOLOGÍA
TESIS DOCTORAL
OPTIMIZACIÓN Y ANÁLISIS CRÍTICO DEL ESTUDIO DE LA
MONITORIZACIÓN DE ENFERMEDAD MÍNIMA RESIDUAL
MEDIANTE ASO RQ‐PCR EN PACIENTES CON MIELOMA
MÚLTIPLE. COMPARACIÓN CON LA CITOMETRÍA DE FLUJO
Noemí Puig Morón
2013


La presente tesis doctoral corresponde a un compendio de 3 trabajos previamente
publicados o aceptados para publicación, que se especifican a continuación:
1) Kappa deleting element as an alternative molecular target for minimal residual
disease assessment by real‐time quantitative PCR in patients with multiple
myeloma
Noemí Puig1, María E. Sarasquete1,2, Miguel Alcoceba1,2, Ana Balanzategui1, María C.
Chillón1,2, Elena Sebastián1, Marcos González Díaz1,2, Jesús F. San Miguel1,2 y Ramón
García Sanz1,2
1Servicio de Hematología, Hospital Universitario de Salamanca; 2Centro de
Investigación del Cáncer (CIC), Campus Miguel de Unamuno, Universidad de
Salamanca
European Journal of Haematology 2012; 89: 328‐335; DOI: 10.1111/ejh. 12000
2) The use of CD138 positively selected marrow samples increases the applicability of
minimal residual disease assessment by PCR in patients with multiple myeloma
Noemí Puig1, María E. Sarasquete1,2, Miguel Alcoceba1,2, Ana Balanzategui1, María C.
Chillón1,2, Elena Sebastián1, Luis A. Marín1, Marcos González Díaz1,2, Jesús F. San
Miguel1,2 y Ramón García Sanz1,2
1Servicio de Hematología, Hospital Universitario de Salamanca; 2Centro de
Investigación del Cáncer (CIC), Campus Miguel de Unamuno, Universidad de
Salamanca
Annals of Hematology 2013, 92: 97‐100; DOI: 10.1007/s00277‐012‐1566‐3
3) Critical evaluation of ASO RQ‐PCR for minimal residual disease evaluation in
multiple myeloma. A comparative analysis with flow cytometry
Noemí Puig1, María E. Sarasquete1, Ana Balanzategui1, Joaquín Martínez2, Bruno
Paiva1, Herbert García1, Silvia Fumero1, Cristina Jiménez1, Miguel Alcoceba1, María C
Chillón1, Elena Sebastián1, Luis Marín1, María A. Montalbán2, María V. Mateos1,
Albert Oriol3, Luis Palomera4, Javier de la Rubia5, María B Vidriales1, Joan Bladé6,
Juan José Lahuerta2, Marcos González Díaz1, Jesús F San Miguel1, Ramón García
Sanz1

N. Puig ‐ EMR en MM
‐ 4 ‐
1Servicio de Hematología, Hospital Universitario de Salamanca; IBSAL; IBMCC (USAL‐
CSIC), Salamanca
2Servicio de Hematología, Hospital 12 de Octubre, Madrid
3Servicio de Hematología, Hospital Germans Trias I Pujol, Badalona
4Servicio de Hematología, Hospital Clínico Lozano Blesa, Zaragoza
5Servicio de Hematología, Hospital Universitario La Fe, Universidad Católica San
Vicente Mártir, Valencia
6Servicio de Hematología, Hospital Clinic I Provincial, Barcelona
Enviado a Leukemia (JILL13‐LEU‐0580); reenviado con correcciones el 17/6/2013.
D. Jesús F. San Miguel Izquierdo, Catedrático de Hematología y Jefe de Servicio de
Hematología del Hospital Clínico Universitario de Salamanca, D. Marcos González Díaz, Doctor
en Medicina, Profesor Titular de la Facultad de Medicina y Jefe de Sección del Departamento
de Hematología del Hospital Clínico Universitario de Salamanca y D. Ramón García Sanz,
Doctor en Medicina, Profesor Asociado de la Facultad de Medicina y Médico Adjunto del
Hospital Clínico Universitario de Salamanca,
CERTIFICAN:
Que el trabajo doctoral por compendio de artículos realizado bajo su dirección por Dª
Noemí Puig Morón, titulado “OPTIMIZACIÓN Y ANÁLISIS CRÍTICO DE LA MONITORIZACIÓN DE
ENFERMEDAD MÍNIMA RESIDUAL MEDIANTE ASO RQ‐PCR EN PACIENTES CON MIELOMA
MÚLTIPLE. COMPARACIÓN CON LA CITOMETRÍA DE FLUJO”, reúne las condiciones de
originalidad requeridas para optar al grado de Doctor en Medicina por la Universidad de
Salamanca.
Y para que así conste, firman la presente certificación en Salamanca, a 9 de Julio de 2013
Fdo. Prof. Jesús F. San Miguel Fdo. Dr. Marcos González Díaz Fdo. Dr. Ramón García Sanz

N. Puig ‐ EMR en MM
‐ 6 ‐

Glosariodeabreviaturas

N. Puig ‐ EMR en MM
‐ 8 ‐
Introducción
‐ 9 ‐
AG: antígeno
ASO: oligonucleótido específico de alelo
BCR: receptor de célula B
C: región constante
CDR: región determinante de complementariedad
CMF: citometría de flujo
CP: célula plasmática
CPN: célula plasmática normal
CPP: célula plasmática patológica
CT: ciclo umbral
D: región de diversidad
EF: electroforesis
EMR: enfermedad mínima residual
FR: región conservada
IF: inmunofijación
IG: inmunoglobulina
IgH: cadenas pesadas de las inmunoglobulinas
IGH: genes de las cadenas pesadas de las inmunoglobulinas
IgK: cadenas ligeras kappa de las inmunoglobulinas
IGK: genes de las cadenas ligeras kappa de las inmunoglobulinas
IgL: cadenas ligeras lambda de las inmunoglobulinas
IGL: genes de las cadenas ligeras lambda de las inmunoglobulinas
J: región de unión
: kappa
Kb: kilobases
: lambda
LB: linfocito B
MM: mieloma múltiple
MO: médula ósea
NA: no alcanzado/a
PB: pares de bases
PCR: reacción en cadena de la polimerasa
RC: repuesta completa

N. Puig ‐ EMR en MM
‐ 10 ‐
RQ‐PCR: reacción en cadena de la polimerasa cuantitativa en tiempo real
RSS: secuencia señal de la recombinación
SG: supervivencia global
SIG: inmunoglobulina de superficie
SLP: supervivencia libre de progresión
TASPE: trasplante autólogo de sangre periférica
TDT: deoxinucleotidil transferasa terminal
TPH: trasplante de progenitores hematopoyéticos
V: región variable

Índice

N. Puig ‐ EMR en MM
‐ 12 ‐

Introducción
‐ 13 ‐
INTRODUCCIÓN
1 GENERALIDADES SOBRE EL MIELOMA MÚLTIPLE
2 TRATAMIENTO DEL MIELOMA MÚLTIPLE
3 DETECCIÓN DE ENFERMEDAD TRAS TRATAMIENTO EN PACIENTES CON MIELOMA
MÚLTIPLE
3.1 Criterios de respuesta al tratamiento
3.2 Estrategias para la detección de enfermedad residual tras tratamiento
4 ESTUDIOS MOLECULARES PARA LA DETECCIÓN DE ENFERMEDAD RESIDUAL EN
MIELOMA MÚLTIPLE
4.1 ONTOGENIA DE LA CÉLULA TUMORAL
4.2 RECEPTOR DE LA CÉLULA B
4.2.1 Genes de las inmunoglobulinas
4.2.1.1 Variabilidad genética de las inmunoglobulinas
4.2.2 Diferenciación linfoide B normal
4.2.2.1 Maduración independiente del antígeno
4.2.2.1.1 Recombinación secuencial de los genes de las inmunoglobulinas durante la
diferenciación linfoide B
4.2.2.1.2 Mecanismo de recombinación VH‐JH
4.2.2.1.3 Estructura de la unión VH‐JH
4.2.2.1.4 Edición del receptor
4.2.2.2 Maduración dependiente del antígeno
4.2.2.2.1 Hipermutación somática
4.2.2.2.2 Cambio de isotipo
4.3 DETECCIÓN DE ENFERMEDAD MÍNIMA RESIDUAL EN MIELOMA MEDIANTE PCR
4.3.1 Análisis de los estudios sobre detección de enfermedad mínima residual en mieloma
mediante PCR
HIPÓTESIS DE TRABAJO Y OBJETIVOS
MATERIAL, MÉTODOS Y RESULTADOS
1. Artículo 1: Kappa deleting element as an alternative molecular target for minimal
residual disease assessment by real‐time quantitative PCR in patients with multiple
myeloma
2. Artículo 2: The use of CD138 positively selected marrow samples increases the
applicability of minimal residual disease assessment by PCR in patients with multiple
myeloma
3. Artículo 3: Critical evaluation of ASO RQ‐PCR for minimal residual disease evaluation in
multiple myeloma. A comparative analysis with flow cytometry
CONCLUSIONES
BIBLIOGRAFÍA

N. Puig ‐ EMR en MM
‐ 14 ‐

Introducción
‐ 15 ‐
Introducción

N. Puig ‐ EMR en MM
‐ 16 ‐
Introducción
‐ 17 ‐
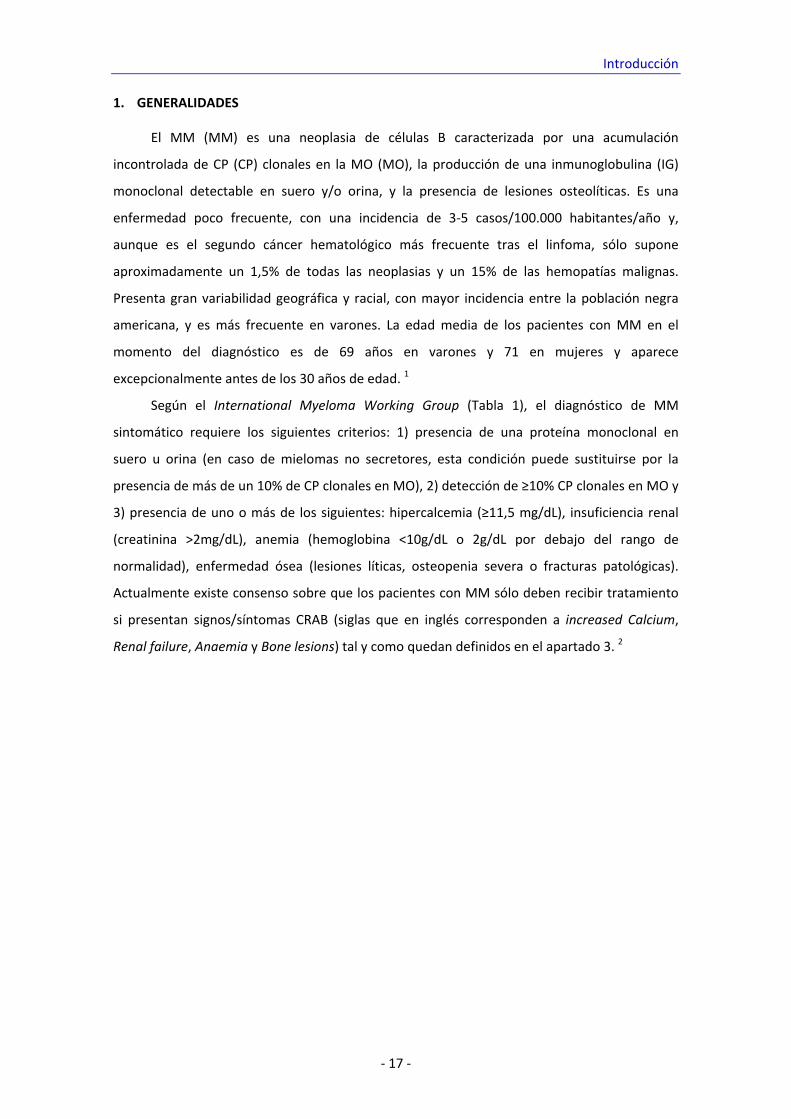
1. GENERALIDADES
El MM (MM) es una neoplasia de células B caracterizada por una acumulación
incontrolada de CP (CP) clonales en la MO (MO), la producción de una inmunoglobulina (IG)
monoclonal detectable en suero y/o orina, y la presencia de lesiones osteolíticas. Es una
enfermedad poco frecuente, con una incidencia de 3‐5 casos/100.000 habitantes/año y,
aunque es el segundo cáncer hematológico más frecuente tras el linfoma, sólo supone
aproximadamente un 1,5% de todas las neoplasias y un 15% de las hemopatías malignas.
Presenta gran variabilidad geográfica y racial, con mayor incidencia entre la población negra
americana, y es más frecuente en varones. La edad media de los pacientes con MM en el
momento del diagnóstico es de 69 años en varones y 71 en mujeres y aparece
excepcionalmente antes de los 30 años de edad. 1
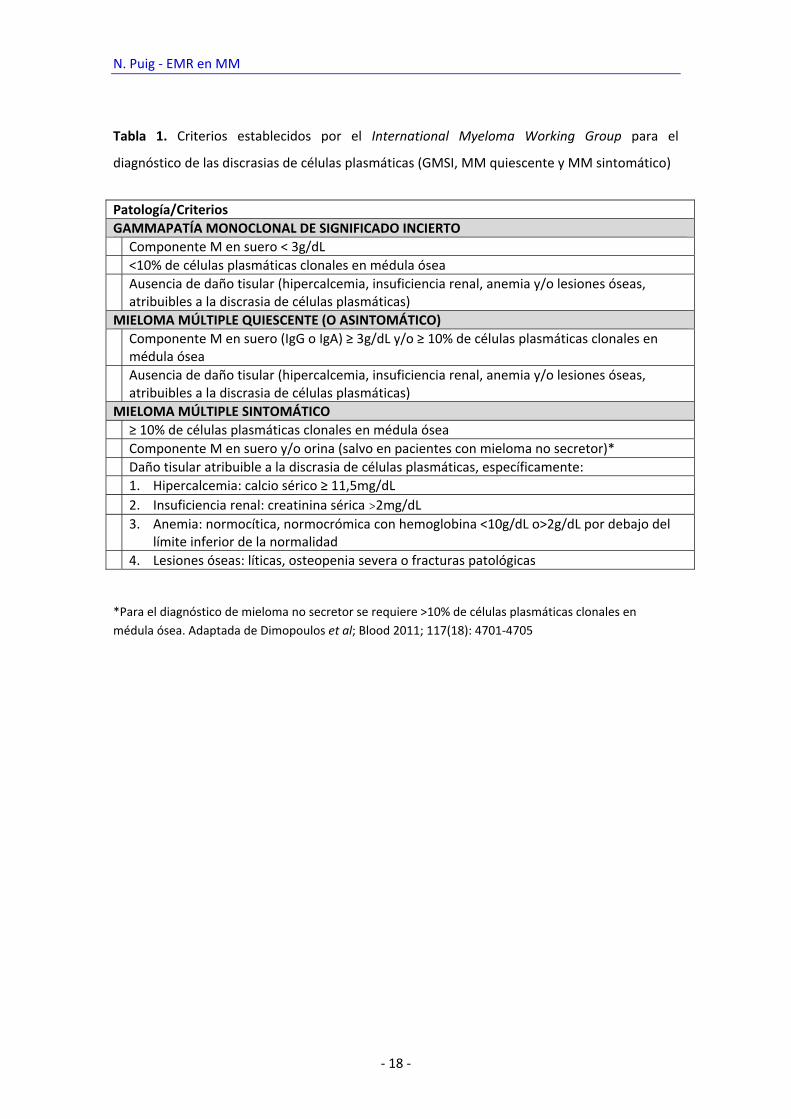
Según el International Myeloma Working Group (Tabla 1), el diagnóstico de MM
sintomático requiere los siguientes criterios: 1) presencia de una proteína monoclonal en
suero u orina (en caso de mielomas no secretores, esta condición puede sustituirse por la
presencia de más de un 10% de CP clonales en MO), 2) detección de ≥10% CP clonales en MO y
3) presencia de uno o más de los siguientes: hipercalcemia (≥11,5 mg/dL), insuficiencia renal
(creatinina >2mg/dL), anemia (hemoglobina <10g/dL o 2g/dL por debajo del rango de
normalidad), enfermedad ósea (lesiones líticas, osteopenia severa o fracturas patológicas).
Actualmente existe consenso sobre que los pacientes con MM sólo deben recibir tratamiento
si presentan signos/síntomas CRAB (siglas que en inglés corresponden a increased Calcium,
Renal failure, Anaemia y Bone lesions) tal y como quedan definidos en el apartado 3. 2
N. Puig ‐ EMR en MM
‐ 18 ‐
Tabla 1. Criterios establecidos por el International Myeloma Working Group para el
diagnóstico de las discrasias de células plasmáticas (GMSI, MM quiescente y MM sintomático)
*Para el diagnóstico de mieloma no secretor se requiere >10% de células plasmáticas clonales en
médula ósea. Adaptada de Dimopoulos et al; Blood 2011; 117(18): 4701‐4705
Patología/Criterios
GAMMAPATÍA MONOCLONAL DE SIGNIFICADO INCIERTO
Componente M en suero < 3g/dL
<10% de células plasmáticas clonales en médula ósea
Ausencia de daño tisular (hipercalcemia, insuficiencia renal, anemia y/o lesiones óseas, atribuibles a la discrasia de células plasmáticas)
MIELOMA MÚLTIPLE QUIESCENTE (O ASINTOMÁTICO)
Componente M en suero (IgG o IgA) ≥ 3g/dL y/o ≥ 10% de células plasmáticas clonales en médula ósea
Ausencia de daño tisular (hipercalcemia, insuficiencia renal, anemia y/o lesiones óseas, atribuibles a la discrasia de células plasmáticas)
MIELOMA MÚLTIPLE SINTOMÁTICO
≥ 10% de células plasmáticas clonales en médula ósea
Componente M en suero y/o orina (salvo en pacientes con mieloma no secretor)*
Daño tisular atribuible a la discrasia de células plasmáticas, específicamente:
1. Hipercalcemia: calcio sérico ≥ 11,5mg/dL
2. Insuficiencia renal: creatinina sérica >2mg/dL
3. Anemia: normocítica, normocrómica con hemoglobina <10g/dL o>2g/dL por debajo del límite inferior de la normalidad
4. Lesiones óseas: líticas, osteopenia severa o fracturas patológicas
Introducción
‐ 19 ‐
2. TRATAMIENTO DEL MIELOMA MÚLTIPLE
El MM es, todavía, una enfermedad básicamente incurable. Durante 3 décadas (1969‐
1989), el tratamiento se basó en la combinación de melfalán y prednisona, con la que se
obtenía algún tipo de respuesta en el 55‐60% de los pacientes, con excepcionales respuestas
completas (RCs) y una mediana de supervivencia de 2,5‐3 años. La introducción de pautas de
poliquimioterapia como VAD (vincristina, adriamicina, dexametasona), VBMCP (vincristina,
BCNU, melfalán, ciclofosfamida y prednisona), VBAD (vincristina, BCNU, adriamicina,
dexametasona), etc., incrementó inicialmente el índice de respuestas en algunas series, sin
traducción sin embargo en una mejora de la supervivencia. En 1983, McElwain et al
demuestran una relación dosis‐respuesta con dosis altas de melfalán, consiguiendo remisiones
en pacientes previamente resistentes.3 Estos resultados, confirmados por los mismos autores
en 1987 y por Barlogie et al en 1988 sentaron las bases para la introducción del transplante de
progenitores hematopoyéticos en los esquemas terapéuticos del MM4;5. El Intergroupe
Française du Myelome (IFM), en un ensayo randomizado comparando trasplante de
progenitores hematopoyéticos versus quimioterapia convencional, demostró mejores
resultados en cuanto a RCs, supervivencia libre de progresión (SLP) y supervivencia global (SG)
en la rama de TPH.6 Estos resultados fueron confirmados en un estudio del MRC7, aunque
otros estudios multicéntricos, incluido el del grupo español PETHEMA8, no demostraron
ventaja del TPH sobre la quimioterapia convencional en cuanto a SG. Pese a estos resultados
contradictorios, el consenso actual es que melfalán (200mg/m2) con soporte de progenitores
hematopoyéticos es un tratamiento efectivo y seguro en MM y se considera el estándar en
pacientes menores de 65 años. El índice de RCs post‐TPH en un paciente previamente tratado
con quimioterapia convencional es entre 20 y 40% y la mediana de supervivencia de 4,5‐5
años.
En la última década se han desarrollado nuevos fármacos tales como los
inmunomoduladores y los inhibidores de proteasomas que actúan tanto sobre las CP
patológicas como sobre el microambiente medular9 y que, tras haber demostrado eficacia en
pacientes con MM refractario o en recaída10‐24 se han utilizado en enfermos de nuevo
diagnóstico.25‐43La incorporación de estos agentes al tratamiento tanto de pacientes
jóvenes30;39;43 como mayores32;36;41 ha incrementado significativamente la tasa de respuesta,
incluida la tasa de RCs, lo que también se ha traducido en un beneficio en la SLP y en la SG.
N. Puig ‐ EMR en MM
‐ 20 ‐
3. DETECCIÓN DE ENFERMEDAD TRAS TRATAMIENTO EN PACIENTES CON MIELOMA
MÚLTIPLE
3.1. Criterios de respuesta al tratamiento
En la era pre‐trasplante, los criterios de respuesta más utilizados fueron los propuestos
por el Chronic Leukemia‐Myeloma Task Force y los del Southwest Oncology Group, ambos
basados en el porcentaje de reducción de la paraproteína en suero y/o orina medida mediante
técnicas electroforéticas. 44‐46 Con el uso de melfalán a altas dosis, el grupo del Hospital Royal
Marsden publicó en el año 1983 por primera vez una tasa relativamente elevada de RCs
(50%),3;47 definida como la desaparición de la paraproteína en la electroforesis (EF). La
introducción de la inmunofijación (IF) como método de detección de la paraproteína en la
definición de RC se debe al grupo de Arkansas, en 1989. 48 Así, la EF y la IF coexistieron durante
un tiempo hasta la publicación de los criterios de respuesta del EBMT (European group for
Blood and Marrow Transplantation) en 1998, elaborados por consenso de los representantes
del subcomité de mieloma del mismo, del Myeloma Working Group y del International Bone
Marrow Registry. 49 La clasificación establece criterios de respuesta, progresión y recidiva y,
como novedad, define RC como la desaparición de la paraproteína por IF, exigiendo además la
desaparición de todos los plasmocitomas y la detección de < 5% CP en MO. Recientemente, el
International Myeloma Working Group ha modificado algunos de los criterios de
repuesta/progresión con el propósito de homogeneizar la terminología empleada en los
ensayos clínicos. Recoge categorías ampliamente utilizadas no reconocidas sin embargo por el
EBMT, tales como muy buena respuesta parcial (VGPR, >90% de reducción de la paraproteína
por EF) y “casi RC” (nCR: EF negativa, IF positiva), unificándolas como VGPR, e incluye remisión
completa estricta (Stringent CR) como categoría superior a la RC en la que la desaparición de la
paraproteína por IF se acompaña de ausencia de detección de clonalidad en MO por
inmunohistoquímica o inmunofluorescencia así como la normalización del ratio / en el test
de cadenas ligeras libres en suero.50

Introducción
‐ 21 ‐
Tabla 2. Criterios de respuesta y progresión en pacientes con mieloma múltiple establecidos
por el International Myeloma Working Group.
REMISIÓN COMPLETA IF negativa en suero y orina <5% CP en MO Desaparición de los plasmocitomas
REMISIÓN COMPLETA ESTRICTA
Todos los criterios de la remisión completa
Normalización del ratio / en el test de cadenas ligeras libres en suero Ausencia de CP clonales en MO por inmunohistoquímica o inmunofluorescencia
MUY BUENA RESPUESTA PARCIAL
CM detectable en suero u orina por IF pero no por EF o
>90% del CM sérico y <100mg/24h de paraproteína en orina
REMISIÓN PARCIAL ≥50% del CM en suero
del CM en orina/24h ≥90% o hasta <200mg/24h
ENFERMEDAD ESTABLE
No se cumplen los criterios de otros tipos de respuesta
RECIDIVA CLÍNICA
>25% del CM o incremento absoluto >0,5g/dL
>25% de la paraproteína en orina/24h o >200mg/24h CP en MO>10%
del tamaño de las lesiones óseas o plasmocitomas Aparición de nuevas lesiones líticas o plasmocitomas Hipercalcemia (>11,5mg/dL) no atribuible a otra causa
EF: electroforesis, IF: inmunofijación, CP: células plasmáticas, MO: médula ósea, CM: componente M, : incremento, : reducción; Adaptado de Durie et al; Leukemia 2007; 21:1134
N. Puig ‐ EMR en MM
‐ 22 ‐
3.2. Estrategias para la detección de enfermedad residual tras tratamiento
La persistencia de enfermedad en pacientes con MM tras tratamiento puede evaluarse a
través de la célula tumoral, la paraproteína o la sintomatología clínica. En cuanto a la primera,
el análisis histológico o citomorfológico de muestras de MO es rápido, relativamente sencillo y
barato, aunque de baja sensibilidad y especificidad, dado que la infiltración medular por
mieloma suele ser parcheada (y por tanto el recuento con frecuencia inexacto)51 y, además, en
la mayoría de los casos no se puede distinguir entre CP normales y patológicas. La
paraproteína o componente M se ha detectado durante décadas mediante EF, técnica sencilla
y de bajo coste pero también de sensibilidad limitada (0,2‐0,6 g/L).4;51;52 La introducción de la IF
como técnica para la detección de la paraproteína en suero y/o orina ha supuesto un aumento
en la sensibilidad (0,12‐0,25g/L) con respecto a la EF. Más recientemente, la cuantificación en
suero mediante nefelometría de cadenas ligeras libres y (circulantes como monómeros o
dímeros, pero no ligadas a la cadena pesada de la IG) podría tener mayor sensibilidad que la IF,
aunque los resultados todavía deben ser confirmados.53;54 En los últimos años también se ha
sugerido que el estudio de lesiones residuales por técnicas de imagen como la resonancia
magnética o la tomografía por emisión de positrones (PET) podría ser útil en la evaluación de
pacientes con mieloma en RC, aunque su valor pronóstico también ha de ser confirmado. 55‐57
Así, parece obvia la necesidad de incluir nuevas técnicas para mejorar la evaluación de la
calidad de la respuesta en pacientes con MM. La CMF empezó a usarse hace ya más de 20 años
como herramienta para el estudio de EMR post‐quimioterapia en leucemias agudas
demostrando gran valor clínico.58‐63 Esta técnica permite analizar simultáneamente múltiples
características de una célula en un gran número de células y en poco tiempo, con la posibilidad
de almacenar la información generada para su análisis o revisión posterior. Las CPs se
identifican mediante el análisis simultáneo de los antígenos (AGs) CD38 y CD13864‐67 y pueden
cuantificarse, para lo que se recomienda la adquisición de entre 0,2 y 1x10⁵ eventos de la
celularidad total. 65;68‐70 Para la detección de EMR se requiere la caracterización detallada de las
CPs y así, varios estudios han demostrado que el perfil de expresión antigénica de las CP
patológicas (CPP) permite diferenciarlas de las CP normales (CPN) , concretamente en base a la
infraexpresión de CD19, CD27, CD38 y CD45, la sobreexpresión de CD28, CD33 y CD56 y/o la
expresión asíncrona de CD20, CD117 y sIg.71‐74 Mediante esta estrategia podemos establecer
en cada enfermo el perfil aberrante “mielomatoso” de la CP tumoral, diferente del de las CPN.
Estudios dilucionales han demostrado que la CMF de 4 colores es capaz de discriminar entre
CPP y CPN con una sensibilidad de 10‐4 en 2/3 de los casos e incluso es capaz de alcanzar 10‐5
en el tercio restante, independientemente del tipo de perfil de expresión empleado para
Introducción
‐ 23 ‐
distinguirlas.65 Entre las posibles desventajas del uso de la CMF para el estudio de EMR en MM
se encuentra la ausencia de marcadores tumorales específicos en la CP y la posibilidad de
cambios fenotípicos durante la evolución de la enfermedad.75;76 Sin embargo, el uso de
combinaciones de varios anticuerpos monoclonales permite la identificación inequívoca de
CPP en >95% de los pacientes. 77;78 Por otro lado, los cambios fenotípicos descritos en varios
estudios79;80 pueden atribuirse a problemas técnicos y/o a AGs irrelevantes para la definición
del fenotipo aberrante, ya que otras series con estrategias mejor dirigidas no han confirmado
tales resultados.68;81;82 Finalmente, otro inconveniente podría ser que la CMF sólo analiza el
compartimento medular y dentro del mismo sólo las CP, de manera que tanto la enfermedad
extramedular como LB con igual VH‐JH que la CP potencialmente implicados en la recaída o
progresión de la enfermedad quedarían ocultos para la CMF traduciéndose en falsos negativos.
83;84 Sin embargo, ni la existencia ni el papel patogénico de tales LB clonales ha sido
definitivamente probado todavía.85
Los primeros trabajos publicados en MM datan del año 2002, en que San Miguel et al
observaron un porcentaje superior de casos con EMR negativa en 47 pacientes con mieloma
tratados con trasplante autólogo de sangre periférica (TASPE) comparado con 40 pacientes
que habían recibido quimioterapia convencional (36% vs 15%, p=0,04).68 Estos resultados
fueron confirmados ese mismo año por el grupo de Leeds en 45 pacientes sometidos a TASPE
en los que la detección de EMR por CMF (42% de los casos) se asociaba a menor SLP aun sin
impacto en la SG.81 Más recientemente, los resultados del análisis de pacientes tratados según
el protocolo GEM2000 han mostrado el valor pronóstico de la erradicación de la EMR por CMF
en cuanto a SLP y SG, apreciable incluso entre aquéllos pacientes que habían alcanzado RC con
IF negativa. Así, la mediana de la SLP en el grupo de pacientes con y sin EMR detectable por
CMF fue de 71 vs 37 meses (p <0,001) respectivamente y la mediana de SG no alcanzada (NA)
vs 89 meses (p=0,002). Además, la SLP de los pacientes con EMR indetectable por CMF e IF
positiva fue superior a la de aquéllos con EMR detectable e IF negativa, confirmando así la
importancia clínica del análisis de la EMR por CMF. 86 Resultados similares han sido
recientemente comunicados por el grupo inglés.

N. Puig ‐ EMR en MM
‐ 24 ‐
4. ESTUDIOS MOLECULARES PARA LA DETECCIÓN DE ENFERMEDAD MÍNIMA RESIDUAL EN
MIELOMA MÚLTIPLE
4.1. Ontogenia de la célula tumoral
Se acepta que el origen de la célula tumoral del mieloma es un linfocito B (LB) post‐
germinal de larga supervivencia que ha sufrido el cambio de isotipo y el proceso de
hipermutación somática en los órganos linfoides secundarios. Esta célula se traslada
posteriormente a la MO donde consigue sobrevivir gracias al contacto con las células del
estroma.87
Los LB maduros reconocen AGs extraños mediante receptores de membrana llamados
receptores de la célula B (BCR o B‐cell receptor). La diferenciación de los progenitores B en LB
maduros tiene lugar en la MO, regulada por interacciones con las células del estroma
medular.88;89 Posteriormente, los LB viajan hasta los órganos linfoides secundarios (bazo,
ganglios linfáticos y tejido linfoide asociado a mucosas) donde se produce la maduración
dependiente de AG, principalmente en los centros germinales de los folículos linfoides.90;91 La
respuesta inmune que se produce en los órganos linfoides secundarios requiere la presencia
de macrófagos, células presentadoras de AG, linfocitos T y LB maduros.92;93 En este ambiente
se produce el contacto entre los LB y los AGs, tras el cual aquellos LB capaces de reconocer
AGs extraños proliferan y aumentan la afinidad de su BCR con el AG mediante el proceso de
hipermutación somática.94;95 Es también en este ambiente donde los LB pueden cambiar el
isotipo de sus IGs con el fin de disponer de funciones efectoras diferentes. Tras la maduración
dependiente de AG, los LB se diferencian a células de memoria o a CP productoras de
anticuerpos.96
4.2. Receptor de la célula B
Los LB presentan en su membrana unas moléculas de carácter proteico denominadas
IGs que son responsables del reconocimiento antigénico característico de la inmunidad
específica.93 Aunque todas las células humanas tienen la dotación genética necesaria para la
síntesis de tales proteínas, sólo se expresan en los LB.97;98
Hay 5 tipos de IGs (G, A, D, E y M), diferentes por su tamaño, carga, composición de
aminoácidos y contenido de carbohidratos.99 Estructuralmente, las IG se componen de 2
cadenas polipeptídicas ligeras idénticas (IgL) y otras 2 pesadas (IgH) de mayor peso molecular
también idénticas y unidas entre sí por puentes disulfuro.97 Ambos tipos de cadenas están
formadas por dos regiones distintas, una constante (C) en la región carboxiterminal y otra

Introducción
‐ 25 ‐
variable (V) en el extremo aminoterminal.100 El tipo de IG se define por la región constante de
la cadena pesada: M, D, A1, A2, G1, G2, G3, G4 y E. Las regiones constantes de las IgH están
compuestas por 3 ó 4 dominios globulares y, en algunos casos, contienen regiones “bisagra”
que mejoran la adaptación al AG al posibilitar el funcionamiento independiente de los
heterodímeros. Por su parte, las regiones constantes de las cadenas ligeras también presentan
pequeñas variaciones que distinguen los dos tipos de cadenas: kappa () y lambda (). La
molécula de BCR o IG de superficie se asocia a un heterodímero (CD79/β) que interviene en
la transmisión de señales transmembrana.101
Figura 1: Estructura básica de una molécula de inmunoglobulina IgG.
Funcionalmente, las regiones variables están implicadas en el reconocimiento antigénico
(región Fab) mientras que las regiones constantes participan en funciones efectoras celulares
(región Fc), como las señales de transducción transmembrana, siendo además las responsables
de la unión de las IG a los tejidos, células del sistema inmune y proteínas del sistema del
complemento.102
Membrana del linfocito B
IgH IgH
IgL IgL
VL VL
VHVH
CH1 CH1
CLCL
CH 2 CH 2
CH 3 CH 3
Heterodímeroasociado a la Ig(CD79)
h h
N. Puig ‐ EMR en MM
‐ 26 ‐
4.2.1. Genes de las inmunoglobulinas
Cada una de las partes de la molécula de IG, tanto la región constante como la variable,
están codificadas por distintos genes. La región constante se codifica a partir de los segmentos
génicos C, mientras que la región variable se obtiene de la combinación de varios segmentos
génicos V (Variability), D (Diversity, sólo en las cadenas pesadas) y J (Joining).103 Esta
recombinación génica se traduce en una gran variabilidad proteica, necesaria e idónea para el
reconocimiento antigénico, y permite el ahorro de material genético. Además, como cada
linfocito reordena estos segmentos génicos de manera única, representa un marcador
altamente específico, ya que la probabilidad de encontrar dos linfocitos con el mismo
reordenamiento es prácticamente nula.103;104 Esto, a su vez, se convierte en una diana ideal
para el seguimiento de la enfermedad mínima residual (EMR) en el caso de la células tumoral,
ya que la presencia de estos reordenamientos identifica específicamente a dicha célula y la
distingue de las células normales, que o carecen del reordenamiento de IG o tienen otro
diferente.
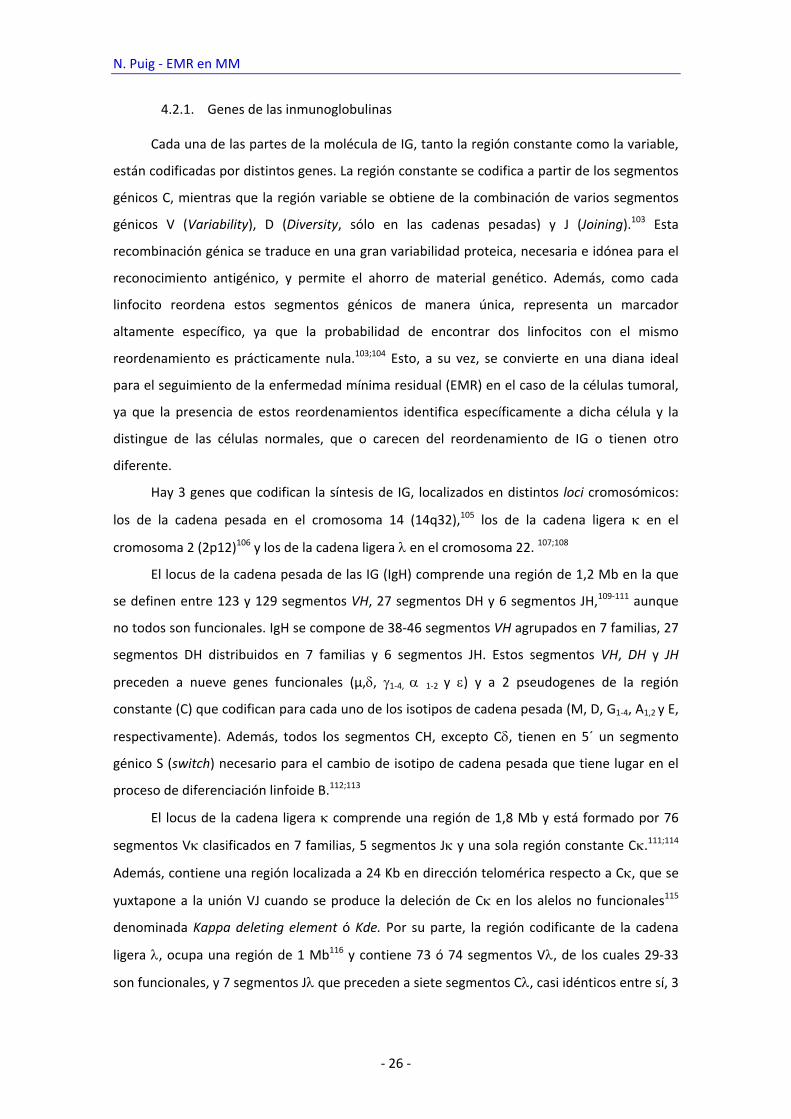
Hay 3 genes que codifican la síntesis de IG, localizados en distintos loci cromosómicos:
los de la cadena pesada en el cromosoma 14 (14q32),105 los de la cadena ligera en el
cromosoma 2 (2p12)106 y los de la cadena ligera en el cromosoma 22. 107;108
El locus de la cadena pesada de las IG (IgH) comprende una región de 1,2 Mb en la que
se definen entre 123 y 129 segmentos VH, 27 segmentos DH y 6 segmentos JH,109‐111 aunque
no todos son funcionales. IgH se compone de 38‐46 segmentos VH agrupados en 7 familias, 27
segmentos DH distribuidos en 7 familias y 6 segmentos JH. Estos segmentos VH, DH y JH
preceden a nueve genes funcionales (µ,, 1‐4, 1‐2 y ) y a 2 pseudogenes de la región
constante (C) que codifican para cada uno de los isotipos de cadena pesada (M, D, G1‐4, A1,2 y E,
respectivamente). Además, todos los segmentos CH, excepto C, tienen en 5´ un segmento
génico S (switch) necesario para el cambio de isotipo de cadena pesada que tiene lugar en el
proceso de diferenciación linfoide B.112;113
El locus de la cadena ligera comprende una región de 1,8 Mb y está formado por 76
segmentos V clasificados en 7 familias, 5 segmentos J y una sola región constante C.111;114
Además, contiene una región localizada a 24 Kb en dirección telomérica respecto a C, que se
yuxtapone a la unión VJ cuando se produce la deleción de C en los alelos no funcionales115
denominada Kappa deleting element ó Kde. Por su parte, la región codificante de la cadena
ligera , ocupa una región de 1 Mb116 y contiene 73 ó 74 segmentos V, de los cuales 29‐33
son funcionales, y 7 segmentos J que preceden a siete segmentos C, casi idénticos entre sí, 3

Introducción
‐ 27 ‐
de las cuales son genes no funcionantes o pseudogenes.107;117 Los genes de las cadenas ligeras
y no tienen regiones D.
4.2.1.1. Variabilidad genética de las inmunoglobulinas
El objetivo del proceso de diferenciación B es la síntesis de una IG capaz de reconocer
específicamente un AG. Teniendo en cuenta que el número de potenciales AGs es infinito, ha
de conseguirse que las moléculas de IGs del pool de LB presenten una gran diversidad. Esta
diversidad se consigue mediante una triple estrategia. Inicialmente tiene lugar el proceso
denominado “recombinación V (D) J”, en los estadios más tempranos de la diferenciación B, a
través del que la diversidad combinatoria de los genes V, (D) y J permite alcanzar hasta 107
posibles combinaciones. En segundo lugar, durante el proceso de recombinación V (D) J se
producen además deleciones e inserciones aleatorias de nucleótidos que incrementan hasta
106 la variabilidad en las regiones de unión. Y por último, en la fase de maduración de afinidad,
el mecanismo de hipermutación somática que detallaremos más adelante consigue
incrementar aún más la variabilidad en las regiones V.
4.2.2. Diferenciación linfoide B normal
Durante la diferenciación linfoide B tienen lugar una serie de procesos de recombinación
en los genes de las IG cuyo objetivo final es la formación de un reordenamiento capaz de
codificar una molécula de IG funcional capaz de reconocer AGs extraños. Estos procesos están
regulados por una serie de proteínas cuya expresión aumenta o disminuye en los diferentes
estadios madurativos.103
Se pueden distinguir dos fases en el proceso de diferenciación de la célula B,
determinadas por el contacto de la célula B con el AG.118 Inicialmente tendría lugar la
maduración temprana, previa al contacto con el AG, que tiene lugar en la MO desde los
estadios más inmaduros de la célula B (pro‐B) hasta el desarrollo de un LB inmunocompetente,
que expresa en su superficie una única IG funcional. Posteriormente, las células B migran a
órganos linfoides secundarios donde tiene lugar la maduración tardía por el contacto con el AG
a través de la que aumentará su afinidad por dicho AG, transformándose en un LB de memoria
o célula plasmática, imprescindibles en la respuesta inmune secundaria.96
4.2.2.1. Maduración independiente del antígeno
En esta etapa inicial se produce la recombinación de los diferentes segmentos génicos
de los genes IGH e IGL. Este proceso tiene lugar en los estadios más precoces de la
diferenciación linfoide B y determinará la variabilidad del repertorio primario de las IG. Tiene

N. Puig ‐ EMR en MM
‐ 28 ‐
lugar en la MO y termina cuando el LB abandona la MO para migrar a órganos linfoides
secundarios a través del torrente circulatorio.
4.2.2.1.1. Recombinación secuencial de los genes de las
inmunoglobulinas durante la diferenciación linfoide B
La recombinación de los genes de las IG comienza en el estadio pro‐B con el
reordenamiento de IGH, en que un segmento DH se une con uno JH.119 En el estadio pre‐B, un
segmento VH se reordena con el DJH anteriormente constituido.120 Puede ocurrir que este
segundo paso no tenga lugar en uno o en los dos alelos, en cuyo caso el (los)
reordenamiento(s) se denominan incompleto(s). Una vez que se ha producido un
reordenamiento IGH funcional en uno de los 2 alelos, el proceso de recombinación se detiene,
la cadena IGH se une a la ‐LC y a CD79 y el complejo se expresa en la superficie externa de la
membrana celular. Si el reordenamiento de los genes VH‐JH producido es funcional se inicia la
producción de cadenas pesadas µ aunque también pueden producirse cadenas por un
fenómeno de splicing alternativo. Así, la detección de la cadena µ citoplasmática se considera
uno de los primeros marcadores de la célula B. 121
La ausencia de síntesis de cadenas ligeras impide el ensamblaje de la IG completa, por lo
que las cadenas pesadas µ se acumulan en el citoplasma. No obstante, algunas cadenas µ se
unen a otras proteínas VpreB‐5 que forman las pseudo‐cadenas ligeras (‐LC).122 Estas
proteínas VpreB‐5 tienen una homología significativa con los dominios variables y constantes
de las IgL, respectivamente pero los genes que las codifican no sufren procesos de
reordenamiento.123‐125 El complejo formado por las dos cadenas Igµ asociadas covalentemente
con las pseudo‐cadenas ligeras (‐LC) se conoce como complejo pre‐BCR.126 Se cree que la
llegada a la superficie celular del complejo pre‐BCR permite a la célula recibir una señal desde
el exterior que, por un lado, bloquea el proceso de reordenamiento de los genes de las
cadenas pesadas del cromosoma homólogo (mecanismo de exclusión alélica) y, por otro,
activa el reordenamiento también jerárquico y secuencial de los genes de las cadenas ligeras
y . Si el primer reordenamiento VH‐JH no es funcional, no habrá cadenas µ ó y por tanto
tampoco complejo pre‐BCR. Sin dicho complejo, la célula no recibirá señales y no se bloqueará
el proceso de reordenamiento, que continuará con el segundo alelo. Si éste ya es funcional, el
complejo se expresará en superficie y se inducirá el reordenamiento de cadenas ligeras,
continuándose la diferenciación. Sin embargo, si este segundo alelo tampoco es funcional, la

Introducción
‐ 29 ‐
célula no expresará nunca el receptor, no podrá recibir las señales que le hagan avanzar en la
diferenciación y entrará en apoptosis.127
Si el proceso anterior ha concluido con éxito y se ha activado el reordenamiento de los
genes de las cadenas ligeras, éste tiene lugar de forma similar al de la cadena pesada. En
primer lugar se reordenarían los genes . Si este reordenamiento es funcional, la célula
comenzaría la transcripción de las cadenas ligeras que se ensamblan con las cadenas pesadas
µ o citoplasmáticas formando una IG completa (IgM‐ o IgD‐) que ya puede expresarse en
la superficie celular. La expresión en superficie de una IG completa es característica de los
últimos estadios de la diferenciación B AG‐independiente, y bloquea la formación de nuevos
reordenamientos en los genes de IgL. En caso de que el reordenamiento del primer alelo no
resultara funcional, se procederá al reordenamiento del segundo, y si no se consigue la
formación de una IgL funcional entonces se procede a reordenar el gen de la cadena . 119 Este
orden es el que justifica que en poblaciones linfoides B normales la relación / sea
aproximadamente 2:1. Además, en caso de reordenamiento de los genes IGL, se produce la
deleción del reordenamiento improductivo IGK.128‐130 De esta forma se evita la competencia
entre la cadena aberrante Ig y la Ig funcional por la unión con la cadena IgH. Si la cadena
ligera es capaz de ensamblarse con cadena IgM previamente formada, la célula entonces
alcanza el estadio de LB inmaduro inmunocompetente Igµ+. Aquellos LB inmaduros que sean
autorreactivos son eliminados por apoptosis o anergia, pero también pueden ser rescatados a
través del proceso de edición del receptor.130‐132
Finalmente, la molécula de IG sintetizada se une al heterodímero CD79 que permite su
anclaje a la membrana y la transmisión de señales al interior de la célula. A este nivel de la
diferenciación nos encontramos con un LB precoz inmaduro pero inmunocompetente, pues ya
es capaz de reconocer AGs a través de su receptor antigénico. A partir de este momento el
proceso madurativo estará orientado a aumentar la afinidad por el AG.
N. Puig ‐ EMR en MM
‐ 30 ‐
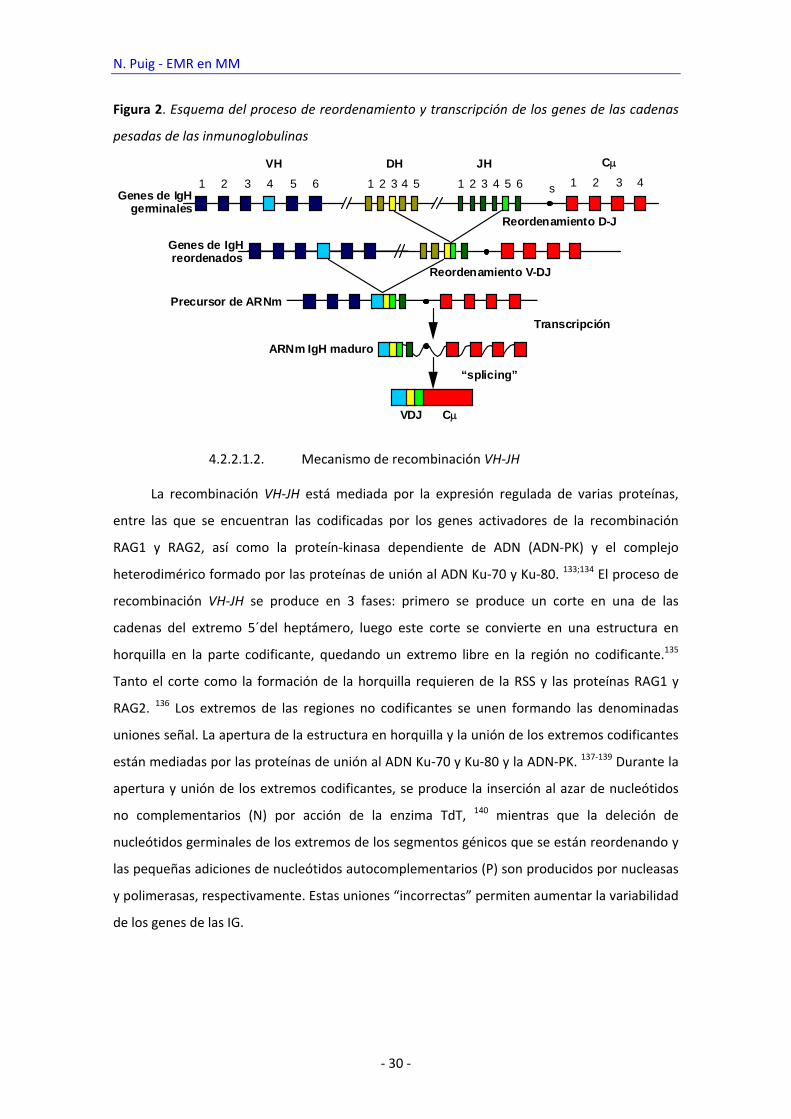
Figura 2. Esquema del proceso de reordenamiento y transcripción de los genes de las cadenas
pesadas de las inmunoglobulinas
4.2.2.1.2. Mecanismo de recombinación VH‐JH
La recombinación VH‐JH está mediada por la expresión regulada de varias proteínas,
entre las que se encuentran las codificadas por los genes activadores de la recombinación
RAG1 y RAG2, así como la proteín‐kinasa dependiente de ADN (ADN‐PK) y el complejo
heterodimérico formado por las proteínas de unión al ADN Ku‐70 y Ku‐80. 133;134 El proceso de
recombinación VH‐JH se produce en 3 fases: primero se produce un corte en una de las
cadenas del extremo 5´del heptámero, luego este corte se convierte en una estructura en
horquilla en la parte codificante, quedando un extremo libre en la región no codificante.135
Tanto el corte como la formación de la horquilla requieren de la RSS y las proteínas RAG1 y
RAG2. 136 Los extremos de las regiones no codificantes se unen formando las denominadas
uniones señal. La apertura de la estructura en horquilla y la unión de los extremos codificantes
están mediadas por las proteínas de unión al ADN Ku‐70 y Ku‐80 y la ADN‐PK. 137‐139 Durante la
apertura y unión de los extremos codificantes, se produce la inserción al azar de nucleótidos
no complementarios (N) por acción de la enzima TdT, 140 mientras que la deleción de
nucleótidos germinales de los extremos de los segmentos génicos que se están reordenando y
las pequeñas adiciones de nucleótidos autocomplementarios (P) son producidos por nucleasas
y polimerasas, respectivamente. Estas uniones “incorrectas” permiten aumentar la variabilidad
de los genes de las IG.
VH
1 2 3 4 5 6 1 2 3 4 5 1 2 3 54 6
JHDH
s
C
VDJ
ARNm IgH maduro
“splicing”
Precursor de ARNm
Genes de IgH germinales
Genes de IgH reordenados
Reordenamiento D-J
Reordenamiento V-DJ
Transcripción
1 2 3 4
C

Introducción
‐ 31 ‐
Figura 3: Esquema del mecanismo de recombinación DH‐JH. Las RSS que contienen los
heptámeros y nonámeros hibridan formando una estructura en horquilla. A continuación se
produce la unión de los extremos codificantes y la de los extremos señal, que se deleciona como
un producto circular de escisión.
4.2.2.1.3. Estructura de la unión VH‐JH
Dentro de la región variable de las IG existen 3 zonas llamadas hipervariables
flanqueadas por otras regiones relativamente conservadas (FR o framework). Las regiones
hipervariables o CDR confieren a las IG la afinidad específica por un determinado AG. De las 3
regiones, CDR1 y CDR2 se componen de secuencias de los genes VH mientras que CDR3, la más
variable y la responsable de la especificidad de la IG, está formada por la región de unión de
los segmentos VH‐JH.
TATA
TAGC
TATA
TA
GCGC –
CGAT
DH1
Unión de extremos codificantes (D-J)
heptámeroheptámero
nonámerononámero
DH4
JH1
JH2
JH3
DH4
JH1
JH2
JH3
12 pb 23 pb
nonámero nonámeroTATA
TAGC
TATA
TA
GCGC
–––––––
–
heptámero heptámeroTA
TA
CG
CG
CG
–––––––
CGAT
TA
TA
CG
CG
CGDH2 DH3 JH4 JH5 JH6
Unión de extremos señal (deleción)
JH4 JH5 JH6DH1 DH2 DH3

N. Puig ‐ EMR en MM
‐ 32 ‐
Figura 4: Región de unión VH‐JH de los genes de las cadenas pesadas de las inmunoglobulinas
con las regiones hipervariables (CDR) y estructurales (FR).
4.2.2.1.4. Edición del receptor
Si los LB maduros que salen de la médula resultan ser reactivos frente a autoantígenos
se transforman en “tolerantes”, lo que significa que se produce un bloqueo en la cascada de
transducción se señales mediadas por la sIg y en consecuencia la célula es incapaz de
activarse.141 Sin embargo, durante la diferenciación B las células B inmaduras pueden evitar el
reconocimiento de autoantígenos alterando las regiones de unión al AG de sus IG mediante un
proceso de edición.130
La edición del receptor antigénico puede ser llevada a cabo cambiando tanto las IgH
como las IGL. 130;142 Este proceso de edición tiene lugar fundamentalmente en el locus
mediante reordenamientos secundarios V‐J aunque también puede producirse en los loci
lambda y en IGH. La mayoría de los segmentos VH contienen en su extremo 5´una secuencia
homóloga al heptámero de las RSS.143 Los reemplazamientos pueden tener lugar por dos
mecanismos. El primero consiste en que un segmento VH reemplaza al que se encuentra
formando parte del reordenamiento VH‐JH mediante el heptámero interno.143;144 El segundo
consiste en que un segmento VH puede reordenarse al complejo DJH preexistente en el alelo
no funcional siguiendo el mismo esquema de los reordenamientos VH‐JH normales.145 Las
regiones de unión de estos reordenamientos secundarios poseen las mismas inserciones y
deleciones de nucleótidos que los reordenamientos VH‐JH primarios. De hecho, la enzima TdT
parece reactivarse durante este proceso de edición del receptor.146 Dado el corto periodo de
vida de las células B inmaduras, la capacidad de edición del receptor es limitada. Si no se logra
una edición satisfactoria, las células mueren por un mecanismo de apoptosis.
FRFR--11 FRFR--22 FRFR--33CDRCDR--II CDRCDR--IIIICDRCDR--IIIIII
5’5’ 3’3’
DHDH
VHVH
JHJH
FRFR--11 FRFR--22 FRFR--33CDRCDR--II CDRCDR--IIIICDRCDR--IIIIII
5’5’ 3’3’
DHDH
VHVH
JHJH

Introducción
‐ 33 ‐
4.2.2.2. Maduración dependiente del antígeno
4.2.2.2.1. Hipermutación somática
La hipermutación somática tiene lugar en los centros germinales tras la activación de las
células B inducida por el AG. Se ha demostrado que es un proceso acoplado a la transcripción
que se produce en una región de 1,5‐2 Kb desde el promotor y que requiere tanto la presencia
de un promotor como de potenciadores de la transcripción de los genes de las IG.147‐150
Funcionalmente, representa la base molecular de la maduración de afinidad de los LB naïve
tras la exposición al AG,151 pudiendo llegar a aumentar dicha afinidad entre 10 y 100 veces. Las
mutaciones somáticas son principalmente mutaciones puntuales, aunque se han descrito
también deleciones e inserciones152 y pueden ocurrir en ambas cadenas de la doble hélice de
DNA. 153 Normalmente los cambios afectan más a purinas que a pirimidinas y las transiciones
son más frecuentes que las transversiones.154
4.2.2.2.2. Cambio de isotipo
Tras la activación inducida por el AG, los LB proliferan y se diferencian produciendo
diferentes tipos de IG pero manteniendo la afinidad del BCR. El proceso se produce a través de
otro reordenamiento en los genes IGH denominado switching o cambio de isotipo, en el que se
produce recombinación entre las secuencias repetitivas localizadas en el extremo 5´ de cada
uno de los genes que codifican las regiones constantes de las cadenas pesadas de las IG.155;156
Al producirse la recombinación S‐S se delecionan algunas de las regiones CH de la
configuración germinal, de manera que se sustituye la región CH más cercana a la región VH‐JH
por la región CH correspondiente.157
En los estadios precoces, el isotipo IGH que expresan todos los linfocitos es Igµ o Ig.
Luego, ese mismo LB puede expresar cualquiera de los otros isotipos o seguir expresando el
isotipo Igµ según si se produce o no reordenamiento de esta región, sin que en ningún caso se
produzcan cambios en la especificidad de la región de reconocimiento antigénico.158

N. Puig ‐ EMR en MM
‐ 34 ‐
Figura 5: Esquema del mecanismo de cambio de isotipo de las IgH. En este ejemplo, el
resultado final es el cambio de IgM a IgE.
4.3. Detección molecular de enfermedad mínima residual en mieloma múltiple
Las elevadas tasas de respuesta logradas con los nuevos fármacos y estrategias de
tratamiento en pacientes con MM han precipitado el uso de técnicas más sensibles para la
detección de enfermedad residual que permiten no sólo cuantificar con mayor precisión la
masa tumoral residual sino también la evaluación precoz de la eficacia del tratamiento
administrado. 7;159‐162 De entre las metodologías empleadas hasta la fecha, la PCR se basa en la
amplificación de marcadores cromosómicos específicos de la enfermedad que en el caso que
nos ocupa serían los genes de las IG.163‐167
Varias técnicas de PCR se han empleado a tal fin. Las técnicas clásicas empleaban
primers consenso pero tenían una sensibilidad muy baja (10‐1 – 10‐2), insuficiente para el
estudio de la EMR. Esto se debía a que los primers consenso no sólo amplificaban los
reordenamientos clonales sino también los de los linfocitos normales. Así, empezaron a
utilizarse primers específicos del reordenamiento clonal o ASO (allelic specific oligonucleotide)
primers, complementarios con las CDRs del reordenamiento, junto con primers JH consenso. La
estrategia de estudio de EMR consistía en amplificar el reordenamiento clonal del paciente en
el momento del diagnóstico mediante primers consenso con el fin de obtener la secuencia de
las CDRs. Con estas secuencias se diseña un primer o sonda específicos de tal reordenamiento
C3CC C1 C1 C C2 C2 C4ssssssss
V DJ C ARNm IgH maduro
“splicing”Precursor de ARNm
C3C3CCCC C1C1
C1C1 CC C2C2C2C2 C4C4VDJssssssss
“
Transcripción

Introducción
‐ 35 ‐
que permite la detección del mismo durante la monitorización de la EMR. La sensibilidad de la
ASO PCR permite discriminar 1 célula tumoral entre 104 – 106 células normales, suficiente para
su uso como técnica de detección de EMR. Sin embargo, tales estudios proporcionaban
información meramente cualitativa, que no permitía establecer con exactitud el número de
células tumorales presentes en la muestra. 168;169
Se desarrollaron después técnicas semi‐cuantitativas basadas en el método de dilución
límite o en la cuantificación mediante análisis densitométrico comparado de las bandas post‐
PCR con diluciones estándar. Estos estudios, sin embargo, presentan una enorme variabilidad
intra e inter‐análisis, son muy laboriosos y de difícil estandarización. 170‐173
Finalmente, la RQ‐PCR permite la cuantificación exacta de las células tumorales
mediante PCR en tiempo real y no requiere procesamiento del producto de PCR, lo que reduce
el riesgo de contaminación. Se basa en el empleo de un oligonucleótido específico del
reordenamiento tumoral (generalmente complementario a CDR3) junto con uno consenso (en
JH) y una sonda fluorescente para monitorizar la amplificación. Existen varios equipos en el
mercado que permiten el análisis de los resultados. 174;175 El método más empleado se basa en
la actividad 5´ exonucleasa de la Taq polimerasa que emplea sondas TaqMan complementarias
a la región diana.176 La sonda TaqMan tiene unido un fluorocromo en posición 5´y un
amortiguador de fluorescencia en posición 3´ y está fosforilada en el extremo 3´para evitar su
extensión durante la reacción de PCR. Si la secuencia diana está presente en la muestra, la
sonda TaqMan hibridará específicamente con ella, colocándose entre los 2 primers. Cuando se
produce la etapa de extensión de la PCR, la actividad 5´exonucleasa de la Taq degrada la sonda
liberando el fluorocromo que, al estar fuera de la influencia del amortiguador, emite luz de
una longitud de onda específica, que será captada por el sistema óptico del equipo. Este
proceso de degradación de la sonda tiene lugar en cada ciclo y no interfiere con la
acumulación del producto de PCR, de manera que se producirá un incremento exponencial de
la señal de fluorescencia en cada ciclo de reacción de la PCR. Además, la Taq no digiere la
sonda libre sino sólo la hibridada con lo que la cantidad de señal fluorescente emitida es
proporcional a la cantidad de producto acumulado.

N. Puig ‐ EMR en MM
‐ 36 ‐
Figura 17: Esquema de la técnica de PCR cuantitativa en tiempo real (RQ‐PCR)
La medición de la intensidad de fluorescencia se realiza de forma continua, lo que
proporciona una información en tiempo real del proceso. Así, podemos establecer el ciclo
umbral (CT o cycle threshold) o el número de ciclos necesarios para que la cantidad de producto
obtenido alcance el nivel de detección que hayamos fijado, que a su vez se correlaciona con la
cantidad de células que contienen la secuencia diana. Generalmente, el umbral se define como
10 veces la desviación estándar del valor de la señal de fluorescencia basal. La cuantificación
del número de copias de una muestra se realiza mediante la comparación del CT de la muestra
problema con el de una serie de diluciones de una muestra control positiva, con las que se
establece una recta patrón que refleja el número de copias frente al número de ciclos. Cuando
se realiza la cuantificación de la muestra problema, el ciclo umbral se interpola en la recta
patrón, lo que permite conocer el número de copias de partida de la secuencia diana en la
muestra que estamos analizando. Por otro lado, al cuantificar una muestra problema debemos
tener en cuenta la cantidad y calidad del DNA analizado. Esta variable puede controlarse
mediante la amplificación en la misma muestra de un gen control presente en todas las células
1-LOCALIZACIÓN DE LOS PRIMERS Y LA SONDA. NO HAY EMISION DE FLUORESCENCIA
2- LA ACTIVIDAD 5´ EXONUCLEASA DE LA TAQ POLIMERASA ROMPE SONDA
3-EMISIÓN DE FLUORESCENCIA. EN LA FASE DE EXTENSIÓN SE HABRÁN DUPLICADO LAS COPIAS DE PARTIDA.
1
3
2
1-LOCALIZACIÓN DE LOS PRIMERS Y LA SONDA. NO HAY EMISION DE FLUORESCENCIA
2- LA ACTIVIDAD 5´ EXONUCLEASA DE LA TAQ POLIMERASA ROMPE SONDA
3-EMISIÓN DE FLUORESCENCIA. EN LA FASE DE EXTENSIÓN SE HABRÁN DUPLICADO LAS COPIAS DE PARTIDA.
11
33
22
Introducción
‐ 37 ‐
como ABL, GADPH o albúmina, lo que nos permitiría compensar la distinta eficiencia de la PCR
debida a diferencias en la cantidad o calidad del DNA de la muestra problema.
Varios estudios que analizaremos a continuación han demostrado que esta técnica es
útil en la detección de EMR empleando los reordenamientos clonales de los genes de las
IG.165;166;173;177‐179 Para ello, existen distintas estrategias de análisis dependiendo de cuál de los
oligos o primers es el complementario a la región CDR3. Puede diseñarse una sonda específica
de la región hipervariable combinada con primers consenso de las regiones VH y JH. Como
alternativa, pueden usarse sondas consenso en la región JH combinadas con un primer
específico de la región CDR3 y otro para la región intrónica de JH. Este último sistema reduce el
coste y la variabilidad entre pacientes y ha demostrado ser útil en LLA‐B y LLC‐B. 180‐182
4.3.1. Estudios de enfermedad mínima residual en mieloma múltiple mediante PCR
Varios estudios han explorado el valor de la PCR como técnica para la monitorización de
EMR en MM. 183‐189 Inicialmente, ya la mayoría de ellos empleaban ASO‐PCR como técnica para
la detección de enfermedad residual. Sin embargo, la efectividad de los tratamientos en los
años previos a la aparición de los nuevos fármacos y del uso de la quimioterapia a altas dosis
era limitada, de manera que los resultados eran siempre positivos y por tanto sin utilidad
clínica alguna. Más tarde, varios estudios realizados en su mayoría en pacientes sometidos a
trasplante autólogo y alogénico mostraron el valor pronóstico de la remisión molecular,
alcanzada entre 27 y 50% de los casos según las series. Además, el grupo de Corradini, usando
ASO PCR cualitativa, describe un porcentaje de remisiones moleculares significativamente
superior en pacientes sometidos a trasplante alogénico en comparación con aquellos que
habían recibidos trasplante autólogo, sugiriendo el valor de la técnica para monitorizar la
eficacia de los tratamientos. 190
En los últimos años se han empleado técnicas semi‐cuantitativas y cuantitativas
intentando estratificar la evolución de los pacientes en función de la cantidad de enfermedad
residual.191‐195 Estos métodos pueden alcanzar una sensibilidad de hasta 10‐6 y no sólo ofrecen
resultados absolutos en términos de positividad vs negatividad sino que permiten también
monitorizar la evolución de la cantidad de enfermedad residual. Así, Korthals describe
recientemente en un grupo de pacientes tratados con TASPE que la cuantificación mediante
ASO RQ‐PCR de los niveles de EMR antes del tratamiento permite identificar 2 grupos de
pacientes con diferente SLE y SG (0,2% 2IgH/β‐actina).196 En la era de los nuevos fármacos,
Ladetto ha documentado mediante ASO RQ‐PCR reducciones significativas en la carga tumoral
residual post‐TASPE seguidas en algunos casos de remisiones moleculares mantenidas en
N. Puig ‐ EMR en MM
‐ 38 ‐
pacientes tratados con bortezomib, talidomida y dexametasona como tratamiento de
consolidación. Así, tras una mediana de seguimiento de 42 meses, no se había documentado
ninguna progresión entre pacientes en remisión molecular.197 En una actualización del estudio
con una mediana de seguimiento de 65 meses, la SG a los 5 años de aquellos pacientes que
habían alcanzado remisión molecular era del 100%.
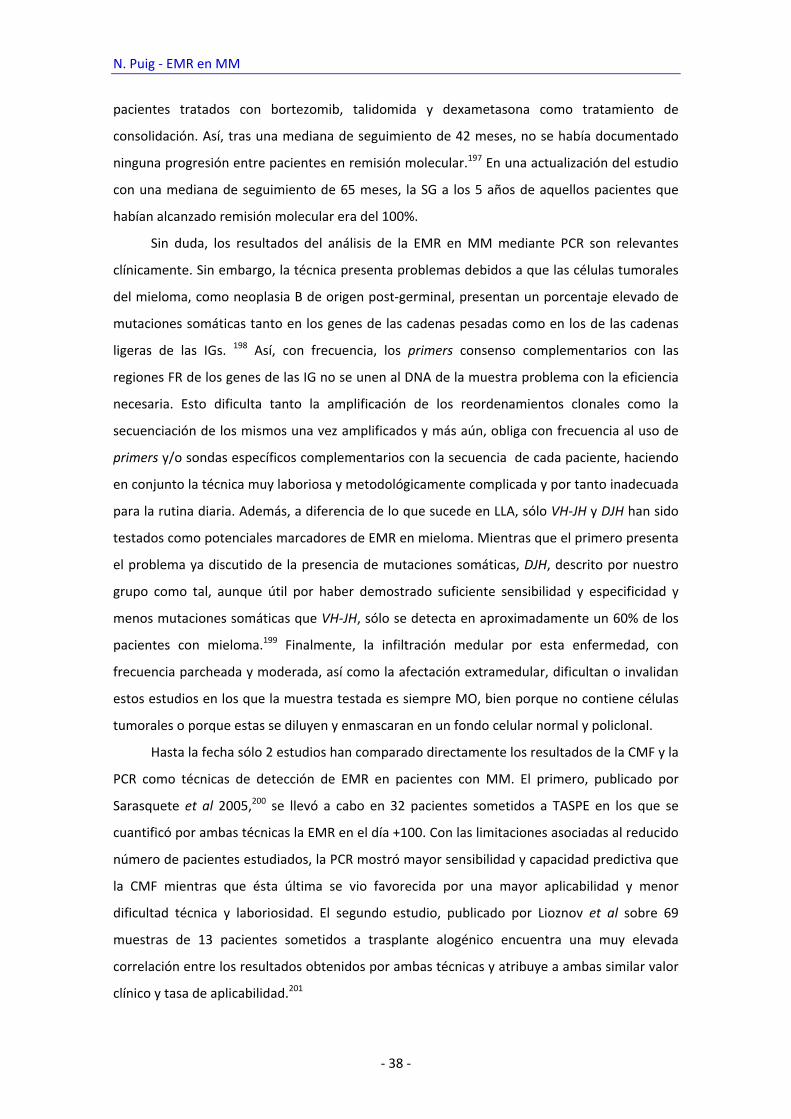
Sin duda, los resultados del análisis de la EMR en MM mediante PCR son relevantes
clínicamente. Sin embargo, la técnica presenta problemas debidos a que las células tumorales
del mieloma, como neoplasia B de origen post‐germinal, presentan un porcentaje elevado de
mutaciones somáticas tanto en los genes de las cadenas pesadas como en los de las cadenas
ligeras de las IGs. 198 Así, con frecuencia, los primers consenso complementarios con las
regiones FR de los genes de las IG no se unen al DNA de la muestra problema con la eficiencia
necesaria. Esto dificulta tanto la amplificación de los reordenamientos clonales como la
secuenciación de los mismos una vez amplificados y más aún, obliga con frecuencia al uso de
primers y/o sondas específicos complementarios con la secuencia de cada paciente, haciendo
en conjunto la técnica muy laboriosa y metodológicamente complicada y por tanto inadecuada
para la rutina diaria. Además, a diferencia de lo que sucede en LLA, sólo VH‐JH y DJH han sido
testados como potenciales marcadores de EMR en mieloma. Mientras que el primero presenta
el problema ya discutido de la presencia de mutaciones somáticas, DJH, descrito por nuestro
grupo como tal, aunque útil por haber demostrado suficiente sensibilidad y especificidad y
menos mutaciones somáticas que VH‐JH, sólo se detecta en aproximadamente un 60% de los
pacientes con mieloma.199 Finalmente, la infiltración medular por esta enfermedad, con
frecuencia parcheada y moderada, así como la afectación extramedular, dificultan o invalidan
estos estudios en los que la muestra testada es siempre MO, bien porque no contiene células
tumorales o porque estas se diluyen y enmascaran en un fondo celular normal y policlonal.
Hasta la fecha sólo 2 estudios han comparado directamente los resultados de la CMF y la
PCR como técnicas de detección de EMR en pacientes con MM. El primero, publicado por
Sarasquete et al 2005,200 se llevó a cabo en 32 pacientes sometidos a TASPE en los que se
cuantificó por ambas técnicas la EMR en el día +100. Con las limitaciones asociadas al reducido
número de pacientes estudiados, la PCR mostró mayor sensibilidad y capacidad predictiva que
la CMF mientras que ésta última se vio favorecida por una mayor aplicabilidad y menor
dificultad técnica y laboriosidad. El segundo estudio, publicado por Lioznov et al sobre 69
muestras de 13 pacientes sometidos a trasplante alogénico encuentra una muy elevada
correlación entre los resultados obtenidos por ambas técnicas y atribuye a ambas similar valor
clínico y tasa de aplicabilidad.201

Introducción
‐ 39 ‐


Hipótesis y objetivos
‐ 41 ‐
Hipótesisyobjetivos

N. Puig. EMR en MM
‐ 42 ‐
Hipótesis y objetivos
‐ 43 ‐
La evolución de los enfermos con MM ha cambiado significativamente en las últimas
décadas debido a la introducción del trasplante hematopoyético y nuevos fármacos como los
inhibidores de proteasoma y los inmunomoduladores. Esto se ha traducido en un aumento de
la posibilidad de alcanzar RCs (en torno al 50% tras trasplante y nuevos fármacos) y asociados a
la misma un aumento en la SLP y SG. Por ello, hoy día la RC constituye un objetivo en todos los
esquemas terapéuticos de mieloma. Sin embargo, sabemos que los criterios actuales de RC son
subóptimos ya que están basados en técnicas de baja sensibilidad como la IF (se requiere
negatividad) y la morfología (se requiere <5% de CP en MO). Diversos estudios indican que las
técnicas inmunofenotípicas y moleculares tienen una mayor sensibilidad y permitirían evaluar
la EMR en MO, de forma que cuanto mayor sea la profundidad de la respuesta mayor será la
supervivencia.
En el campo molecular existen distintas estrategias, con diferente grado de sensibilidad
y especificidad, de entre las cuales aquéllas basadas en el uso de primers y/o sondas diseñados
específicamente para cada paciente, y que además permiten la cuantificación de la masa
tumoral residual, han mostrado valor clínico en pacientes con mieloma. Desafortunadamente,
la aplicabilidad de algunas de ellas es baja, de manera que nuestra hipótesis es que la
búsqueda de nuevos marcadores moleculares y/o el uso de muestras alternativas (por
ejemplo, enriquecidas en CP mediante selección inmunomagnética CD138+) podrían aumentar
esta aplicabilidad.
Por otro lado, hasta ahora no se han hecho estudios prospectivos que evalúen los
problemas responsables de los fallos en cada uno de los pasos del estudio molecular de EMR.
Por ello, nuestra segunda hipótesis es que la utilización de la estrategia propuesta por el grupo
europeo Euro‐MRD, ampliamente estandarizada pero todavía no aplicada a mieloma,
permitiría investigar e identificar los pasos en los que se producen los errores en la técnica de
detección de EMR. A su vez, este estudio prospectivo sería una oportunidad única para
comparar la investigación de EMR por técnicas moleculares frente a inmunofenotípicas. Si la
hipótesis de que las primeras tienen mayor sensibilidad y predicen mejor la supervivencia se
demostrara, se convertirían en una alternativa clara a la CMF; de lo contrario, dada su mayor
dificultad técnica y laboriosidad, habría que considerarlas un método de reserva y seguir
explorando otras alternativas moleculares como la NGS.
N. Puig. EMR en MM
‐ 44 ‐
OBJETIVO GENERAL
Investigar la optimización de técnicas moleculares para detección de EMR en MM
OBJETIVOS ESPECÍFICOS
Explorar la utilidad de Kde como marcador molecular de EMR en MM
Analizar el papel del uso de muestras de MO enriquecidas en CP mediante selección
inmunomágnética CD138+ como material inicial para el estudio de EMR en pacientes
con MM

Material,métodosyresultados

N. Puig. EMR en MM
‐ 46 ‐
Material, métodos y resultados
‐ 47 ‐
ARTÍCULO 1: Uso de Kde como marcador molecular adicional para el estudio de la
enfermedad mínima residual mediante RQ‐PCR en pacientes con MM
INTRODUCCIÓN y OBJETIVOS: El estudio de la EMR mediante PCR en pacientes con MM
presenta varios problemas, entre los que se incluye la ausencia de un marcador molecular
óptimo. En este sentido, VH‐JH presenta con frecuencia mutaciones somáticas y DH‐JH sólo se
detecta en aproximadamente 60% de los pacientes. Como alternativa, los reordenamientos de
Kde se detectan en todos los síndromes linfoproliferativos B y en un tercio de los y no
presentan mutaciones somáticas que comprometan la eficiencia de primers y sondas. Por ello,
al igual que sucede en leucemia linfoblástica aguda, podrían usarse con éxito como
marcadores de EMR en MM.
MÉTODOS: En primer lugar, investigamos la incidencia, uso de segmentos génicos y
características de la región de unión del reordenamiento Kde en muestras de 96 pacientes con
MM obtenidas en el momento del diagnóstico. Para ello, tras extraer DNA de las muestras
mediante métodos estándar, amplificamos el reordenamiento siguiendo protocolos BIOMED‐
2, y secuenciamos los productos de amplificación mediante Big‐Dye terminators. Tras estos
estudios, investigamos el uso de Kde como marcador molecular para el seguimiento de EMR
mediante RQ‐PCR en 16 casos seleccionados al azar. Para esto, usamos un primer forward
específico de la región de unión del reordenamiento en combinación con un primer reverso y
una sonda TaqMan, ambos consenso y complementarios de la secuencia germinal, siguiendo la
estrategia descrita por van der Velden et al.
RESULTADOS: En 43 de los 96 casos analizados (45%) se amplificaron reordenamientos
monoclonales de Kde, monoalélicos en 29 casos (66%) y bialélicos en los restantes 14 casos. La
secuencia del reordenamiento se obtuvo con éxito en el 88% de los casos, encontrándose Kde
reordenado con igual frecuencia con Vk que con intrón‐RSS. La mediana del número de
nucleótidos añadidos o eliminados de la región de unión fue 1 y 5, respectivamente, siendo
Vk1 y Vk3 los segmentos génicos identificados con mayor frecuencia. El 94% de las secuencias
obtenidas presentaban más de un 98% de homología con la secuencia germinal. Tras aplicar la
estrategia arriba descrita para analizar Kde como marcador de EMR, 5 de los 16 casos
seleccionados tuvieron que excluirse por la presencia de amplificación inespecífica inasumible
(CT muestras > CT background); 8 de los 10 casos restantes cumplían todos los requisitos del
grupo Euro‐MRD para la cuantificación de la EMR, alcanzándose una sensibilidad <5x10‐4 en el
87,5% de los casos y <10‐4 en 50% de los casos.
CONCLUSIONES: En 50% de los pacientes con MM se detectan reordenamientos de Kde, la
mayoría pueden secuenciarse con éxito y carecen de mutaciones somáticas. El uso de Kde

N. Puig. EMR en MM
‐ 48 ‐
como marcador adicional para el estudio de EMR en pacientes con mieloma incrementa la
aplicabilidad de estos estudios en un 9% de los casos en general y en 20% en casos lambda,
grupo en el que supone un avance significativo. Por otro lado, las peculiaridades del
reordenamiento de Kde en mieloma (patrón fijo, con región de unión única y muy corta),
explican la aparición, relativamente frecuente, de amplificaciones inespecíficas, lo que reduce
su sensibilidad como marcador de EMR.

ORIGINAL ARTICLE
Kappa deleting element as an alternative molecular targetfor minimal residual disease assessment by real-timequantitative PCR in patients with multiple myelomaNoemı Puig1, Marıa E. Sarasquete1,2, Miguel Alcoceba1,2, Ana Balanzategui1, Marıa C. Chillon1,2,Elena Sebastian1, Marcos G. Dıaz1,2, Jesus F. San Miguel1,2, Ramon Garcıa-Sanz1,2
1Department of Hematology, University Hospital of Salamanca, Paseo de San Vicente, Salamanca; 2Center of Investigation in Cancer (CIC),
Campus Miguel de Unamuno, University of Salamanca, Salamanca, Spain
Abstract
Background and Objectives: Minimal residual disease (MRD) assessment by PCR in multiple myeloma
(MM) has several shortcomings, including the lack of a suitable target. Kappa deleting element (KDE)
rearrangements occur in virtually all Ig-lambda B-cell malignancies and in 1/3 of Ig-kappa are not affected
by somatic hypermutation and, as in ALL, could be used as PCR targets. Methods: We have first
investigated the incidence, gene segment usage, and CDR3 composition of IGK-KDE rearrangements in 96
untreated myeloma patients. Second, we tested 16 KDE gene rearrangements as molecular targets for
MRD assessment by RQ-PCR using a germline reverse primer and a germline Taqman probe in
combination with allele-specific oligonucleotides (ASO) as forward primers. Results: Monoclonal KDE
rearrangements were amplified in 45% (43/96) of cases, monoallelic in 2/3 of them (29 cases), and
biallellic in the remaining 14 cases. Overall, 88% of cases were successfully sequenced, KDE being
equally frequently rearranged with VK and with intron-Recombination signal sequence (RSS). Median
numbers of inserted and deleted nucleotides in the junctional region were one and five, respectively.
Conclusions: Using KDE rearrangements as additional PCR target for MRD assessment in MM improves
the applicability of these studies in 9% of cases overall and in 20% of lambda cases. Its use in the latter
subset could represent a significant advance.
Key words multiple myeloma; minimal residual disease; real-time quantitative PCR; kappa deleting element; immunoglobulin kappa
gene
Correspondence Ramon Garcıa-Sanz, Department of Hematology, University Hospital of Salamanca, Paseo de San Vicente, 58-182,
Salamanca 37007, Spain. Tel: +34 923291384; Fax: +34 923294624; e-mail: [email protected]
Accepted for publication 13 July 2012 doi:10.1111/ejh.12000
In patients with multiple myeloma (MM), response rates havesignificantly increased with the use of autologous stem celltransplantation and new drugs (1–4). This has prompted theintroduction of highly sensitive techniques such as PCR andmultiparameter flow cytometry (MFC) to detect residual dis-ease as well as the definition of new response criteria accord-ingly (5). Minimal residual disease (MRD) detection byimmunoglobulin heavy-chain real-time quantitative PCR(IGH RQ-PCR) and MFC has proved to be of prognosticvalue in MM patients (6–11). Compared with MFC, RQ-PCRseems to have higher sensitivity but lower applicability,partly due to the lack of a suitable target free of somatic
hypermutation (SHM), thus avoiding mismatches with theprimers and probes (8). New strategies aimed at improving theapplicability and performance of the PCR are thus needed.Our group has previously shown the value of using
incomplete DJH rearrangements instead of complete VDJHas molecular markers for investigating MRD in MM becausethe former have a much lower incidence of SHM (12). DJHrearrangements are detected in approximately 60% ofpatients, they are specific markers and allow the detectionup to five tumor cells in a background of 1.6 9 10�5
normal cells (12). Alternative strategies include the use ofpatient-specific probes and primers to avoid mismatches
© 2012 John Wiley & Sons A/S 1
European Journal of Haematology
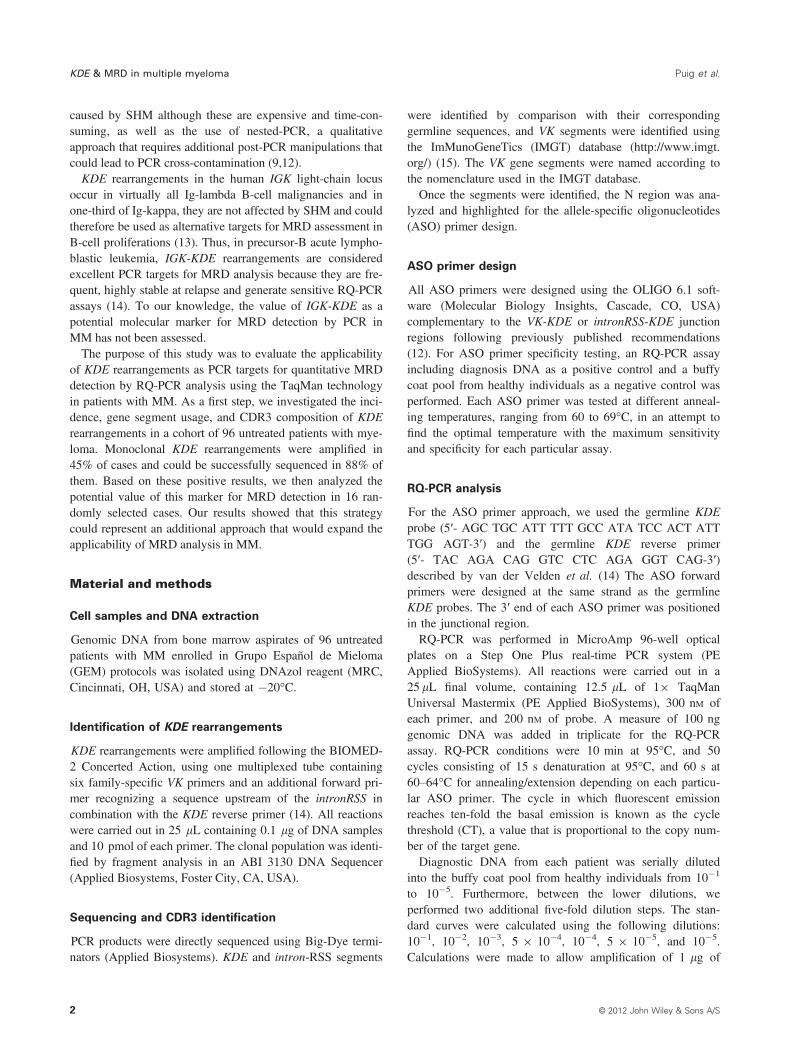
caused by SHM although these are expensive and time-con-suming, as well as the use of nested-PCR, a qualitativeapproach that requires additional post-PCR manipulations thatcould lead to PCR cross-contamination (9,12).KDE rearrangements in the human IGK light-chain locus
occur in virtually all Ig-lambda B-cell malignancies and inone-third of Ig-kappa, they are not affected by SHM and couldtherefore be used as alternative targets for MRD assessment inB-cell proliferations (13). Thus, in precursor-B acute lympho-blastic leukemia, IGK-KDE rearrangements are consideredexcellent PCR targets for MRD analysis because they are fre-quent, highly stable at relapse and generate sensitive RQ-PCRassays (14). To our knowledge, the value of IGK-KDE as apotential molecular marker for MRD detection by PCR inMM has not been assessed.The purpose of this study was to evaluate the applicability
of KDE rearrangements as PCR targets for quantitative MRDdetection by RQ-PCR analysis using the TaqMan technologyin patients with MM. As a first step, we investigated the inci-dence, gene segment usage, and CDR3 composition of KDErearrangements in a cohort of 96 untreated patients with mye-loma. Monoclonal KDE rearrangements were amplified in45% of cases and could be successfully sequenced in 88% ofthem. Based on these positive results, we then analyzed thepotential value of this marker for MRD detection in 16 ran-domly selected cases. Our results showed that this strategycould represent an additional approach that would expand theapplicability of MRD analysis in MM.
Material and methods
Cell samples and DNA extraction
Genomic DNA from bone marrow aspirates of 96 untreatedpatients with MM enrolled in Grupo Español de Mieloma(GEM) protocols was isolated using DNAzol reagent (MRC,Cincinnati, OH, USA) and stored at �20°C.
Identification of KDE rearrangements
KDE rearrangements were amplified following the BIOMED-2 Concerted Action, using one multiplexed tube containingsix family-specific VK primers and an additional forward pri-mer recognizing a sequence upstream of the intronRSS incombination with the KDE reverse primer (14). All reactionswere carried out in 25 lL containing 0.1 lg of DNA samplesand 10 pmol of each primer. The clonal population was identi-fied by fragment analysis in an ABI 3130 DNA Sequencer(Applied Biosystems, Foster City, CA, USA).
Sequencing and CDR3 identification
PCR products were directly sequenced using Big-Dye termi-nators (Applied Biosystems). KDE and intron-RSS segments
were identified by comparison with their correspondinggermline sequences, and VK segments were identified usingthe ImMunoGeneTics (IMGT) database (http://www.imgt.org/) (15). The VK gene segments were named according tothe nomenclature used in the IMGT database.Once the segments were identified, the N region was ana-
lyzed and highlighted for the allele-specific oligonucleotides(ASO) primer design.
ASO primer design
All ASO primers were designed using the OLIGO 6.1 soft-ware (Molecular Biology Insights, Cascade, CO, USA)complementary to the VK-KDE or intronRSS-KDE junctionregions following previously published recommendations(12). For ASO primer specificity testing, an RQ-PCR assayincluding diagnosis DNA as a positive control and a buffycoat pool from healthy individuals as a negative control wasperformed. Each ASO primer was tested at different anneal-ing temperatures, ranging from 60 to 69°C, in an attempt tofind the optimal temperature with the maximum sensitivityand specificity for each particular assay.
RQ-PCR analysis
For the ASO primer approach, we used the germline KDEprobe (5′- AGC TGC ATT TTT GCC ATA TCC ACT ATTTGG AGT-3′) and the germline KDE reverse primer(5′- TAC AGA CAG GTC CTC AGA GGT CAG-3′)described by van der Velden et al. (14) The ASO forwardprimers were designed at the same strand as the germlineKDE probes. The 3′ end of each ASO primer was positionedin the junctional region.RQ-PCR was performed in MicroAmp 96-well optical
plates on a Step One Plus real-time PCR system (PEApplied BioSystems). All reactions were carried out in a25 lL final volume, containing 12.5 lL of 19 TaqManUniversal Mastermix (PE Applied BioSystems), 300 nM ofeach primer, and 200 nM of probe. A measure of 100 nggenomic DNA was added in triplicate for the RQ-PCRassay. RQ-PCR conditions were 10 min at 95°C, and 50cycles consisting of 15 s denaturation at 95°C, and 60 s at60–64°C for annealing/extension depending on each particu-lar ASO primer. The cycle in which fluorescent emissionreaches ten-fold the basal emission is known as the cyclethreshold (CT), a value that is proportional to the copy num-ber of the target gene.Diagnostic DNA from each patient was serially diluted
into the buffy coat pool from healthy individuals from 10�1
to 10�5. Furthermore, between the lower dilutions, weperformed two additional five-fold dilution steps. The stan-dard curves were calculated using the following dilutions:10�1, 10�2, 10�3, 5 9 10�4, 10�4, 5 9 10�5, and 10�5.Calculations were made to allow amplification of 1 lg of
2 © 2012 John Wiley & Sons A/S
KDE & MRD in multiple myeloma Puig et al.

each dilution. RQ-PCR data were interpreted according tovan der Velden et al. (16) Sensitivity, quantitative range,slope, and correlation coefficient of each RQ-PCR assaywere analyzed.
Results
Detection of Vk-KDE/intronRSS-KDE clonalrearrangements, gene segment usage and CDR3composition
Monoclonal KDE rearrangements were amplified in 45%(43/96) of cases, being monoallelic (one peak) in 29 (67%)cases and biallelic (two peaks) in 14 of them (33%).Twenty-one samples did not amplify and 32 produced apolyclonal pattern.Among the 29 monoallelic cases, we obtained the
sequence in 28 (97%) with VK-KDE rearrangements detectedin eight cases (29%) and intronRSS-KDE rearrangements in20 cases (71%). Of the 14 biallelic cases, ten (71%) werefully sequenced (20 sequences), with a double VK-KDE rear-rangement and VK-KDE/intron-KDE detected in five caseseach. In four cases, we were unable to obtain the sequenceof one (n = 1) or both (n = 3) rearrangements. Overall, weidentified at least one sequence in 39 of the 43 clonal cases(91%). All patients with biallelic rearrangements and 13 ofthe 29 cases with monoallelic rearrangements had lambdaMM, while the remaining 16 had kappa MM.Frequencies of IgK-KDE gene rearrangements (VK-KDE/
intronRSS-KDE) and VK family gene usage in VK-KDErearrangements are summarized in Table 1. VK1 and VK3gene segments were the most frequently used, whereas norearrangements involving VK5 and VK7 were found. Over-all, the median number of inserted nucleotides in the junc-tional region was one (range: 0–6), and the mediannumber of deletions was five (range: 0–16). Among
VK-KDE rearrangements, the median number of insertedand deleted nucleotides were one (range: 0–4) and five(range: 0–16), respectively, similar to the intronRSS/KDErearrangements that had a median of one (range: 0–2) andfour (range: 0–10) inserted and deleted nucleotides,respectively.
Mutation status
The number, type, and location of mutations detected in VK,KDE, and intron-RSS gene segments are detailed in Table 2.Thirty-two (67%) of the 48 sequences obtained werecompletely unmutated, and 13 (27%) had at least 98%homology with the corresponding germline sequences. In thethree (6%) remaining cases, the mean number of mutationswas 2.1%, ranging from 2.1% to 3.2%. KDE was mutated inseven of the 48 sequences analyzed, and VK was only foundto be mutated in three cases, all within biallelic KDErearrangements. Mutations were mostly point mutations,and transitions were more frequently detected than transver-sions.
Evaluation of ASO primer design
Sixteen cases were randomly selected for ASO primerdesign testing. Forward ASO primers were designed at thejunction region of intronRSS-KDE in six cases and VK-KDEin ten cases. Primer sequences and location are shown inTable 3. Based on the results of the initial evaluation withan annealing temperature of 60°C, five samples wereexcluded from further analysis because the CT of the targetsamples was similar or higher than that of the background(see Table 3). Eight cases exhibited amplification of normalmononuclear cells (MNC) DNA, with a median CT value of37 (range: 33.5–41.3).
Applicability of RQ-PCR analysis for MRD detectionvia IgK-KDE rearrangements
Standard curves were performed in ten cases. The quantita-tive range, sensitivity, correlation coefficient, and slope ofthe RQ-PCR assays using the ASO primer approach aresummarized in Table 4. Eight cases fulfilled the criteria forsensitivity and quantitative range according to the EuroMRDgroup (formerly known as ESG-MRD-ALL) recommenda-tions (16), reaching sensitivities of � 5 9 10�4 (7/8 cases,87.5%) and � 10�4 (4/8 cases, 50%). As far as clinical dataare concerned, Table 5 details patient’s characteristics,results of the MRD assessment by RQ-PCR and MFC, andoutcome of these eight cases. Comparative analysis of bothtechniques showed similar results in three cases (953, 1139and 1477) and slightly discordant in three, presumably beingPCR more predictive in one case (1160) and MFC in two(1391 and 1493). In the remaining two cases (876 and 1612)
Table 1 Frequencies of IGK-KDE gene rearrangements (VK-KDE/
intronRSS-KDE) and VK family gene usage in VK-KDE rearrangements
in multiple myeloma
Monoallelic(n = 28) (%)
Biallelic(n = 10)(%)
Total (n = 48)(%)
Normal Bcells (%)
Intron
RSS-Kde
20 (71) 5 (25) 25 (52) –
Vk-Kde 8 (29) 15 (75) 23 (48) –
Vk1 4 (50) 5 (33) 9 (39) 50–56
Vk2 1 (12.5) 3 (20) 4 (17) 6–10
Vk3 2 (25) 5 (33) 7 (30) 25–30
Vk4 1 (12.5) 1 (7) 2 (9) 4–19
Vk5 0 0 0 ND
Vk6 0 1 (7) 1 (5) ND
Vk7 0 0 0 ND
ND, not determined; KDE, kappa deleting element.
© 2012 John Wiley & Sons A/S 3
Puig et al. KDE & MRD in multiple myeloma

comparisons were not possible because MRD assessmentby one of the two methods could not be performed (PCRand MFC respectively) due to the unavailability of thecorresponding follow-up sample.
Discussion
The lack of a suitable marker is one of the main problemsfor using PCR techniques for MRD investigation in patients
Table 2 Junctional region description and gene segment mutations of Kde rearrangements
Patient code Kde RA Junctional region Intron Vk Kde % Of mutations
Monoallelic cases
1160 Vk1 -1/GG/-5 0 0 0
1256 Vk1 -3/C/-2 0 13G>A 0.8
1391 Vk1 -4/CC/-1 0 0 0
1431 Vk1 -1/0/-2 0 0 0
1102 Vk2 -9/A/-7 0 0 0
1213 Vk3 0/T/-2 0 0 0
1499 Vk3 0/0/-4 0 0 0
1166 Vk4 0/C/0 0 0 0
1133 Intron -3/T/-7 59A>G 0 0.9
1113 Intron -4/0/-3 24A>G 0 0.7
1277 Intron -4/0/-1 0 0 0
1504 Intron -4/C/-2 0 0 0
1484 Intron -2/0/-1 0 0 0
09-3130 Intron -4/CC/-2 0 0 0
07-6720 Intron -5/C/0 0 0 0
974 Intron -1/C/-3 61A>G 0 0.7
06-4764 Intron -4/0/-1 0 0 0
1612 Intron -2/0/-1 26A>G 0 0.7
07-4116 Intron -3/CC/0 0 0 0
07-4971 Intron -3/CT/-1 0 0 0
07-2471 Intron -1/0/-8 2C>A-62A>G 0 2.1
08-0726 Intron 0/GG/-3 28A>G 0 0.9
08-0957 Intron 0/CC/-3 0 2A>C 0.9
09-4545 Intron 0/C/-2 0 0 0
876 Intron 0/TG/-3 0 0 0
1250 Intron 0/0/-1 0 3A>G 0.7
1297 Intron -1/C/0 0 0 0
1245 Intron 0/CATAGG/-3 63A>G 0 1
Biallelic cases
08-1640 Vk1 0/GGAC/-4 10T>G 0 1.8
Vk2 -9/0/-4 0 4_5insTC 1.6
1424 Vk1 -7/0/-4 22C>T 5_7delA 2.1–0.9
Vk3 -1/0/-4 0 0 0
1477 Vk1 -4/0/-1 0 0 0
Vk3 -4/0/-1 0 0 0
1493 Vk1 -4/0/-4 0 0 0
Vk4 -5/TCC/-1 0 0 0
1315 Vk2 0/0/0 0 0 0
Vk3 -7/0/0 0 0 0
1304 Vk1 0/C/-1 0 0 0
Intron 0/0/0 28A>G 0 0.9
953 Vk1 -2/TT/-4 0 4PM 3.2
Intron -1/0/-9 0 0 0
1139 Vk2 0/C/0 1T>C 0 0.5
Intron -1/0/-5 0 0 0
1328 Vk3 -4/0/-1 0 0 0
Intron -5/0/0 0 0 0
1066 Vk3 0/TT/-6 0 92G>C 2
Intron -3/TT/-1 0 0 0
RA, rearrangement; PM, point mutations: 6C>G, 60G>A, 65C>T, 69G>A.
4 © 2012 John Wiley & Sons A/S
KDE & MRD in multiple myeloma Puig et al.

with MM (8,9). As in other postgerminal center lympho-proliferations, IGH is somatically mutated in MM and,alternatively, DJH rearrangements are only present inapproximately 60% of cases (17). We thus decided to evalu-ate the frequency and characteristics of IgK-KDE rearrange-ments in a series of 96 untreated patients with myeloma, andthe potential applicability of this rearrangement as a targetfor RQ-PCR analysis. As mentioned above, the constantpresence of SHM in VDJH rearrangements (18) is responsi-ble for the frequent mismatches between primers, probes,and the target, leading to inaccurate quantification of tumorcells. By contrast, KDE, similarly to incomplete DJH rear-rangements, are assumed to be free of SHM. Accordingly, ithas recently been shown that KDE is an excellent marker
for the detection of MRD by RQ-PCR analysis in precursor-B acute lymphoblastic leukemia (14).KDE rearrangements to the VK/intron-RSS segments were
amplified in 45% of cases in our study, a figure comparableto the 57% observed in a series of 84 patients analyzed bySouthern Blotting (19) and similar to the 55% rate (47/85cases) reported by Hadzidimitriou et al. (20) As expected,all those patients with biallelic KDE rearrangements showedan Ig lambda monoclonal component (n = 14) in serum and/or urine, whereas 16 of the 29 cases with monoallelic rear-rangements had an Igkappa monoclonal component.A recent review detailed the VK gene segment usage inMM, showing a clear preference for VK1 family followedby VK3, results also confirmed by our study (21). These
Table 3 ASO primer sequences, locations and tests
UPN Kde RA Primer sequence and location AT (°C) CT sample CT MNC DCT
07-4640 Kde-intron ATGCTGCCGTAGCCAGCTTTCCTGtTACCGGCAGCC 60 41.12 40.38 –
07-4329 Kde-intron ATGCTGCCGTAGCCAGCTTTCCTgCCCTAGTGG 60 26.44 33.50 7.06
62 25.71 33.27 7.56
64 25.51 33.35 7.84
974 Kde-intron TGCCGTAGCCAGCTTTCCTGATcGCCCTAGTGGCA 60 42.64 42.60 –
1612 Kde-intron TGCTGCCGTAGCCAGCTTTCCtgaGAGCCCTAGTG 60 24.67 36.48 11.81
62 23.79 35.71 11.92
07-4116 Kde-intron TGCCGTAGCCAGCTTTCCTGccGGAGCCC 60 33.06 33.74 –
876 Kde-intron AGCCAGCTTTCCTGATGtggccctaGTGGCAG 60 26.87 35.41 8.54
62 26.19 35.11 8.92
64 28.29 36.47 8.18
06-6087 Vk3-intron GTATAATAACTGGCCTCttctagtggcAGCCCAGGGCG 60 30.54 32.38 –
1160 Vk1/Kde TATTACTGTCAACAGTTTAATAGTTACCCTCgGCCTAGTG 60 24.11 38.98 14.87
62 23.80 39.03 15.23
1391 Vk1/Vk3 ATTACTGTCAACAGTATTATAGTTTCCCcGAGCCCTAGTGGC 60 23.57 40.31 16.74
953 Vk1/intron TTAGTGTGCAAAGTATGATAATCTCCCTttCCCTACTG 60 27.90 50.00 22.10
1477 Vk1/Vk3 CAACTTACTATTGTCAcaggctaacagtttcccGAGCC 60 25.41 34.94 9.53
62 25.33 35.78 10.45
64 25.53 35.56 10.03
1484 Vk2/intron TTACTGCATGCAAGGTACACACTGGCCctAGCCCTAG 60 31.63 50.00 18.37
08-1640 Vk1/Vk2 ACCCCTCCggacCCCTAGTGGCAGCCCAG 60 34.34 27.75 –
1493 Vk1/Vk4 AGTTTATTACTGTCAGCAATATTATAGTACTtccGAGCCCTAG 60 22.36 41.25 18.89
1315 Vk3/Vk2 TACTGCATGCRGGGTACACACTGGCCtccGGAGCCC 60 27.70 33.93 6.23
62 27.50 35.78 8.28
64 27.12 33.52 6.40
1139 Vk2/intron ATTACTGCATGCAAGGTACACACTGGCCTCtcGGAGCCCT 60 25.66 50.00 24.34
Locations of the ASO primers are underlined, and N nucleotides are represented in bold lower case letters. 974, 07-4640, 06-6087, 07-4116, and
08-1640 were excluded from further analysis after initial testing at 60°C. Optimal temperatures for selected primers are in bold.
ASO, allele-specific oligonucleotides; UPN, unknown patient number; RA, rearrangement; AT, annealing temperature; MNC, mononuclear cells.
Table 4 Quantitative range, sensitivity, correlation coefficient and slope of the ASO-RQ-PCR analysis
Case 074329 1612 876 1160 1391 953 1477 1493 1315 1139
Sensitivity 10�2 5 9 10�4 5 9 10�4 10�4 10�5 10�4 10�3 10�4 10�2 5 9 10�4
Quantitative range 10�2 10�3 10�2 5 9 10�4 5 9 10�5 10�4 10�2 5 9 10�4 10�2 10�3
Slope �3.352 �3.020 �3.546 �3.765 �3.615 �3.566 �3.648 �3.467
R2 0.994 0.980 0.995 0.993 0.991 0.999 0.991 0.985
ASO, allele-specific oligonucleotides.
© 2012 John Wiley & Sons A/S 5
Puig et al. KDE & MRD in multiple myeloma

percentages are in line with VK family usage in normal Bcells and other B-cell lymphoproliferations, largely reflectingthe distribution of VK gene segments in the germ line pool(21). Unlike other malignancies, we found no preferentialrecombination of KDE (50% VK-KDE, 50% intronRSS-KDE) (13).Rearrangements involving KDE are assumed to be free of
SHM because deletion of intervening sequences in theJK-CK intron results in the removal of the IGK enhancer,which is thought to be essential for the SHM process tooccur (13). In line with this concept, 94% of our sequenceswere unmutated and the percentage of mutations found inthe rest was close to the limit of significance (mean: 2.1%;range: 2.1–3.2). As in VDJH and DJH (18), mutations inKDE rearrangements were mostly point mutations and transi-tions. CDR3 composition and exonuclease activity did notdiffer between the two types of KDE rearrangements (intro-nRSS vs. VK) but were significantly shorter than previouslyreported for VDJH and DJH rearrangements as well as forKDE rearrangements in ALL (14,18).The ASO primer test showed a high rate of non-specific
amplification of normal MNC DNA (13 of 16 cases: 81%)compared with ALL that did so only in 11% of the KDE rear-rangements tested (14). Seventy percent of cases reached asensitivity of � 5 9 10�4 with our ASO primer approach, afigure slightly inferior to that reported in ALL, which had sen-sitivity � 10�4 in 75% of cases (22). These two pitfalls ofKDE as an MRD target in MM could be further clarified bythe following explanations: (i) IgK-KDE rearrangements onlyhave a single junction that limits the possibilities for designingan ASO primer; (ii) the CDR3 region is very short; and (iii)IgK-KDE rearrangements in MM have a highly constant pat-tern of rearrangement, which have represented a disadvantagesince traduced in frequent non-specific amplification. The twolatter features are different from ALL, in which KDE is con-sidered an excellent target for MRD assessment (14). Basedon our data, the use of KDE as a complementary MRD targetto DJH in patients with MM would increase the applicabilityof these studies in 9% of cases. Focusing on lambda patients,the addition of KDE would further increase this figure to 20%;therefore, the use of KDE as a target in this subset of patientscould represent a significant advance.From a clinical perspective, the number of cases here ana-
lyzed is insufficient to extract definitive conclusions. How-ever, in this study, the use of KDE rearrangements asmolecular target for MRD assessment in MM demonstratedpredictive value (in 5/7 cases), in occasions more accuratelythan MFC (sample 1160), thus representing a valid alterna-tive for cases not assessable with other approaches. Theseresults suggest that MRD monitoring with KDE strategiesmerits further evaluation in a large series as a complementof other MRD strategies.In summary, KDE rearrangements can be found in approx-
imately 50% of cases in MM, they can be quite easilyTable
5Clinicaldata
andcomparativeanalysis
ofKDEASO-PCR
vs.multiparametric
flow
cytometryin
eightselectedcaseswithadequate
PCR
standard
curve
Pt.
number
Age
(yr)
M-
protein
ISS
score
Hb(g/
dL)
Creat
(mg/dL)
Ca++
(mg/dL)
CRP
(mg/dL)
Bone
lesions
Treatm
ent
13q-
MRD
PROGR
(Y/N)
PFS
(mo)
Status
OS
(mo)
PCR
MFC
876
61
A-k
I11
0.8
8.20
0.20
None
TD
NNA
�N
52
Alive
52
953
74
G-k
II10.8
0.94
90.22
None
VMP
N+
+Y
31.4
Alive
56
1160
60
A-j
II9.8
0.76
8.80
1.20
Minor
Polychemotherapy+Bortezomib
Y+
�Y
28
Alive
39
1139
60
G-k
II11.5
1.20
9.42
NA
Major
TD
N+
+Y
16
Alive
41
1391
57
G-j
II13.8
1.10
91
Minor
Polychemotherapy+Bortezomib
Y+
�N
33
Alive
33
1477
63
A-k
III
8.7
1.40
9.40
0.06
Minor
Polychemotherapy+Bortezomib
N�
�N
31
Alive
31
1493
55
BJ-k
I12
0.97
8.90
0.03
Minor
VTD
Y+
�N
30
Alive
30
1612
53
G-k
II10.2
110
0.68
Minor
Polychemotherapy+Bortezomib
Y�
NA
N29
Alive
29
Pt,patient;ISS,internationalscoringsystem;Hb,hemoglobin;Creat,creatinine;CRP,C-reactiveprotein;MRD,minim
alresidualdisease;ASO-PCR,allelic
specificoligonucleotidepolymerase
chain
reaction;MFC,multiparametric
flow
cytometry;PROGR,progression;PFS,progressionfreesurvival;mo,months;OS,overallsurvival;TD,thalidomideanddexamethasone;VMP,vel-
cade,melphalan&
prednisone;VTD,velcade,thalidomide&
dexamethasone;NA,unavailable;BJ,bencejones;KDE,kappadeletingelement.
Discordantresultsare
shaded;in
dark
gray,
MRD
techniquewithhigherpredictivevalue.
6 © 2012 John Wiley & Sons A/S
KDE & MRD in multiple myeloma Puig et al.

sequenced and are essentially free of SHM. KDE rearrange-ments as alternative PCR targets for MRD assessment inMM improve the applicability of these studies in 9% ofcases overall and in 20% of lambda cases. Owing to the sin-gular characteristics of KDE in MM frequent backgroundamplification could be observed, thus reducing the sensitivityof this marker as compared to ALL.
Acknowledgements
The authors thank Phil Mason for checking the Englishusage and grammar of the manuscript & Alicia Antón fortheir technical assistance. This study was partly supportedby the grant number PS09/01450 from the Spanish ‘Fondode Investigaciones Sanitarias‘. N. Puig was partly supportedby a grant from the SEHH (Sociedad Española de Hemato-logía y Hemoterapia).
Conflict of interests
The authors declare that they have no potential conflicts ofinterest.
References
1. Bladé J, Rosiñol L, Sureda A, et al. High-dose therapy inten-sification versus continued standard chemotherapy in multiplemyeloma patients responding to the initial chemotherapy: longterm results from a prospective randomized trial from theSpanish cooperative group PETHEMA. Blood 2005;106:3755–9.
2. Child JA, Morgan GJ, Davies FE, Owen RG, Bell SE, Haw-kins K, Brown J, Drayson MT, Selby PJ. High-dose chemo-therapy with hematopoietic stem-cell rescue for multiplemyeloma. N Engl J Med 2003;348:1875–83.
3. Cavo M, Tosi P, Zamagni E, et al. Prospective, randomizedstudy of single compared with double autologous stem-celltransplantation for multiple myeloma: Bologna 96 clinicalstudy. J Clin Oncol 2007;25:2434–41.
4. Ocio EM, Mateos MV, Maiso P, Pandiella A, San-Miguel JF.New drugs in multiple myeloma: mechanisms of action andphase I/II clinical findings. Lancet Oncol 2008;9:1157–65.
5. Rajkumar SV, Harousseau JL, Durie B, et al. Consensus rec-ommendations for the uniform reporting of clinical trials:report of the International Myeloma Workshop ConsensusPanel 1. Blood 2011;117:4691–5.
6. Paiva B, Vidriales MB, Cervero J, et al. Multiparameter flowcytometric remission is the most relevant prognostic factor formultiple myeloma patients who undergo autologous stem celltransplantation. Blood 2008;112:4017–23.
7. Martinez-Sanchez P, Montejano L, Sarasquete ME, et al.Evaluation of minimal residual disease in multiple myelomapatients by fluorescent-polymerase chain reaction: the prog-nostic impact of achieving molecular response. Br J Haematol2008;142:766–74.
8. Sarasquete ME, Garcia-Sanz R, Gonzalez D, et al. Minimalresidual disease monitoring in multiple myeloma: a compari-son between allelic-specific oligonucleotide real-time quantita-tive polymerase chain reaction and flow cytometry.Haematologica 2005;90:1365–72.
9. Ladetto M, Pagliano G, Ferrero S, et al. Major tumor shrink-ing and persistent molecular remissions after consolidationwith bortezomib, thalidomide, and dexamethasone in patientswith autografted myeloma. J Clin Oncol 2010;28:2077–84.
10. Rawstron AC, Davies FE, Dasgupta R, Ashcroft AJ, PatmoreR, Drayson MT, Owen RG, Jack AS, Child JA, Morgan GJ.Flow cytometric disease monitoring in multiple myeloma: therelationship between normal and neoplastic plasma cellspredicts outcome after transplantation. Blood 2002;100:3095–100.
11. Putkonen M, Kairisto V, Juvonen V, Pelliniemi TT, RauhalaA, Itälä-Remes M, Remes K. Depth of response assessed byquantitative ASO-PCR predicts the outcome after stem celltransplantation in multiple myeloma. Eur J Haematol2010;85:416–23.
12. Gonzalez D, Gonzalez M, Alonso ME, López-Pérez R,Balanzategui A, Chillón MC, Silva M, García-Sanz R, SanMiguel JF. Incomplete DJH rearrangements as a novel tumortarget for minimal residual disease quantitation in multiplemyeloma using real-time PCR. Leukemia 2003;17:1051–7.
13. van Dongen JJ, Langerak AW, Bruggemann M, et al. Designand standardization of PCR primers and protocols for detec-tion of clonal immunoglobulin and T-cell receptor generecombinations in suspect lymphoproliferations: report of theBIOMED-2 Concerted Action BMH4-CT98-3936. Leukemia2003;17:2257–317.
14. van der Velden V, Willemse MJ, van der Schoot CE, HählenK, van Wering ER, van Dongen JJ. Immunoglobulin kappadeleting element rearrangements in precursor-B acute lympho-blastic leukemia are stable targets for detection of minimalresidual disease by real-time quantitative PCR. Leukemia2002;16:928–36.
15. Brochet X, Lefranc MP, Giudicelli V. IMGT/V-QUEST: thehighly customized and integrated system for IG and TR stan-dardized V-J and V-D-J sequence analysis. Nucleic Acids Res2008;36:W503–8.
16. van der Velden V, Cazzaniga G, Schrauder A, et al. Analysisof minimal residual disease by Ig/TCR gene rearrangements:guidelines for interpretation of real-time quantitative PCRdata. Leukemia 2007;21:604–11.
17. Gonzalez D, Balanzategui A, Garcia-Sanz R, García-Sanz R,Gutiérrez N, Seabra C, van Dongen JJ, González M, SanMiguel JF. Incomplete DJH rearrangements of the IgH geneare frequent in multiple myeloma patients: immunobiologicalcharacteristics and clinical implications. Leukemia2003;17:1398–403.
18. Gonzalez D, Gonzalez M, Balanzategui A, Sarasquete ME,López-Pérez R, Chillón MC, García-Sanz R, San Miguel JF.Molecular characteristics and gene segments usage in IGHgene rearrangements in multiple myeloma. Haematologica2005;90:906–13.
© 2012 John Wiley & Sons A/S 7
Puig et al. KDE & MRD in multiple myeloma
19. Garcia-Sanz R, Lopez-Perez R, Langerak AW, et al. Hetero-duplex PCR analysis of rearranged immunoglobulin genes forclonality assessment in multiple myeloma. Haematologica1999;84:328–35.
20. Hadzidimitriou A, Stamatopoulos K, Belessi C, et al. Immu-noglobulin genes in multiple myeloma: expressed and non-expressed repertoires, heavy and light chain pairings andsomatic mutation patterns in a series of 101 cases. Haemato-logica 2006;91:781–7.
21. Gonzalez D, van der Burg M, Garcia-Sanz R, Fenton JA,Langerak AW, González M, van Dongen JJ, San Miguel JF,Morgan GJ. Immunoglobulin gene rearrangements and the path-ogenesis of multiple myeloma. Blood 2007;110:3112–21.
22. Conter V, Bartram CR, Valsecchi MG, et al. Molecularresponse to treatment redefines all prognostic factors in chil-dren and adolescents with B-cell precursor acute lymphoblas-tic leukemia: results in 3184 patients of the AIEOP-BFMALL 2000 study. Blood 2010;115:3206–14.
8 © 2012 John Wiley & Sons A/S
KDE & MRD in multiple myeloma Puig et al.
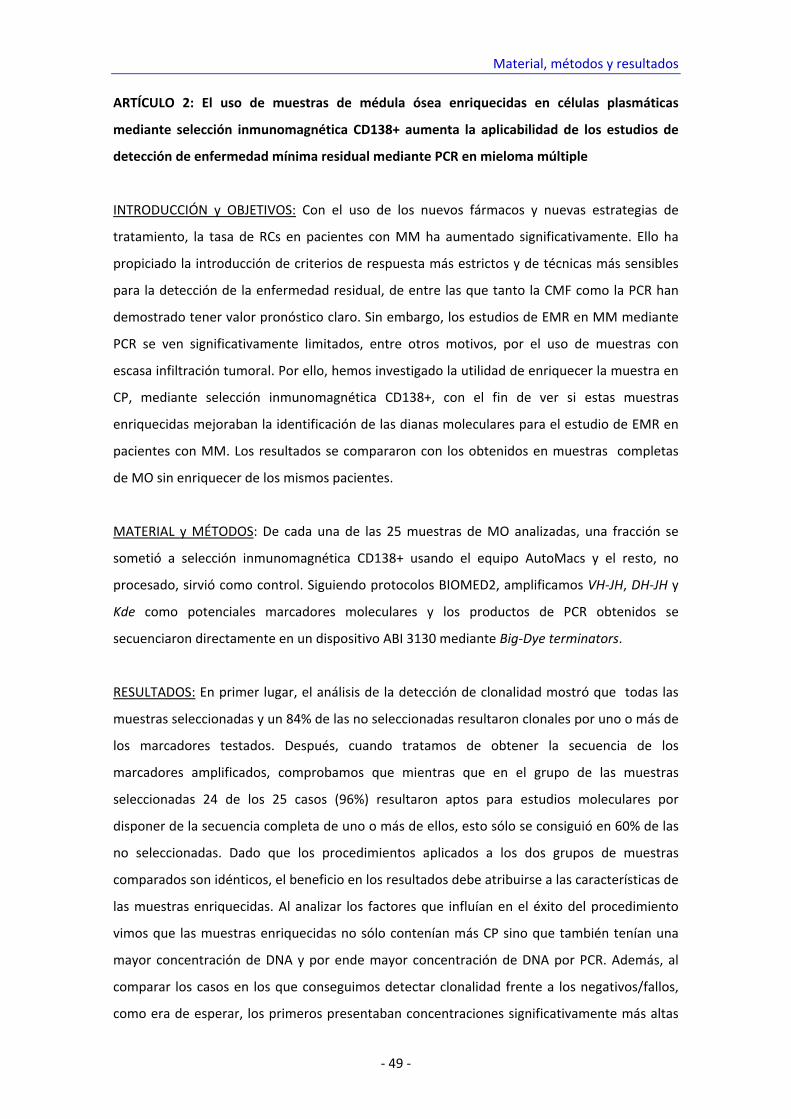
Material, métodos y resultados
‐ 49 ‐
ARTÍCULO 2: El uso de muestras de médula ósea enriquecidas en células plasmáticas
mediante selección inmunomagnética CD138+ aumenta la aplicabilidad de los estudios de
detección de enfermedad mínima residual mediante PCR en mieloma múltiple
INTRODUCCIÓN y OBJETIVOS: Con el uso de los nuevos fármacos y nuevas estrategias de
tratamiento, la tasa de RCs en pacientes con MM ha aumentado significativamente. Ello ha
propiciado la introducción de criterios de respuesta más estrictos y de técnicas más sensibles
para la detección de la enfermedad residual, de entre las que tanto la CMF como la PCR han
demostrado tener valor pronóstico claro. Sin embargo, los estudios de EMR en MM mediante
PCR se ven significativamente limitados, entre otros motivos, por el uso de muestras con
escasa infiltración tumoral. Por ello, hemos investigado la utilidad de enriquecer la muestra en
CP, mediante selección inmunomagnética CD138+, con el fin de ver si estas muestras
enriquecidas mejoraban la identificación de las dianas moleculares para el estudio de EMR en
pacientes con MM. Los resultados se compararon con los obtenidos en muestras completas
de MO sin enriquecer de los mismos pacientes.
MATERIAL y MÉTODOS: De cada una de las 25 muestras de MO analizadas, una fracción se
sometió a selección inmunomagnética CD138+ usando el equipo AutoMacs y el resto, no
procesado, sirvió como control. Siguiendo protocolos BIOMED2, amplificamos VH‐JH, DH‐JH y
Kde como potenciales marcadores moleculares y los productos de PCR obtenidos se
secuenciaron directamente en un dispositivo ABI 3130 mediante Big‐Dye terminators.
RESULTADOS: En primer lugar, el análisis de la detección de clonalidad mostró que todas las
muestras seleccionadas y un 84% de las no seleccionadas resultaron clonales por uno o más de
los marcadores testados. Después, cuando tratamos de obtener la secuencia de los
marcadores amplificados, comprobamos que mientras que en el grupo de las muestras
seleccionadas 24 de los 25 casos (96%) resultaron aptos para estudios moleculares por
disponer de la secuencia completa de uno o más de ellos, esto sólo se consiguió en 60% de las
no seleccionadas. Dado que los procedimientos aplicados a los dos grupos de muestras
comparados son idénticos, el beneficio en los resultados debe atribuirse a las características de
las muestras enriquecidas. Al analizar los factores que influían en el éxito del procedimiento
vimos que las muestras enriquecidas no sólo contenían más CP sino que también tenían una
mayor concentración de DNA y por ende mayor concentración de DNA por PCR. Además, al
comparar los casos en los que conseguimos detectar clonalidad frente a los negativos/fallos,
como era de esperar, los primeros presentaban concentraciones significativamente más altas
N. Puig. EMR en MM
‐ 50 ‐
de DNA. La misma observación se aplicaba para la comparación entre casos con secuenciación
exitosa frente a aquellos en los que la secuenciación fracasó.
CONCLUSIONES: El uso de muestras de MO enriquecidas en CP mediante selección CD138+
incrementa significativamente la aplicabilidad de los estudios de EMR en MM dado que
aumenta de 60% a 96% el porcentaje de pacientes inicialmente aptos para tales estudios por
disponer de, al menos, un marcador molecular.

ORIGINAL ARTICLE
The use of CD138 positively selected marrow samplesincreases the applicability of minimal residual diseaseassessment by PCR in patients with multiple myeloma
Noemí Puig & María E. Sarasquete & Miguel Alcoceba &
Ana Balanzategui & María C. Chillón & Elena Sebastián &
Luis A. Marín & Marcos González Díaz &
Jesús F. San Miguel & Ramón García Sanz
Received: 17 May 2012 /Accepted: 24 August 2012# Springer-Verlag 2012
Abstract We have evaluated the use of CD138+ positivelyselected bone marrow samples to identify a molecular targetfor minimal residual disease assessment by polymerasechain reaction (PCR) in 25 untreated patients with multiplemyeloma. A fraction of each sample was used for CD138+selection, and the rest served as a reference control. VDJH,DJH, and Kde gene rearrangements were tested for ampli-fication according to the BIOMED-2 Concerted Action.PCR products were directly sequenced in an automatedABI 3130 DNA sequencer using Big-Dye terminators.Within the CD138+ selected group, VDJH rearrangementswere detected in all cases (100 %), DJH in 16 (64 %), andKde in 18 (72 %) cases; whereas in the control samples,VDJH, DJH, and Kde rearrangements were detected in 19(76 %), 11 (44 %), and 12 (48 %) cases, respectively. Aftersequencing, 24 (96 %) cases within the CD138+ group had aPCR target for MRD detection compared with 15 (60 %)cases in the control group. We conclude that the use ofCD138+ positively selected bone marrow samples increases
the applicability of minimal residual disease studies by PCRin patients with multiple myeloma.
Keywords Multiple myeloma . Minimal residual disease .
Real-time quantitative PCR (RQ-PCR) . CD138+ selection .
Applicability
Introduction
Minimal residual disease (MRD) assessment has becomeroutine practice in the management of several hematologicalmalignancies, such as chronic myeloid leukemia, promye-locytic leukemia, and acute lymphoblastic leukemia. Inmultiple myeloma (MM), the situation has been very differ-ent until recently since the quality of response with conven-tional chemotherapy has been rather poor. Nevertheless, thehigh response rates associated with the use of autologousstem cell transplantation and novel agents have made com-plete response one of the treatment goals in MM [1, 2]. Inthis context, highly sensitive techniques, such as multipara-metric flow cytometry (MFC) and polymerase chain reac-tion (PCR), have revealed their prognostic value, and,furthermore, immunophenotypic and molecular remissionshave proved to be a key for long-term progression-freesurvival and potentially for overall survival (OS) [3–6].Molecular analysis of MRD in MM is frequently hamperedby inadequate diagnostic samples and/or the lack of a suit-able molecular marker [5, 6] In this study, we evaluated theuse of CD138+ positively selected marrow samples frompatients with MM at diagnosis as alternative material foridentifying targets for MRD assessment by PCR, using total
N. Puig :M. E. Sarasquete :M. Alcoceba :A. Balanzategui :M. C. Chillón : E. Sebastián : L. A. Marín :M. G. Díaz :J. F. San Miguel :R. G. Sanz (*)Servicio de Hematología, Hospital Universitario de Salamanca,Paseo de San Vicente, 58-182,Salamanca 37007, Spaine-mail: [email protected]
M. E. Sarasquete :M. Alcoceba :M. C. Chillón : L. A. Marín :M. G. Díaz : J. F. San Miguel : R. G. SanzCentro de Investigación del Cáncer (CIC),Universidad de Salamanca,Salamanca, Spain
Ann HematolDOI 10.1007/s00277-012-1566-3
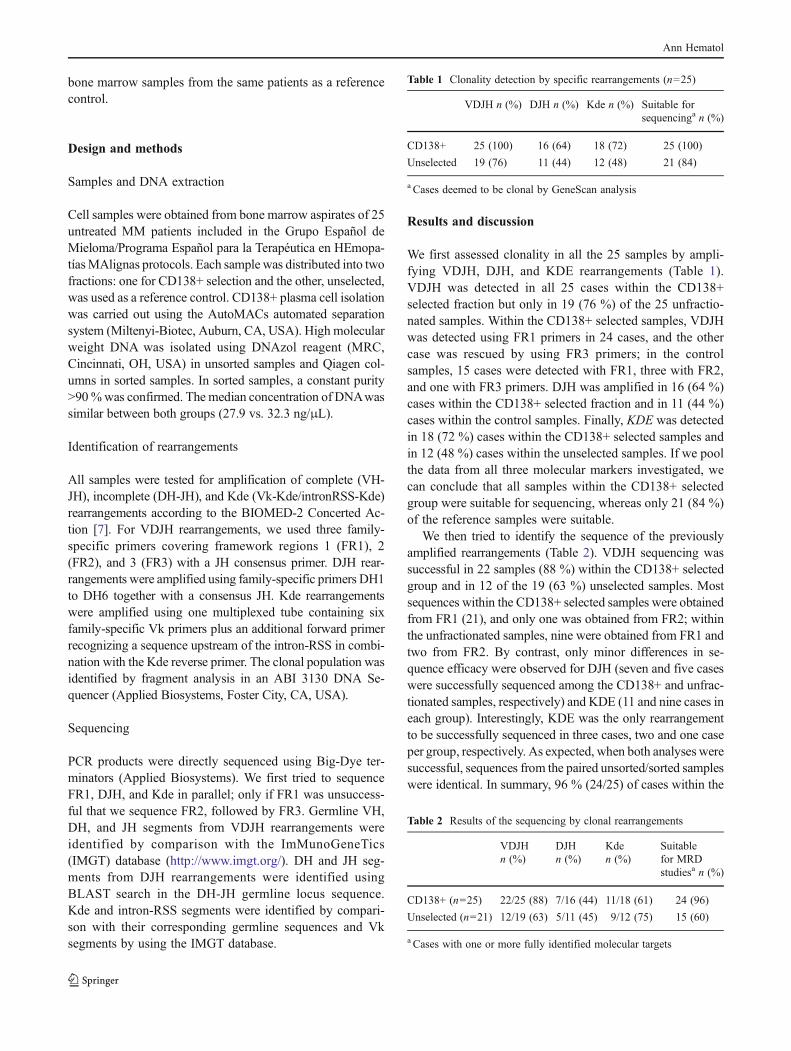
bone marrow samples from the same patients as a referencecontrol.
Design and methods
Samples and DNA extraction
Cell samples were obtained from bone marrow aspirates of 25untreated MM patients included in the Grupo Español deMieloma/Programa Español para la Terapéutica en HEmopa-tíasMAlignas protocols. Each sample was distributed into twofractions: one for CD138+ selection and the other, unselected,was used as a reference control. CD138+ plasma cell isolationwas carried out using the AutoMACs automated separationsystem (Miltenyi-Biotec, Auburn, CA, USA). High molecularweight DNA was isolated using DNAzol reagent (MRC,Cincinnati, OH, USA) in unsorted samples and Qiagen col-umns in sorted samples. In sorted samples, a constant purity>90%was confirmed. The median concentration of DNAwassimilar between both groups (27.9 vs. 32.3 ng/μL).
Identification of rearrangements
All samples were tested for amplification of complete (VH-JH), incomplete (DH-JH), and Kde (Vk-Kde/intronRSS-Kde)rearrangements according to the BIOMED-2 Concerted Ac-tion [7]. For VDJH rearrangements, we used three family-specific primers covering framework regions 1 (FR1), 2(FR2), and 3 (FR3) with a JH consensus primer. DJH rear-rangements were amplified using family-specific primers DH1to DH6 together with a consensus JH. Kde rearrangementswere amplified using one multiplexed tube containing sixfamily-specific Vk primers plus an additional forward primerrecognizing a sequence upstream of the intron-RSS in combi-nation with the Kde reverse primer. The clonal population wasidentified by fragment analysis in an ABI 3130 DNA Se-quencer (Applied Biosystems, Foster City, CA, USA).
Sequencing
PCR products were directly sequenced using Big-Dye ter-minators (Applied Biosystems). We first tried to sequenceFR1, DJH, and Kde in parallel; only if FR1 was unsuccess-ful that we sequence FR2, followed by FR3. Germline VH,DH, and JH segments from VDJH rearrangements wereidentified by comparison with the ImMunoGeneTics(IMGT) database (http://www.imgt.org/). DH and JH seg-ments from DJH rearrangements were identified usingBLAST search in the DH-JH germline locus sequence.Kde and intron-RSS segments were identified by compari-son with their corresponding germline sequences and Vksegments by using the IMGT database.
Results and discussion
We first assessed clonality in all the 25 samples by ampli-fying VDJH, DJH, and KDE rearrangements (Table 1).VDJH was detected in all 25 cases within the CD138+selected fraction but only in 19 (76 %) of the 25 unfractio-nated samples. Within the CD138+ selected samples, VDJHwas detected using FR1 primers in 24 cases, and the othercase was rescued by using FR3 primers; in the controlsamples, 15 cases were detected with FR1, three with FR2,and one with FR3 primers. DJH was amplified in 16 (64 %)cases within the CD138+ selected fraction and in 11 (44 %)cases within the control samples. Finally, KDE was detectedin 18 (72 %) cases within the CD138+ selected samples andin 12 (48 %) cases within the unselected samples. If we poolthe data from all three molecular markers investigated, wecan conclude that all samples within the CD138+ selectedgroup were suitable for sequencing, whereas only 21 (84 %)of the reference samples were suitable.
We then tried to identify the sequence of the previouslyamplified rearrangements (Table 2). VDJH sequencing wassuccessful in 22 samples (88 %) within the CD138+ selectedgroup and in 12 of the 19 (63 %) unselected samples. Mostsequences within the CD138+ selected samples were obtainedfrom FR1 (21), and only one was obtained from FR2; withinthe unfractionated samples, nine were obtained from FR1 andtwo from FR2. By contrast, only minor differences in se-quence efficacy were observed for DJH (seven and five caseswere successfully sequenced among the CD138+ and unfrac-tionated samples, respectively) and KDE (11 and nine cases ineach group). Interestingly, KDE was the only rearrangementto be successfully sequenced in three cases, two and one caseper group, respectively. As expected, when both analyses weresuccessful, sequences from the paired unsorted/sorted sampleswere identical. In summary, 96 % (24/25) of cases within the
Table 1 Clonality detection by specific rearrangements (n025)
VDJH n (%) DJH n (%) Kde n (%) Suitable forsequencinga n (%)
CD138+ 25 (100) 16 (64) 18 (72) 25 (100)
Unselected 19 (76) 11 (44) 12 (48) 21 (84)
a Cases deemed to be clonal by GeneScan analysis
Table 2 Results of the sequencing by clonal rearrangements
VDJHn (%)
DJHn (%)
Kden (%)
Suitablefor MRDstudiesa n (%)
CD138+ (n025) 22/25 (88) 7/16 (44) 11/18 (61) 24 (96)
Unselected (n021) 12/19 (63) 5/11 (45) 9/12 (75) 15 (60)
a Cases with one or more fully identified molecular targets
Ann Hematol
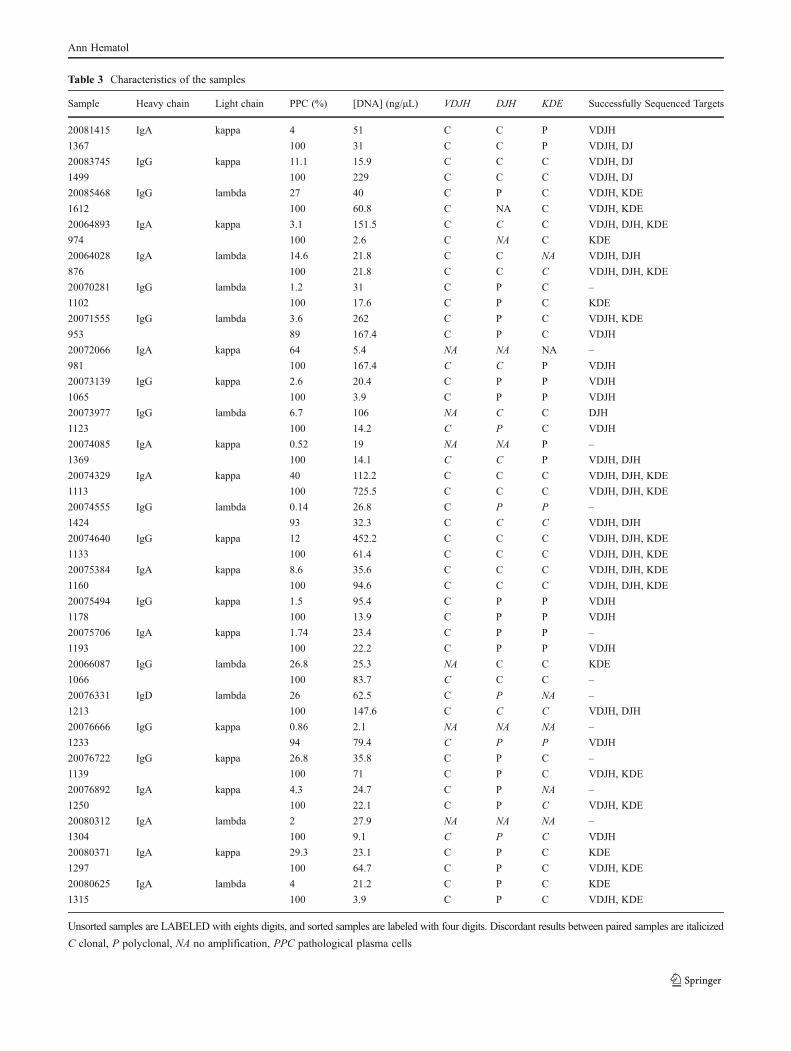
Table 3 Characteristics of the samples
Sample Heavy chain Light chain PPC (%) [DNA] (ng/μL) VDJH DJH KDE Successfully Sequenced Targets
20081415 IgA kappa 4 51 C C P VDJH
1367 100 31 C C P VDJH, DJ
20083745 IgG kappa 11.1 15.9 C C C VDJH, DJ
1499 100 229 C C C VDJH, DJ
20085468 IgG lambda 27 40 C P C VDJH, KDE
1612 100 60.8 C NA C VDJH, KDE
20064893 IgA kappa 3.1 151.5 C C C VDJH, DJH, KDE
974 100 2.6 C NA C KDE
20064028 IgA lambda 14.6 21.8 C C NA VDJH, DJH
876 100 21.8 C C C VDJH, DJH, KDE
20070281 IgG lambda 1.2 31 C P C –
1102 100 17.6 C P C KDE
20071555 IgG lambda 3.6 262 C P C VDJH, KDE
953 89 167.4 C P C VDJH
20072066 IgA kappa 64 5.4 NA NA NA –
981 100 167.4 C C P VDJH
20073139 IgG kappa 2.6 20.4 C P P VDJH
1065 100 3.9 C P P VDJH
20073977 IgG lambda 6.7 106 NA C C DJH
1123 100 14.2 C P C VDJH
20074085 IgA kappa 0.52 19 NA NA P –
1369 100 14.1 C C P VDJH, DJH
20074329 IgA kappa 40 112.2 C C C VDJH, DJH, KDE
1113 100 725.5 C C C VDJH, DJH, KDE
20074555 IgG lambda 0.14 26.8 C P P –
1424 93 32.3 C C C VDJH, DJH
20074640 IgG kappa 12 452.2 C C C VDJH, DJH, KDE
1133 100 61.4 C C C VDJH, DJH, KDE
20075384 IgA kappa 8.6 35.6 C C C VDJH, DJH, KDE
1160 100 94.6 C C C VDJH, DJH, KDE
20075494 IgG kappa 1.5 95.4 C P P VDJH
1178 100 13.9 C P P VDJH
20075706 IgA kappa 1.74 23.4 C P P –
1193 100 22.2 C P P VDJH
20066087 IgG lambda 26.8 25.3 NA C C KDE
1066 100 83.7 C C C –
20076331 IgD lambda 26 62.5 C P NA –
1213 100 147.6 C C C VDJH, DJH
20076666 IgG kappa 0.86 2.1 NA NA NA –
1233 94 79.4 C P P VDJH
20076722 IgG kappa 26.8 35.8 C P C –
1139 100 71 C P C VDJH, KDE
20076892 IgA kappa 4.3 24.7 C P NA –
1250 100 22.1 C P C VDJH, KDE
20080312 IgA lambda 2 27.9 NA NA NA –
1304 100 9.1 C P C VDJH
20080371 IgA kappa 29.3 23.1 C P C KDE
1297 100 64.7 C P C VDJH, KDE
20080625 IgA lambda 4 21.2 C P C KDE
1315 100 3.9 C P C VDJH, KDE
Unsorted samples are LABELED with eights digits, and sorted samples are labeled with four digits. Discordant results between paired samples are italicized
C clonal, P polyclonal, NA no amplification, PPC pathological plasma cells
Ann Hematol

CD138+ selected group were suitable for PCR-based MRDassessment, 14 (56 %) of them having two or more potentialspecific markers, while in the unselected samples, only 60 %(15/25) of cases were suitable for MRD studies, with eight(32 %) of them having two or more markers available.
The reasons underlying these differences in clonality de-tection and sequencing efficacy between both groups have tobe necessarily related to the characteristics of the samples(Table 3) since methods of detection were uniform. One couldthink that the different percentage of pathological plasma cellsbetween the two cohorts (100 vs. 6.7 %) is the only reasonexplaining the higher efficiency in target identification ob-served in the purified group. However, within the unselectedsamples, the percentage of plasma cells was not significantlydifferent between clonal and nonclonal samples (6.7 vs.1.4 %, P> .05). In contrast, DNA concentration was higherin the clonal group than in the rest of the samples (35.6 vs.12.2 ng/μL, P00.01). Similar results were obtained whenanalyzing factors influencing the outcome of the sequencing,being DNA concentration higher in samples with at least onesequenced target than in those failing to provide any molecu-lar marker (40 vs. 25.7 ng/μL, P00.09). Obviously, the mainvariable influencing the success of target identification wasthe relative amount of tumoral DNA added per PCR assay(estimated by using both plasma cell percentage and DNAconcentration; 23.4 vs. 2.3 ng/μL, P00.02). Finally, in isolat-ed cases in which target identification failed, reasons couldrely on unobjectifiable poor DNA quality.
Previous studies of MRD in patients with MM have attrib-uted molecular analysis failures to the lack of a molecularmarker and to the inadequate quality of the diagnostic samples[5, 6]. In a recent study by Ladetto et al., 39 patients weresuccessfully analyzed, but they had to previously exclude 62cases due to the lack of a PCR marker, 38 of them due tounsuccessful sequencing [6]. Of the 62 patients initially en-rolled for MRD assessment by Martinelli et al., 44 (71 %)could be analyzed (12 were not studied due to the lack of anadequate sample and neither CDRII nor CDRIII could beidentified in six patients) [8]. In the study by Sarasquete etal., 12 of the 53 patients enrolled were excluded (four haddegraded diagnostic DNA, nine had too few tumor cells to beable to obtain a PCR product that was good enough to besequenced, and in three cases no IGH rearrangement could beamplified), thus giving an applicability rate of 77% [5]. In ourstudy, the applicability rate increased from 60 to 96%with theuse of CD138+ selected samples, which compares favorablywith previous reports. Cloning of the PCR product could be analternative strategy to further optimize the identification ofPCR targets for MRD assessment in myeloma, although as-sociated to high material and human costs and, thus, not easilyapplicable into the routine daily practice.
In MM, MRD assessment by RQ-PCR provides similarprognostic information to MFC [5], an approach that has
provided highly important information [3]. In addition, thePCR strategy can be used in cases where MFC cannotdiscriminate between pathological and normal plasma cells(~10 %) as well as to detect small tumor populations phe-notypically different to the dominant clone. However, RQ-PCR for MRD evaluation in MM has not been implementedinto the routine clinical practice, in part due to its lowapplicability, a problem that could be overcome with theuse CD138+ selected samples.
We conclude that the use of CD138 positively selectedbone marrow samples increases the applicability of MRDstudies by PCR in patients with MM, and we propose that itshould be considered for inclusion as part of routine practicein the MM bone marrow samples processing.
Acknowledgments The authors thank Phil Mason for checking theEnglish usage and grammar of the manuscript and Alicia Antón for hertechnical assistance. This work has been partially supported by thegrant number PS09/01450 from the Spanish Fondo de InvestigacionesSanitarias. N. Puig was partially supported by a grant from the Socie-dad Española de Hematología y Hemoterapia.
Conflict of Interest The authors declare that they have no conflictsof interest.
References
1. Chanan-Khan AA, Giralt S (2010) Importance of achieving a com-plete response in multiple myeloma, and the impact of novel agents.J Clin Oncol 28:2612–2624
2. Rajkumar SV, Harousseau JL, Durie B, Anderson KC et al (2011)Consensus recommendations for the uniform reporting of clinicaltrials: report of the International Myeloma Workshop ConsensusPanel 1. Blood 117(18):4691–4695
3. Paiva B, Vidriales MB, Cerveró J, Mateo G et al (2008) Multipa-rameter flow cytometry is the most relevant prognostic factor formultiple myeloma patients who undergo autologous stem cell trans-plantation. Blood 112:4017–40213
4. Martínez-Sánchez P, Montejano L, Sarasquete ME, García-Sanz Ret al (2008) Evaluation of minimal residual disease in multiplemyeloma patients by fluorescent-PCR: the prognostic impact ofachieving molecular response. Br J Haematol 142:766–774
5. Sarasquete ME, García-Sanz R, González D, Martínez J et al (2005)Minimal residual disease monitoring in multiple myeloma: a com-parison between allelic specific real-time oligonucleotide polymer-ase quantitative and flow cytometry. Haematologica 90:1365–1372
6. Ladetto M, Pagliano A, Ferrero S, Cavallo F et al (2010) Major tumorshrinking and persistent molecular remissions after consolidation withbortezomib, thalidomide, and dexamethasone in patients with auto-grafted myeloma. J Clin Oncol 28(12):2077–2084
7. van Dongen JJM, Langerak AW, Brüggemann M, Evans PAS et al(2003) Design and standardization of PCR primers and protocols fordetection of clonal immunoglobulin and T-cell receptor gene recombi-nations in suspect lymphoproliferations: report of the BIOMED-2Concerted Action BMH4-CT98-3936. Leukemia 17:2257–2317
8. Martinelli G, Terragna C, Zamagni E, Ronconi S et al (2000)Molecular remission after allogeneic or autologous transplantationof hematopoietic stem cells for multiple myeloma. J Clin Oncol 18(11):2273–2281
Ann Hematol

Material, métodos y resultados
‐ 51 ‐
ARTÍCULO 3: Análisis crítico de la monitorización de enfermedad mínima residual mediante
ASO RQ‐PCR en pacientes con mieloma múltiple. Comparación con la citometría de flujo.
INTRODUCCIÓN y OBJETIVOS: Hemos analizado la aplicabilidad, sensibilidad y valor pronóstico
de la ASO RQ‐PCR como método para la cuantificación de EMR en pacientes con MM
comparando los resultados con los obtenidos sobre las mismas muestras con CMF
multiparamétrica.
MATERIAL y MÉTODOS: Estudiamos 170 pacientes previamente incluidos en 3 protocolos
consecutivos de PETHEMA/GEM (GEM2000, GEM05<65 y GEM05>65) y que habían alcanzado
al menos respuesta parcial post‐tratamiento (día +100 post‐TASPE en <65 años o tras
inducción en >65 años). Para la cuantificación de EMR mediante PCR extrajimos DNA germinal
mediante métodos convencionales, amplificamos VH‐JH, DH‐JH y Kde según BIOMED2 y, tras
confirmar la existencia de clonalidad, secuenciamos los fragmentos de los genes amplificados
para caracterizar la región CDR3 de uno o más de los 3 potenciales marcadores. Una vez
diseñados los oligos complementarios a la región CDR3 y posteriormente validados, los usamos
como primer “forward” junto con 1 de las 3 sondas consenso y 1 de 6 JH intrónicas según el
método descrito por Verhagen; para Kde, usamos el método descrito por van der Velden para
LLA. Construimos una curva estándar con diluciones de la muestra del diagnóstico que
analizamos e interpretamos según van der Velden. Para el análisis de EMR mediante CMF
usamos al diagnóstico una combinación validada de anticuerpos monoclonales, con la que se
identificaron las aberraciones fenotípicas que luego se usaron para detectar las CP patológicas
en las muestras de seguimiento.
RESULTADOS: El análisis de la aplicabilidad de la técnica de PCR mostró que 31 casos se
perdieron por falta de detección clonalidad, 17 por no disponer de marcador molecular y 51
por funcionamiento subóptimo de los primers, de modo que la aplicabilidad final del
procedimiento resultó del 42%. A estos 71 casos válidos, añadimos 32 de un estudio previo
realizado por nuestro grupo, y por tanto analizamos la EMR en un total de 103 pacientes. La
presencia de enfermedad residual se detectó en 54% de los casos por ASO RQ‐PCR y en 46%
por CMF. La correlación entre los resultados de la cuantificación de EMR obtenidos por ambas
técnicas fue muy alta (r=0.881, p<0.001). La cantidad de EMR detectada reflejó la intensidad
del tratamiento administrado (trasplante vs no‐trasplante). El análisis del valor pronóstico de
los resultados obtenidos por ambas técnicas puso de manifiesto la existencia de varios
umbrales de EMR (10‐2, 10‐3 and 10‐4) capaces de segregar grupos con diferente SLP, siendo 10‐
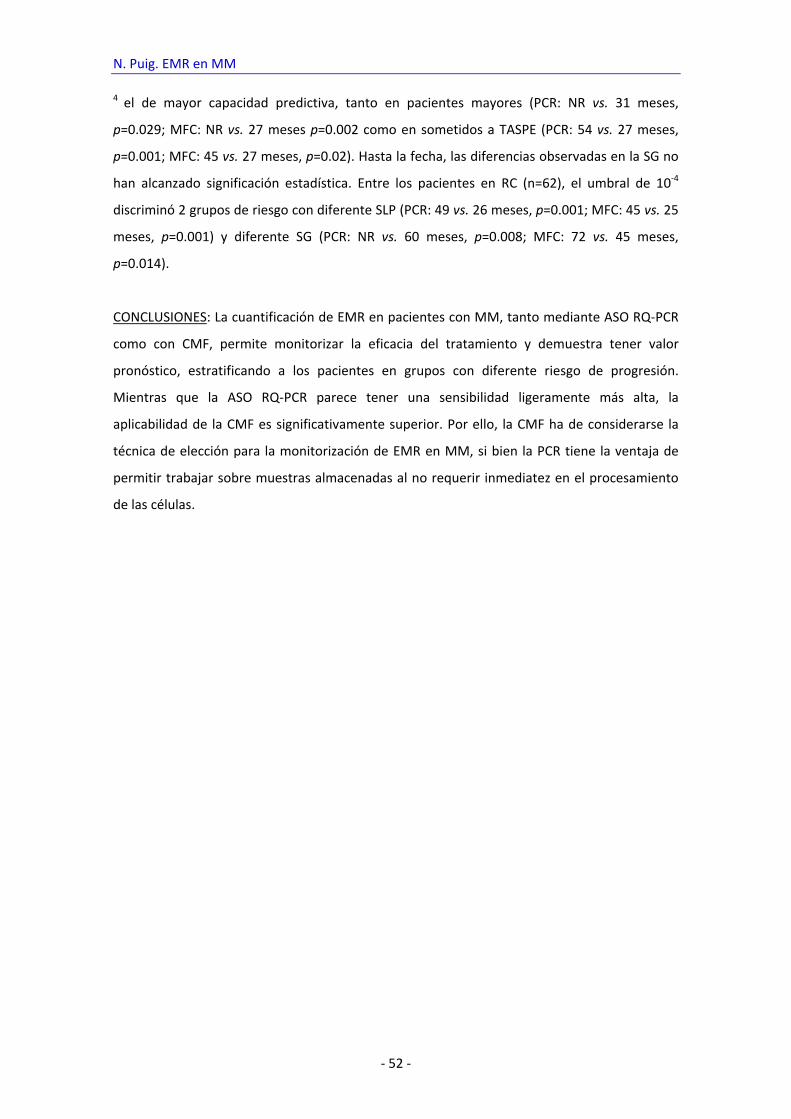
N. Puig. EMR en MM
‐ 52 ‐
4 el de mayor capacidad predictiva, tanto en pacientes mayores (PCR: NR vs. 31 meses,
p=0.029; MFC: NR vs. 27 meses p=0.002 como en sometidos a TASPE (PCR: 54 vs. 27 meses,
p=0.001; MFC: 45 vs. 27 meses, p=0.02). Hasta la fecha, las diferencias observadas en la SG no
han alcanzado significación estadística. Entre los pacientes en RC (n=62), el umbral de 10‐4
discriminó 2 grupos de riesgo con diferente SLP (PCR: 49 vs. 26 meses, p=0.001; MFC: 45 vs. 25
meses, p=0.001) y diferente SG (PCR: NR vs. 60 meses, p=0.008; MFC: 72 vs. 45 meses,
p=0.014).
CONCLUSIONES: La cuantificación de EMR en pacientes con MM, tanto mediante ASO RQ‐PCR
como con CMF, permite monitorizar la eficacia del tratamiento y demuestra tener valor
pronóstico, estratificando a los pacientes en grupos con diferente riesgo de progresión.
Mientras que la ASO RQ‐PCR parece tener una sensibilidad ligeramente más alta, la
aplicabilidad de la CMF es significativamente superior. Por ello, la CMF ha de considerarse la
técnica de elección para la monitorización de EMR en MM, si bien la PCR tiene la ventaja de
permitir trabajar sobre muestras almacenadas al no requerir inmediatez en el procesamiento
de las células.
1
TITLE: Critical evaluation of ASO RQ-PCR for minimal residual disease evaluation in multiple myeloma. A
comparative analysis with flow cytometry.
RUNNING HEAD: Residual disease in myeloma: PCR vs. flow
AUTHORS: Noemí Puig MD1, María E Sarasquete PhD,1 Ana Balanzategui,1 Joaquín Martínez PhD,2 Bruno
Paiva PhD,1 Herbert García PhD,1 Silvia Fumero MD,1 Cristina Jiménez,1 Miguel Alcoceba PhD,1 María C Chil-
lón PhD,1 Elena Sebastián MD,1 Luis Marín PhD1, María A Montalbán2, María V Mateos PhD,1 Albert Oriol,3
Luis Palomera,4 Javier de la Rubia PhD,5 María B Vidriales PhD,1Joan Bladé,6 Juan J Lahuerta,2 Marcos Gonzá-
lez PhD,1 Jesús F San Miguel PhD,1 Ramón García-Sanz PhD1
1. Department of Hematology, Hospital Universitario de Salamanca; IBSAL; IBMCC (USAL-CSIC). Sal-
amanca, Spain
2. Department of Hematology, Hospital 12 de Octubre, Madrid, Spain
3. Department of Hematology, Hospital Germans Trias I Pujol, Badalona, Spain
4. Department of Hematology, Hospital Clínico “Lozano Blesa”, Zaragoza, Spain
5. Department of Hematology, Hospital Universitario La Fe and Universidad Católica “San Vicente Már-
tir”, Valencia, Spain
6. Department of Hematology, Hospital Clinic I Provincial, Barcelona, Spain
KEYWORDS: Multiple myeloma, multiparameter flow cytometry, ASO RQ-PCR, minimal residual disease.
ADDRESS FOR CORRESPONDENCE:
Ramón García-Sanz
Department of Hematology
University Hospital of Salamanca
Paseo de San Vicente, 58-182
Salamanca, 37007
SPAIN
Phone: +34 923291629 FAX: +34 923294624
Email: [email protected]

2
RESEARCH GRANT SUPPORT: This work has been supported with grants from the Spanish “Instituto de
Salud Carlos III (ISCIII)” (PS09/1450, PI12/02311, PI09/01882 and RTICC RD12/0036/0069 & 0058), “Conse-
jería de Educación de la Junta de Castilla y León” (HUS412A12-1), and the “Asociación Española Contra el
Cáncer” (GCB 120981SAN). N. Puig was partially supported with a grant from the SEHH (Sociedad Española
de Hematología y Hemoterapia).
3
ABSTRACT
We have analyzed the applicability, sensitivity and prognostic value of Allele Specific Oligonucleotide Real
time Quantitative Polymerase Chain Reaction (ASO RQ-PCR) as method for minimal residual disease (MRD)
assessment in patients with multiple myeloma (MM), comparing the results with those of Multiparameter Flow
Cytometry (MFC). 170 patients enrolled in 3 consecutive Spanish trials achieving at least partial response after
treatment were included. Lack of clonality detection (n=31), unsuccessful sequencing (n=17), and suboptimal
ASO performance (n=51) limited the applicability of PCR to 42% of cases. MRD was finally investigated in 103
patients (including 32 previously studied) with persistent disease identified by PCR and MFC in 54% and 46%
of cases, respectively. A significant correlation in MRD quantitation by both techniques was noted (r=0.881,
p<.001) being reflective of treatment intensity. Patients with <10-4 residual tumor cells showed longer progres-
sion free survival compared to the rest (not reached vs. 31 months, p=0.002), with similar results observed with
MFC. Among complete responders (n=62), PCR discriminated two risk groups with different PFS (49 vs. 26
months, p=0.001) and OS (NR vs. 60 months, p=0.008). Thus, although less applicable than MFC, ASO RQ-
PCR is a powerful technique to assess treatment efficacy and risk stratification in MM.
KEYWORDS: Multiple myeloma, multiparameter flow cytometry, ASO RQ-PCR, minimal residual disease.
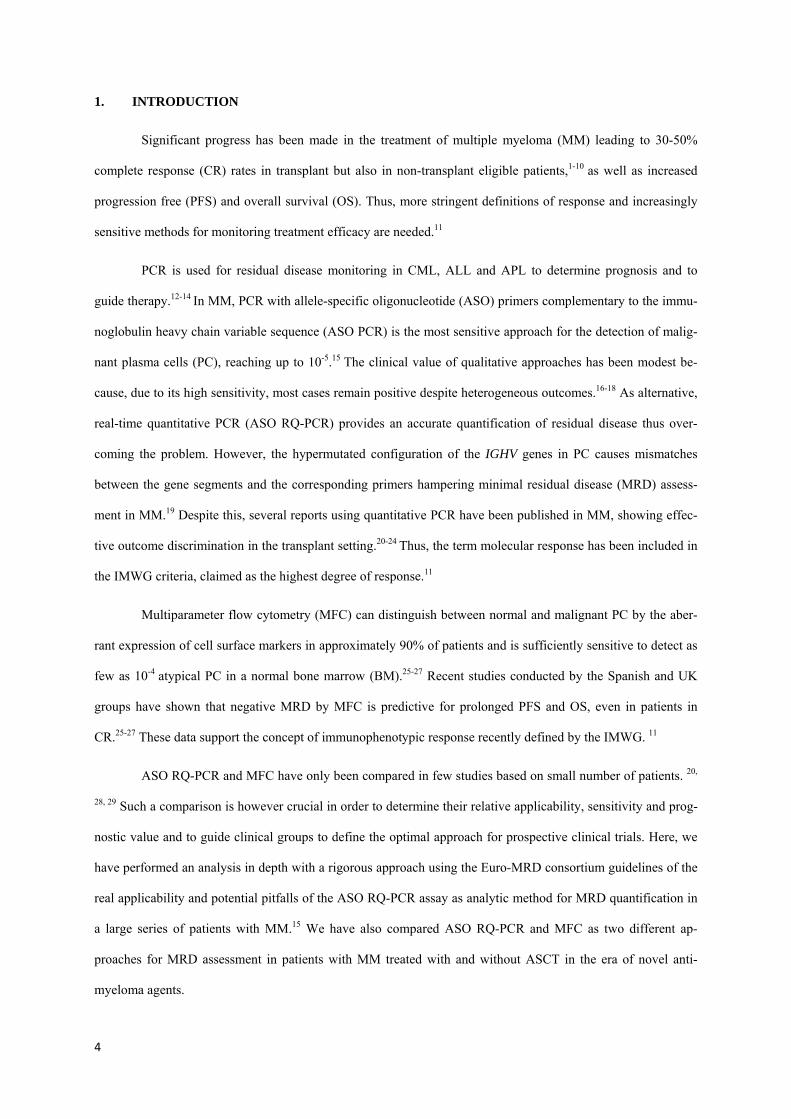
4
1. INTRODUCTION
Significant progress has been made in the treatment of multiple myeloma (MM) leading to 30-50%
complete response (CR) rates in transplant but also in non-transplant eligible patients,1-10 as well as increased
progression free (PFS) and overall survival (OS). Thus, more stringent definitions of response and increasingly
sensitive methods for monitoring treatment efficacy are needed.11
PCR is used for residual disease monitoring in CML, ALL and APL to determine prognosis and to
guide therapy.12-14 In MM, PCR with allele-specific oligonucleotide (ASO) primers complementary to the immu-
noglobulin heavy chain variable sequence (ASO PCR) is the most sensitive approach for the detection of malig-
nant plasma cells (PC), reaching up to 10-5.15 The clinical value of qualitative approaches has been modest be-
cause, due to its high sensitivity, most cases remain positive despite heterogeneous outcomes.16-18 As alternative,
real-time quantitative PCR (ASO RQ-PCR) provides an accurate quantification of residual disease thus over-
coming the problem. However, the hypermutated configuration of the IGHV genes in PC causes mismatches
between the gene segments and the corresponding primers hampering minimal residual disease (MRD) assess-
ment in MM.19 Despite this, several reports using quantitative PCR have been published in MM, showing effec-
tive outcome discrimination in the transplant setting.20-24 Thus, the term molecular response has been included in
the IMWG criteria, claimed as the highest degree of response.11
Multiparameter flow cytometry (MFC) can distinguish between normal and malignant PC by the aber-
rant expression of cell surface markers in approximately 90% of patients and is sufficiently sensitive to detect as
few as 10-4 atypical PC in a normal bone marrow (BM).25-27 Recent studies conducted by the Spanish and UK
groups have shown that negative MRD by MFC is predictive for prolonged PFS and OS, even in patients in
CR.25-27 These data support the concept of immunophenotypic response recently defined by the IMWG. 11
ASO RQ-PCR and MFC have only been compared in few studies based on small number of patients. 20,
28, 29 Such a comparison is however crucial in order to determine their relative applicability, sensitivity and prog-
nostic value and to guide clinical groups to define the optimal approach for prospective clinical trials. Here, we
have performed an analysis in depth with a rigorous approach using the Euro-MRD consortium guidelines of the
real applicability and potential pitfalls of the ASO RQ-PCR assay as analytic method for MRD quantification in
a large series of patients with MM.15 We have also compared ASO RQ-PCR and MFC as two different ap-
proaches for MRD assessment in patients with MM treated with and without ASCT in the era of novel anti-
myeloma agents.

5
2. METHODS
2.1. Patients and treatments
All patients under study were included in Spanish PETHEMA/GEM trials, namely the GEM2000
(NCT00560053; VBMCP/VBADx6 followed by ASCT), GEM05MENOS65 (NCT00461747; either
VBMCP/VBAD plus bortezomib in the last two cycles, thalidomide/dexamethasone or bortezomib/thalidomide/
dexamethasone) for transplant-eligible patients, whereas elderly patients were treated according to the
GEM05MAS65 study (NCT00443235; six induction cycles with bortezomib/melphalan/prednisone or borte-
zomib/thalidomide/prednisone). Drug dosage and schedule have been extensively described elsewhere.30, 31
Patients achieving at least partial response either at day +100 after ASCT (if included in the GEM2000 and
GEM05MENOS65 protocols) or after induction therapy (if enrolled in the GEM05MAS65 protocol) were re-
ferred for MRD investigations. Response to treatment was assessed according to the European Bone Marrow
Transplantation group, slightly modified to include the near CR category.32 Samples were collected after in-
formed consent was obtained in accordance with the Declaration of Helsinki and with approval from the ethics
committees of all participating institutions.
2.2. Sampling, DNA extraction, PCR amplification and sequencing of IGH and IGK genes
A total of 170 patients achieving at least a partial response had BM samples available both at diagnosis
and after treatment. Genomic DNA was extracted using standard methods. PCR amplifications of complete
IGHV-J, incomplete IGHD-J and IGKDEL rearrangements were performed according to the BIOMED-2 Con-
certed Action.33 The clonal population was identified by fragment analysis in an ABI3130 DNA Sequencer (Ap-
plied Biosystems, Foster City, CA) according to well-established procedures.34
Clonal products were directly sequenced twice using an automated ABI3130 DNA Sequencer using
Big-Dye terminators. Germline IGHV, IGHD, IGHJ, IGHKDEL and intron-RSS genes were identified using the
ImMunoGeneTics (IMGT)(http://www.imgt.org/) and BLAST (accession number EMB/X97051,
http://www.ncbi.nlm.nih.gov/blast/) public databases.35,36 Once the segments were identified, the N-region/s
were highlighted for ASO-primer design.

6
2.3. ASO-primer design and Real-time Quantitative PCR (RQ-PCR)
All ASO primers were designed using the OLIGO 6.1 software (Molecular Biology Insights, Cascade,
CO) complementary to the corresponding junction region/s following previously published recommendations. 37
ASO-primer specificity testing was done with DNA from diagnosis and a buffy coat from healthy do-
nors as positive and negative controls, respectively. If available, IGHD-J rearrangements were preferred as a
target, followed by IGHV-J and IGKDEL.38
For IGHV-J and IGHD-J rearrangements, the method established by Verhagen’s et al was used for RQ-
PCR.39 For IGKDEL rearrangements, we used the germline IGKDEL probe and reverse primer described by van
der Velden et al, together with the forward ASO designed at the same strand as the germline probe.40 All reac-
tions were carried out according to the EuroMRD guidelines recommendations.15
DNA from baseline samples was serially diluted into the buffy coat pool from healthy individuals from
10-1 to 10-5, and standard curves were performed with appropriate dilutions. Calculations were made to allow
amplification of 1.5 µg of MRD samples. RQ-PCR data were interpreted according to van der Velden et al.15
2.4. Minimal residual disease assessment by multiparameter flow cytometry
Erythrocyte-lysed whole BM samples were immunophenotyped using a four-color direct immunofluo-
rescence technique. The phenotypic aberrancies detected at diagnosis were used as patient-specific probes for
MRD assessment.25,41 For MRD analysis we used a two-step acquisition procedure: first, information from 2-
5x10⁴ events corresponding to whole sample cellularity was stored; then data about CD38hi gated events were
stored, between 2x10⁵ – 2x10⁶ leukocytes per tube. The multiparameter strategy used to differentiate normal and
pathological PC has been previously described.25,41 MRD negative patients were classified as those showing
absence of phenotypically aberrant PC with a sensitivity between 10-4–10-5.
2.5. Statistical methods
To estimate the statistical significance of the differences observed between means, the Mann-Whitney
U and Kruskal-Wallis tests were employed. The 2 test was used for comparison of dichotomous variables be-
tween groups. The relationship between the percentage of PC detected by ASO RQ-PCR and MFC was evaluat-
ed through Pearson correlation. Survival was analyzed by the Kaplan-Meier method, and differences between
curves were tested for statistical significance with the two-sided log-rank test. PFS was measured from the start
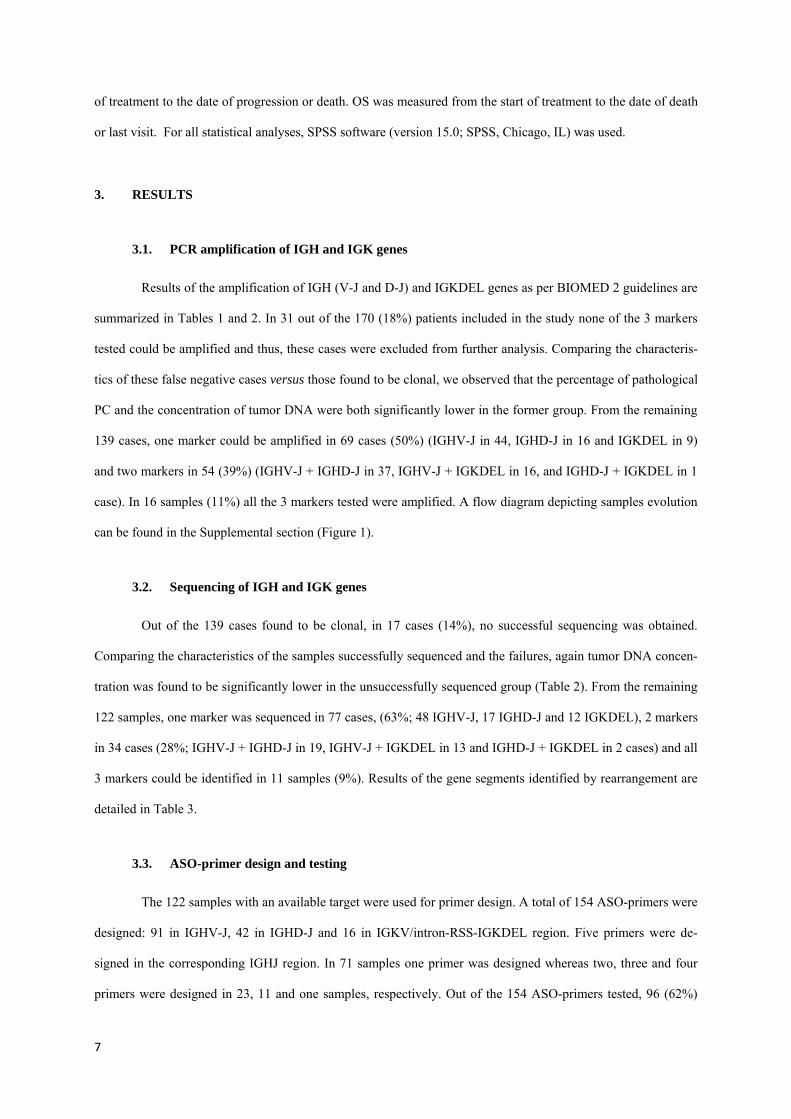
7
of treatment to the date of progression or death. OS was measured from the start of treatment to the date of death
or last visit. For all statistical analyses, SPSS software (version 15.0; SPSS, Chicago, IL) was used.
3. RESULTS
3.1. PCR amplification of IGH and IGK genes
Results of the amplification of IGH (V-J and D-J) and IGKDEL genes as per BIOMED 2 guidelines are
summarized in Tables 1 and 2. In 31 out of the 170 (18%) patients included in the study none of the 3 markers
tested could be amplified and thus, these cases were excluded from further analysis. Comparing the characteris-
tics of these false negative cases versus those found to be clonal, we observed that the percentage of pathological
PC and the concentration of tumor DNA were both significantly lower in the former group. From the remaining
139 cases, one marker could be amplified in 69 cases (50%) (IGHV-J in 44, IGHD-J in 16 and IGKDEL in 9)
and two markers in 54 (39%) (IGHV-J + IGHD-J in 37, IGHV-J + IGKDEL in 16, and IGHD-J + IGKDEL in 1
case). In 16 samples (11%) all the 3 markers tested were amplified. A flow diagram depicting samples evolution
can be found in the Supplemental section (Figure 1).
3.2. Sequencing of IGH and IGK genes
Out of the 139 cases found to be clonal, in 17 cases (14%), no successful sequencing was obtained.
Comparing the characteristics of the samples successfully sequenced and the failures, again tumor DNA concen-
tration was found to be significantly lower in the unsuccessfully sequenced group (Table 2). From the remaining
122 samples, one marker was sequenced in 77 cases, (63%; 48 IGHV-J, 17 IGHD-J and 12 IGKDEL), 2 markers
in 34 cases (28%; IGHV-J + IGHD-J in 19, IGHV-J + IGKDEL in 13 and IGHD-J + IGKDEL in 2 cases) and all
3 markers could be identified in 11 samples (9%). Results of the gene segments identified by rearrangement are
detailed in Table 3.
3.3. ASO-primer design and testing
The 122 samples with an available target were used for primer design. A total of 154 ASO-primers were
designed: 91 in IGHV-J, 42 in IGHD-J and 16 in IGKV/intron-RSS-IGKDEL region. Five primers were de-
signed in the corresponding IGHJ region. In 71 samples one primer was designed whereas two, three and four
primers were designed in 23, 11 and one samples, respectively. Out of the 154 ASO-primers tested, 96 (62%)

8
were considered suitable for further analysis, whereas 58 had to be discarded. Among the 91 primers designed in
IGHV-J, 38 (42%) performed successfully, 35/42 (83%) of those designed in IGHD-J and 12/16 in IGKDEL
(75%).
3.4. ASO RQ-PCR vs. multiparameter flow cytometry
Out of the 170 cases initially included in the study, a total of 71 fulfilled Euro-MRD criteria and were
considered suitable for MRD assessment, thus conferring a final applicability to ASO RQ-PCR for MRD moni-
toring in MM of 42%. Nevertheless this percentage would increase to 70% if we exclude the 48 failures (31
patients in which clonality could not be detected plus the 17 cases with no successful sequencing) attributable to
pre-analytical problems. In order to obtain a larger series allowing us to draw stronger conclusions, for the sub-
sequent MRD analyses we added the data from 32 additional patients previously studied by our group. These 32
cases mentioned were obtained from a total of 71 initially analyzed, therefore with a similar applicability than
the present series (45%). However, since analyzed before the Euro-MRD guidelines were available, we have not
included them in the analysis of applicability and pitfalls of the ASO RQ-PCR technique based on the Euro-
MRD guidelines.15 All these samples had both a molecular marker and a patient-specific immunophenotypic
profile available for MRD assessment by ASO RQ-PCR and MFC, respectively.
A comparison between the sensitivities of ASO RQ-PCR and MFC for MRD detection in the 103 fol-
low-up samples obtained after treatment showed that ASO RQ-PCR detected clonotypic cells in 55 (54%) cases,
whereas phenotypically aberrant PC were identified by MFC in 47 (46%) cases. The mean (SD) percentage of
tumor cells detected by ASO RQ-PCR and MFC was 0.31 (1.26) and 0.39 (1.36), respectively. A significantly
high correlation between the MRD levels obtained by both techniques was observed (Figure 1; r=0.881,
p<0.001), despite 18 (17.5%) discordant cases (11 with positive MRD by ASO RQ-PCR but negative by MFC,
and 7 negative by ASO RQ-PCR but MRD positive by MFC). Grouping patients by treatment protocol, the
quantity of tumor cells detected by both techniques correlated with the intensity of the treatment received, alt-
hough not reaching statistical significance. Thus, the mean (SD) of tumor cells detected by ASO-RQ PCR was
0.60 (2.08), 0.35 (0.56) and 0.037 (0.11) for GEM2005MAS65, GEM2000, and GEM2005MENOS65 protocols,
respectively [similar for MFC: 0.70 (2.20), 0.34 (0.52), and 0.14 (0.54)].
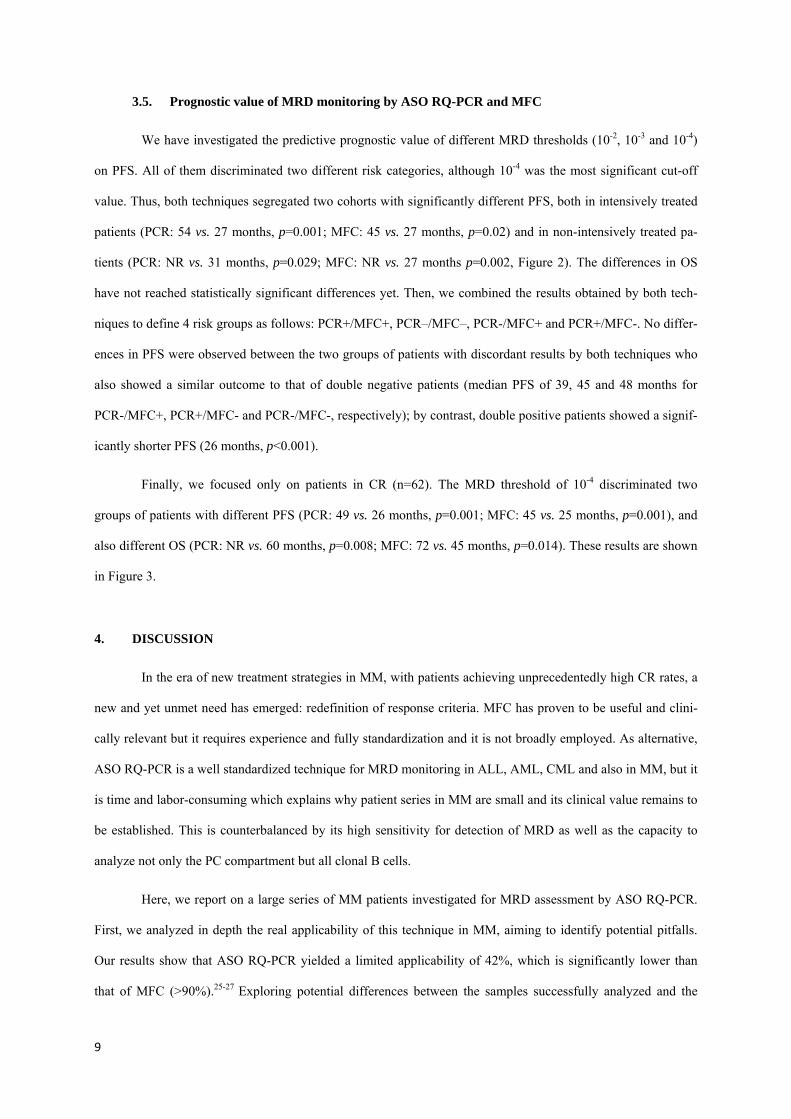
9
3.5. Prognostic value of MRD monitoring by ASO RQ-PCR and MFC
We have investigated the predictive prognostic value of different MRD thresholds (10-2, 10-3 and 10-4)
on PFS. All of them discriminated two different risk categories, although 10-4 was the most significant cut-off
value. Thus, both techniques segregated two cohorts with significantly different PFS, both in intensively treated
patients (PCR: 54 vs. 27 months, p=0.001; MFC: 45 vs. 27 months, p=0.02) and in non-intensively treated pa-
tients (PCR: NR vs. 31 months, p=0.029; MFC: NR vs. 27 months p=0.002, Figure 2). The differences in OS
have not reached statistically significant differences yet. Then, we combined the results obtained by both tech-
niques to define 4 risk groups as follows: PCR+/MFC+, PCR–/MFC–, PCR-/MFC+ and PCR+/MFC-. No differ-
ences in PFS were observed between the two groups of patients with discordant results by both techniques who
also showed a similar outcome to that of double negative patients (median PFS of 39, 45 and 48 months for
PCR-/MFC+, PCR+/MFC- and PCR-/MFC-, respectively); by contrast, double positive patients showed a signif-
icantly shorter PFS (26 months, p<0.001).
Finally, we focused only on patients in CR (n=62). The MRD threshold of 10-4 discriminated two
groups of patients with different PFS (PCR: 49 vs. 26 months, p=0.001; MFC: 45 vs. 25 months, p=0.001), and
also different OS (PCR: NR vs. 60 months, p=0.008; MFC: 72 vs. 45 months, p=0.014). These results are shown
in Figure 3.
4. DISCUSSION
In the era of new treatment strategies in MM, with patients achieving unprecedentedly high CR rates, a
new and yet unmet need has emerged: redefinition of response criteria. MFC has proven to be useful and clini-
cally relevant but it requires experience and fully standardization and it is not broadly employed. As alternative,
ASO RQ-PCR is a well standardized technique for MRD monitoring in ALL, AML, CML and also in MM, but it
is time and labor-consuming which explains why patient series in MM are small and its clinical value remains to
be established. This is counterbalanced by its high sensitivity for detection of MRD as well as the capacity to
analyze not only the PC compartment but all clonal B cells.
Here, we report on a large series of MM patients investigated for MRD assessment by ASO RQ-PCR.
First, we analyzed in depth the real applicability of this technique in MM, aiming to identify potential pitfalls.
Our results show that ASO RQ-PCR yielded a limited applicability of 42%, which is significantly lower than
that of MFC (>90%).25-27 Exploring potential differences between the samples successfully analyzed and the
10
failures, we found the former group having a significantly higher percentage of pathological PC and tumor DNA
concentration, thus highlighting the quality of the samples as an essential prerequisite to perform this type of
studies. There were some cases with a successful PCR performance and low plasma cell infiltration that would
not completely fit with this explanation, but they were a minority and further, our group has recently reported
that the use of CD138+ selected samples can improve the percentage of successfully sequenced samples from
60% to 96%.42 Most samples (88%) were referred from external centers but the analysis was performed within
the first 24 hours from collection and thus the reliability of the studies by flow is preserved: molecular studies
are not significantly affected by late sample arrival, which is of benefit in these type of centralized studies. Ex-
cluding pre-analytical problems, our study could show an applicability of 70% despite having used additional
molecular markers, such as IGHD-J or IGKV-KDE/intron-RSS known to increase the applicability of the proce-
dure in 10% and 9% additional cases, respectively. 38, 43We attribute these fu rther failures to somatic hypermuta-
tions (SHM), characteristic of MM, that surely hampered clonality detection, sequencing success and ASO per-
formance. Thus, despite various attempts of improvement, we observed a lower applicability rate than expected.
This could be due to the following reasons: 1) our study is based on an unselected sample population; 2) we have
strictly followed the Euro-MRD guidelines for interpretation of real-time quantitative PCR data and 3) we have
used the standardized method designed for ALL, using only one specific forward primer, in order to test a meth-
od potentially applicable to the routine practice. However, applicability could be increased if two specific pri-
mers and a probe are also used. The reported rate of ASO RQ-PCR aplicability rates is highly variable, ranging
from 28 to 84%. 16-18, 21,22,24,44,45These heterogenous results are probably due to the use of different methods,
including the use of specific primers and probes (mostly resulting in the higher applicability rates) as well as the
use of selected cases without information regarding pre-analytical problems. As alternative, the use of the new
high throughput sequencing strategies is opening new possibilities still under early evaluation.46,47
ASO-RQ PCR and MFC have been directly compared in two small studies, one of them performed by
our own group, and none of the techniques could be considered definitively superior to the other.20,28,29 In the
present study, the mean percentage of residual tumor cells detected by ASO RQ-PCR and MFC was not signifi-
cantly different (0.31vs 0.39, respectively). However, residual clonotypic cells could be detected by ASO-RQ-
PCR in 53% of cases while in 46% of patients using a 4-color MFC approach, thus suggesting a higher sensitivi-
ty of the former technique and further confirming the results of previous dilution experiments. Nevertheless, the
sensitivity of MFC could be increased with the use of ≥8 colors48; moreover, the correlation among the results
obtained by both techniques was very high (r=0.881), and in fact discordances among both techniques were
11
relatively low (17.5%) and could be attributed to specific factors, such as the different sensitivity of both meth-
ods as well as the different targets analyzed. Thus, ASO RQ-PCR has the theoretical advantage of being able to
identify all clonotypic cells, not only PC but also potential precursor clonal B cells, counterbalanced however by
the fact that clonality is not equivalent to malignancy or poor outcome; this could explain the lack of differences
in outcome noted between discordant cases. Regarding costs, we have estimated the prize of ASO RQ-PCR in
Spain in 350 euros per diagnostic sample and in 100 euro for follow-ups, excluding human costs; in contrast, a
4-color flow cytometry test would cost approximately 50 euros per diagnostic sample and a similar quantity in
follow-ups. However, prizes are greatly variable among countries and these numbers should be considered mere-
ly orientative.
We have also investigated the role of ASO RQ-PCR to evaluate treatment efficacy. The percentage of
patients with undetectable disease by PCR noted in our study confirms the high efficacy of current treatment
approaches in MM and highlights the efficacy of new drugs. Further, in patients with persistent disease, the re-
sidual tumor load correlates with the intensity of the treatment received. Thus, the lowest MRD level was detect-
ed in patients treated with novel agents plus ASCT, followed by conventional agents with ASCT, while the
highest MRD level corresponded to patients treated with novel agents but not transplanted. It was also remarka-
ble to see the parallelism of MFC and ASO RQ-PCR, showing both comparable results in terms of quantification
of residual tumor cells in these three therapeutic subgroups. These results confirm the utility of MRD assessment
to monitor treatment efficacy, as a valuable tool in the era of new drugs, particularly for the design of risk
adapted consolidation and maintenance therapies. 49
Finally, we have compared the ability of these 2 methods to predict outcome in the era of new treatment
strategies and drugs in MM. As shown in Figure 2, both methods offered almost superimposable survival curves
with a very high predictive value, both when used for MRD assessment in intensively treated and in non-
intensively treated patients. This was demonstrated upon using different MRD thresholds (10-2, 10-3, and 10-4).
Importantly, among patients in CR two cohorts with different PFS but also OS segregated using 10-4 as MRD
threshold, thus highlighting the heterogeneity of conventional responses and further confirming the significant
value of both methods to predict outcome. Despite these findings, it is important to note that extramedullary
relapses remain elusive for both methods. 50
Overall, our results show that ASO RQ-PCR and MFC are two valid methods to monitor treatment
efficacy, highly predictive of outcome both in transplanted and non-transplanted patients. ASO RQ-PCR is fa-

12
vored by a slightly higher sensitivity whereas MFC is significantly more applicable. Therefore, MFC should be
considered the method of choice for MRD assessment in MM, while molecular methods can be deemed as a
complementary tool until a substantial comparative advantage is demonstrated.
13
5. ACKNOWLEDGEMENTS
The authors thank Alicia Antón and Rebeca Maldonado for their technical assistance. This work has been par-
tially supported by the grants PS09/01450 and PI12/02311 from the Spanish “Instituto de Salud Carlos III
(ISCIII)”, the grants RD12/0036/0069 & 0058 from “Red Temática de Investigación Cooperativa en Cáncer
(RTICC), Spanish Ministry of Economy and Competitiveness” & European Regional Development Fund
(ERDF) “Una manera de hacer Europa”, grant number HUS412A12-1 from the “Consejería de Educación de la
Junta de Castilla y León”, and grant GCB-120981SAN from the “Asociación Española Contra el Cáncer
(AECC)”. N. Puig was partially supported with a grant from the SEHH (Sociedad Española de Hematología y
Hemoterapia).
6. DISCLOSURE OF CONFLICTS OF INTEREST
Authors have no conflicting financial interests.
Supplemental information is available at Leukemia´s website.
14
7. REFERENCE LIST
1. Lahuerta JJ, Mateos MV, Martinez-Lopez J, Rosiñol L, Sureda A, de la Rubia J, et al. Influence of pre- and
post-transplantation responses on outcome of patients with multiple myeloma: sequential improvement of
response and achievement of complete response are associated with longer survival. J.Clin Oncol.
2008;26:5775-5782.
2. Harousseau JL, Attal M, Avet-Loiseau H. The role of complete response in multiple myeloma. Blood
2009;114:3139-3146.
3. Barlogie B, Tricot G, Anaissie E, Shaughnessy J, Rasmussen E, van Rhee F, et al. Thalidomide and hema-
topoietic-cell transplantation for multiple myeloma. N Engl J Med. 2006;354:1021-1030.
4. Palumbo A, Gay F, Falco P, Crippa C, Montefusco V, Patriarca F, et al. Bortezomib as induction before
autologous transplantation, followed by lenalidomide as consolidation-maintenance in untreated multiple
myeloma patients. J Clin Oncol. 2010;28:800-807.
5. Mateos MV, Oriol A, Martínez-López J, Gutiérrez N, Teruel AI, de la Paz R, et al. Bortezomib, melphalan,
and prednisone versus bortezomib, thalidomide, and prednisone as induction therapy followed by mainte-
nance treatment with bortezomib and thalidomide versus bortezomib and prednisone in elderly patients
with untreated multiple myeloma: a randomised trial. Lancet Oncol. 2010;11:934-941.
6. San Miguel JF, Schlag R, Khuageva NK, Dimopoulos MA, Shpilberg O, Kropff M, et al. Bortezomib plus
melphalan and prednisone for initial treatment of multiple myeloma. N Engl J Med. 2008;359:906-917.
7. Kyle RA, Leong T, Li S, Oken MM, Kay NE, Van Ness B, et al. Complete response in multiple myeloma:
clinical trial E9486, an Eastern Cooperative Oncology Group study not involving stem cell transplantation.
Cancer. 2006;106:1958-1966.
8. Palumbo A, Bringhen S, Liberati AM, Caravita T, Falcone A, Callea V, et al. Oral melphalan, prednisone,
and thalidomide in elderly patients with multiple myeloma: updated results of a randomized, controlled tri-
al. Blood 2008; 112(8): 3107-3114
9. Facon T, Mary JY, Hulin C, Benboubker L, Attal M, Pegourie B, et al. Melphalan and prednisone plus
thalidomide versus melphalan and prednisone alone or reduced-intensity autologous stem cell transplanta-
tion in elderly patients with multiple myeloma (IFM 99-06): a randomised trial. Lancet 2007;370:1209-
1218.
15
10. Chanan-Khan AA, Giralt S. Importance of achieving a complete response in multiple myeloma, and the
impact of novel agents. J Clin Oncol. 2010;28:2612-2624.
11. Rajkumar SV, Harousseau JL, Durie B, Anderson KC, Dimopoulos M, Kyle R, et al. Consensus recom-
mendations for the uniform reporting of clinical trials: report of the International Myeloma Workshop Con-
sensus Panel 1. Blood 2011;117:4691-4695.
12. Brüggemann M, Schrauder A, Raff T, Pfeifer H, Dworzak M, Ottmann OG, et al. Standardized MRD quan-
tification in European ALL trials: Proceedings of the Second International Symposium on MRD assessment
in Kiel, Germany, 18-20 September 2008. Leukemia 2010;24:521-535.
13. Santamaría C, Chillón MC, Fernández C, Martín-Jiménez P, Balanzategui A, García-Sanz R, et al. Using
quantification of the PML-RARalpha transcript to stratify the risk of relapse in patients with acute promye-
locytic leukemia. Haematologica 2007;92:315-322.
14. Baccarani M, Cortes J, Pane F, Niederwieser D, Saglio G, Apperley J, et al. Chronic Myeloid Leukemia:
An Update of Concepts and Management Recommendations of European LeukemiaNet. J Clin Oncol
2009;27:6041-6051.
15. van der Velden VH, Cazzaniga G, Schrauder A, Hancock J, Bader P, Panzer-Grumayer ER, et al. Analysis
of minimal residual disease by Ig/TCR gene rearrangements: guidelines for interpretation of real-time
quantitative PCR data. Leukemia 2007;21:604-611.
16. Corradini P, Cavo M, Lokhorst H, Martinelli G, Terragna C, Majolino I, et al. Molecular remission after
myeloablative allogeneic stem cell transplantation predicts a better relapse-free survival in patients with
multiple myeloma. Blood. 2003;102:1927-1929.
17. Corradini P, Voena C, Tarella C, Astolfi M, Ladetto M, Palumbo A, et al. Molecular and clinical remis-
sions in multiple myeloma: role of autologous and allogeneic transplantation of hematopoietic cells. J.Clin
Oncol. 1999;17:208-215.
18. Martinelli G, Terragna C, Zamagni E, Ronconi S, Tosi P, Lemoli RM, et al. Molecular remission after
allogeneic or autologous transplantation of hematopoietic stem cells for multiple myeloma. J.Clin Oncol.
2000;18:2273-2281.
16
19. García-Sanz R, López-Pérez R, Langerak AW, González D, Chillón MC, Balanzategui A, et al. Heterodu-
plex PCR analysis of rearranged immunoglobulin genes for clonality assessment in multiple myeloma.
Haematologica. 1999;84:328-335.
20. Sarasquete ME, García-Sanz R, González D, Martínez J, Mateo G, Martínez P, et al. Minimal residual
disease monitoring in multiple myeloma: a comparison between allelic-specific oligonucleotide real-time
quantitative polymerase chain reaction and flow cytometry. Haematologica 2005;90:1365-1372.
21. Ladetto M, Pagliano G, Ferrero S, Cavallo F, Drandi D, Santo L, et al. Major Tumor Shrinking and Persis-
tent Molecular Remissions After Consolidation With Bortezomib, Thalidomide, and Dexamethasone in Pa-
tients With Autografted Myeloma. J Clin Oncol. 2010;28:2077-2084.
22. Bakkus MH, Bouko Y, Samson D, Apperley JF, Thielemans K, Van Camp B, et al. Post-transplantation
tumour load in bone marrow, as assessed by quantitative ASO-PCR, is a prognostic parameter in multiple
myeloma. Br J Haematol 2004;126:665-674.
23. Putkonen M, Kairisto V, Juvonen V, Pelliniemi TT, Rauhala A, Itälä-Remes M, et al. Depth of response
assessed by quantitative ASO-PCR predicts the outcome after stem cell transplantation in multiple myelo-
ma. Eur.J.Haematol. 2010;85:416-423.
24. Korthals M, Sehnke N, Kronenwett R, Bruns I, Mau J, Zohren F, et al. The level of minimal residual disease
in the bone marrow of patients with multiple myeloma before high-dose therapy and autologous blood stem
cell transplantation is an independent predictive parameter. Biol Blood Marrow Transplant 2012; 18: 423-
431.
25. Paiva B, Vidriales MB, Pérez JJ, Mateo G, Montalbán MA, Mateos MV, et al. Multiparameter flow cy-
tometry quantification of bone marrow plasma cells at diagnosis provides more prognostic information than
morphological assessment in myeloma patients. Haematologica 2009;94:1599-1602.
26. Rawstron AC, Davies FE, DasGupta R, Ashcroft AJ, Patmore R, Drayson MT, et al. Flow cytometric dis-
ease monitoring in multiple myeloma: the relationship between normal and neoplastic plasma cells predicts
outcome after transplantation. Blood. 2002;100:3095-3100.
27. Paiva B, Martínez-López J, Vidriales MB, Mateos MV, Montalbán MA, Férnandez-Redondo E, et al.
Comparison of immunofixation, serum free light chain, and immunophenotyping for response evaluation
and prognostication in multiple myeloma. J Clin Oncol. 2011;29:1627-1633.

17
28. Lioznov M, Badbaran A, Fehse B, Bacher U, Zander AR, Kröger NM. Monitoring of minimal residual
disease in multiple myeloma after allo-SCT: flow cytometry vs PCR-based techniques. Bone Marrow
Transplant. 2008;41:913-916.
29. Martínez-Sánchez P, Montejano L, Sarasquete ME, García-Sanz R, Fernández-Redondo E, Ayala R, et al.
Evaluation of minimal residual disease in multiple myeloma patients by fluorescent-polymerase chain reac-
tion: the prognostic impact of achieving molecular response. Br.J.Haematol. 2008;142:766-774.
30. Rosiñol L, Oriol A, Teruel AI, Hernández D, López-Jiménez J, de la Rubia J, et al. Superiority of borte-
zomib, thalidomide, and dexamethasone (VTD) as induction pretransplantation therapy in multiple myelo-
ma: a randomized phase 3 PETHEMA/GEM study. Blood 2012;120:1589-1596.
31. Martínez-López J, Bladé J, Mateos MV, Grande C, Alegre A, García-Laraña J, et al. Long-term prognostic
significance of response in multiple myeloma after stem cell transplantation. Blood 2011; 118(3): 529-534
32. Bladé J, Samson D, Reece D, Apperley J, Björkstrand B, Gahrton G, et al. Criteria for evaluating disease
response and progression in patients with multiple myeloma treated by high-dose therapy and haemopoietic
stem cell transplantation. Myeloma Subcommittee of the EBMT. European Group for Blood and Marrow
Transplant. Br J Haematol 1998;102:1115-1123.
33. van Dongen JJ, Langerak AW, Brüggemann M, Evans PA, Hummel M, Lavender FL, et al. Design and
standardization of PCR primers and protocols for detection of clonal immunoglobulin and T-cell receptor
gene recombinations in suspect lymphoproliferations: report of the BIOMED-2 Concerted Action BMH4-
CT98-3936. Leukemia 2003;17:2257-2317.
34. López-Pérez R, García-Sanz R, González D, Balanzategui A, Chillón MC, Alaejos I, et al. Gene scanning
of VDJH-amplified segments is a clinically relevant technique to detect contaminating tumor cells in the
apheresis products of multiple myeloma patients undergoing autologous peripheral blood stem cell trans-
plantation. Bone Marrow Transplant 2001;28:665-672.
35. Brochet X, Lefranc MP, Giudicelli V. IMGT/V-QUEST: the highly customized and integrated system for
IG and TR standardized V-J and V-D-J sequence analysis. Nucleic Acids Res. 2008;36:W503-W508.
36. González D, Balanzategui A, García-Sanz R, Gutiérrez N, Seabra C, van Dongen JJ, et al. Incomplete DJH
rearrangements of the IgH gene are frequent in multiple myeloma patients: immunobiological characteris-
tics and clinical implications. Leukemia. 2003;17:1398-1403.

18
37. van der Velden VH, Hochhaus A, Cazzaniga G, Szczepanski T, Gabert J, van Dongen JJ. Detection of
minimal residual disease in hematologic malignancies by real-time quantitative PCR: principles, approach-
es, and laboratory aspects. Leukemia 2003;17:1013-1034.
38. González D, González M, Alonso ME, López-Pérez R, Balanzategui A, Chillón MC, et al. Incomplete DJH
rearrangements as a novel tumor target for minimal residual disease quantitation in multiple myeloma using
real-time PCR. Leukemia. 2003;17:1051-1057.
39. Verhagen OJ, Willemse MJ, Breunis WB, Wijkhuijs AJ, Jacobs DC, Joosten SA, et al. Application of
germline IGH probes in real-time quantitative PCR for the detection of minimal residual disease in acute
lymphoblastic leukemia. Leukemia 2000;14:1426-1435.
40. van der Velden VH, Willemse MJ, van der Schoot CE, Hählen K, van Wering ER, van Dongen JJ. Immu-
noglobulin kappa deleting element rearrangements in precursor-B acute lymphoblastic leukemia are stable
targets for detection of minimal residual disease by real-time quantitative PCR. Leukemia 2002;16:928-
936.
41. San Miguel JF, Almeida J, Mateo G, Bladé J, López-Berges C, Caballero D, et al. Immunophenotypic
evaluation of the plasma cell compartment in multiple myeloma: a tool for comparing the efficacy of dif-
ferent treatment strategies and predicting outcome. Blood 2002;99:1853-1856.
42. Puig N, Sarasquete ME, Alcoceba M, Balanzategui A, Chillón MC, Sebastián E, et al. The use of CD138
positively selected marrow samples increases the applicability of minimal residual disease assessment by
PCR in patients with multiple myeloma. Ann.Hematol. 2013;92:97-100.
43. Puig N, Sarasquete ME, Alcoceba M, Balanzategui A, Chillón MC, Sebastián E, et al. Kappa deleting
element as an alternative molecular target for minimal residual disease assessment by real-time quantitative
PCR in patients with multiple myeloma. Eur J Haematol 2012;89:328-335.
44. Fenk R, Ak M, Kobbe G, Steidl U, Arnold C, Korthals M, et al. Levels of minimal residual disease detected
by quantitative molecular monitoring herald relapse in patients with multiple myeloma. Haematologica
2004; 89: 557-566
45. Davies F, Forsyth PD Rawstron AC, Owen RG, Pratt G, Evans PAS, et al. The impact of attaining a minimal
residual disease state after high-dose melphalan and autologous transplantataion for multiple ymeloma. Bri-
tis Journal of Haematologya 2001; 112: 814-819
19
46. Ladetto M, Bruggemann M, Ferrero S, Pepin F, Drandi D, Monitilo L, et al. Next-Generation Sequencing
and Real-Time Quantitative PCR for Minimal Residual Disease (MRD) Detection Using the Immunoglobu-
lin Heavy Chain Variable Region: A Methodical Comparison in Acute Lymphoblastic Leukemia (ALL),
Mantle Cell Lymphoma (MCL) and Multiple Myeloma (MM). ASH Annual Meeting Abstracts 2012, #788
47. Walker BA, Wardell CP, Johnson DC, Kaiser MF, Begum DB, Dahir NB, et al. Characterization Of IgH
breakpoints in multiple myeloma indicates a subset of translocations appear to occur In pre-germinal center
B cells. Blood 2013 Feb 22 [Epub ahead of print]
48. van Dongen JJ, Lhermitte L, Böttcher S, Almeida J, van der Velden VH, Flores-Montero J, et al. EuroFlow
antibody panels for standardized n-dimensional flow cytometric immunophenotyping of normal, reactive
and malignant leukocytes. Leukemia 2012; 26(9): 1908-75
49. San Miguel J, Harousseau JL, Joshua D, Anderson KC. Individualizing Treatment of Patients With Mye-
loma in the Era of Novel Agents. J Clin Oncol 2008;26:2761-2766.
50. Wirk B, Wingard JR, Moreb JS. Extramedullary disease in plasma cell myeloma: the iceberg phenomenon.
Bone Marrow Transplant. 2013;48:10-18.
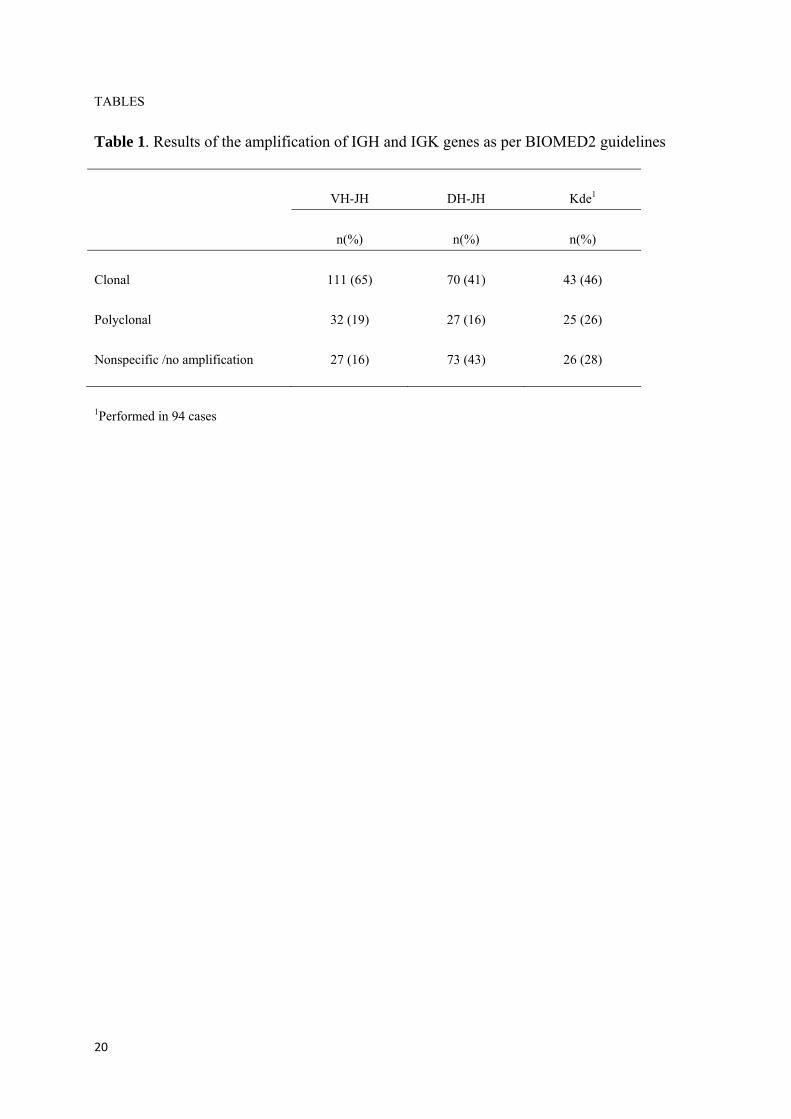
20
TABLES
Table 1. Results of the amplification of IGH and IGK genes as per BIOMED2 guidelines
VH-JH DH-JH Kde1
n(%) n(%) n(%)
Clonal 111 (65) 70 (41) 43 (46)
Polyclonal 32 (19) 27 (16) 25 (26)
Nonspecific /no amplification 27 (16) 73 (43) 26 (28)
1Performed in 94 cases
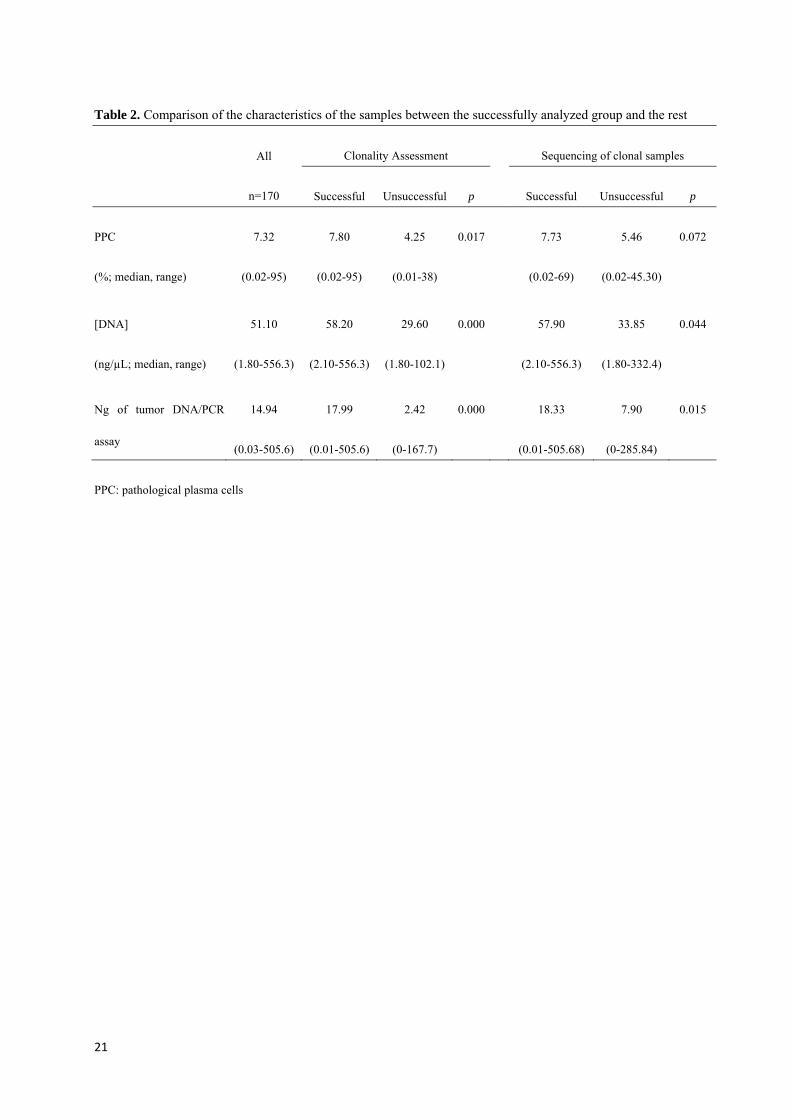
21
Table 2. Comparison of the characteristics of the samples between the successfully analyzed group and the rest
All
n=170
Clonality Assessment Sequencing of clonal samples
Successful Unsuccessful p Successful Unsuccessful p
PPC
(%; median, range)
7.32
(0.02-95)
7.80
(0.02-95)
4.25
(0.01-38)
0.017 7.73
(0.02-69)
5.46
(0.02-45.30)
0.072
[DNA]
(ng/µL; median, range)
51.10
(1.80-556.3)
58.20
(2.10-556.3)
29.60
(1.80-102.1)
0.000 57.90
(2.10-556.3)
33.85
(1.80-332.4)
0.044
Ng of tumor DNA/PCR
assay
14.94
(0.03-505.6)
17.99
(0.01-505.6)
2.42
(0-167.7)
0.000 18.33
(0.01-505.68)
7.90
(0-285.84)
0.015
PPC: pathological plasma cells

22
Table 3. Gene segments repertoire by rearrangement
IGHV-J (n=91) IGHD-J (n=48) IGKDEL rearrangements (n=37)
IGHV IGHD1 IGHJ IGHD IGHJ Monoallelic (n=26) Biallelic (n=11)
1 11 (12%) 1 6 (6%) 1 1 (1%) 1 12 (25%) 1 2 (4%) intronRSS 19 (73%) intronRSS 6 (27%)
2 6 (6%) 2 20 (22%) 2 2 (2%) 2 14 (29%) 2 0 IGKV1 4 (15%) IGKV1 6 (27%)
3 57 (63%) 3 27 (30%) 3 8 (9%) 3 4 (8%) 3 7 (14%) IGKV2 1 (4%) IGKV2 3 (14%)
4 15 (16%) 4 11 (12%) 4 44 (48%) 4 2 (4%) 4 17(35%) IGKV3 2 (8%) IGKV3 5 (23%)
5 2 (2%) 5 10 (11%) 5 13 (14%) 5 5 (10%) 5 7 (14%) IGKV4 - IGKV4 1 (5%)
6 - 6 14 (15%) 6 18 (20%) 6 6(12.5%) 6 10(21%) IGKV5 - IGKV5 -
7 1 (1%) 7 2 (2%) IGKV6 - IGKV6 1(5%)
1IGHD-J segment could not be identified in 2 cases
23
8. FIGURE LEGENDS
Figure 1. Correlation between the results of MRD quantitation by ASO-RQ PCR and MFC. Cases with discord-
ant results (n=18) have been highlighted.
Figure 2. PFS according to MRD by ASO-PCR or MFC in; A) all patients; B) transplanted patients and; C) non-
transplanted patients.
Figure 3. Progression Free and Overall Survival of Complete Responders according to MRD by ASO RQ-PCR
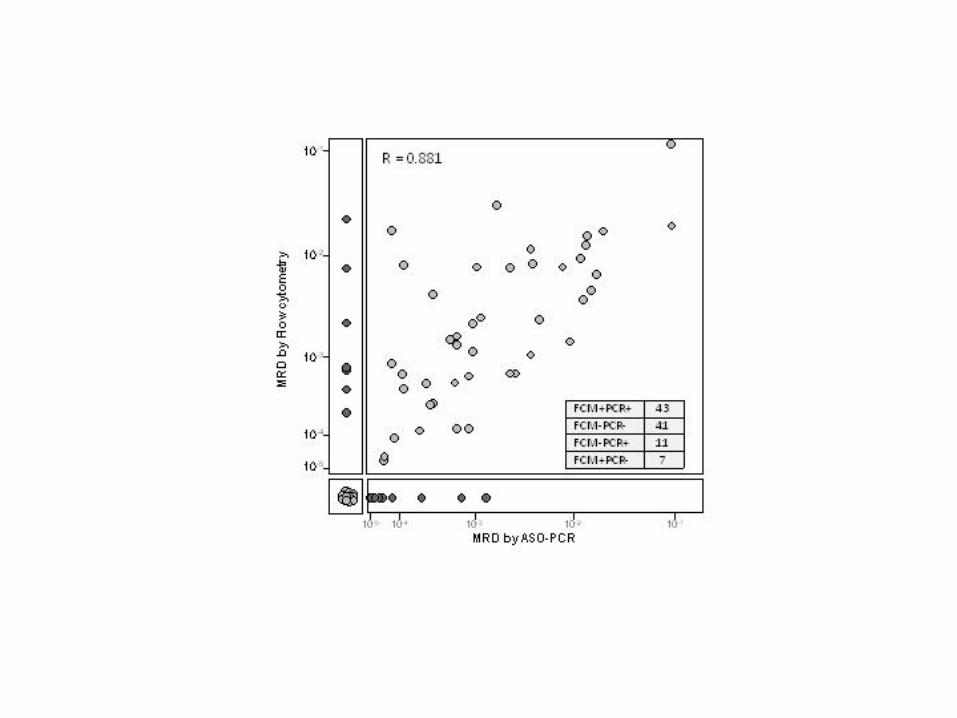

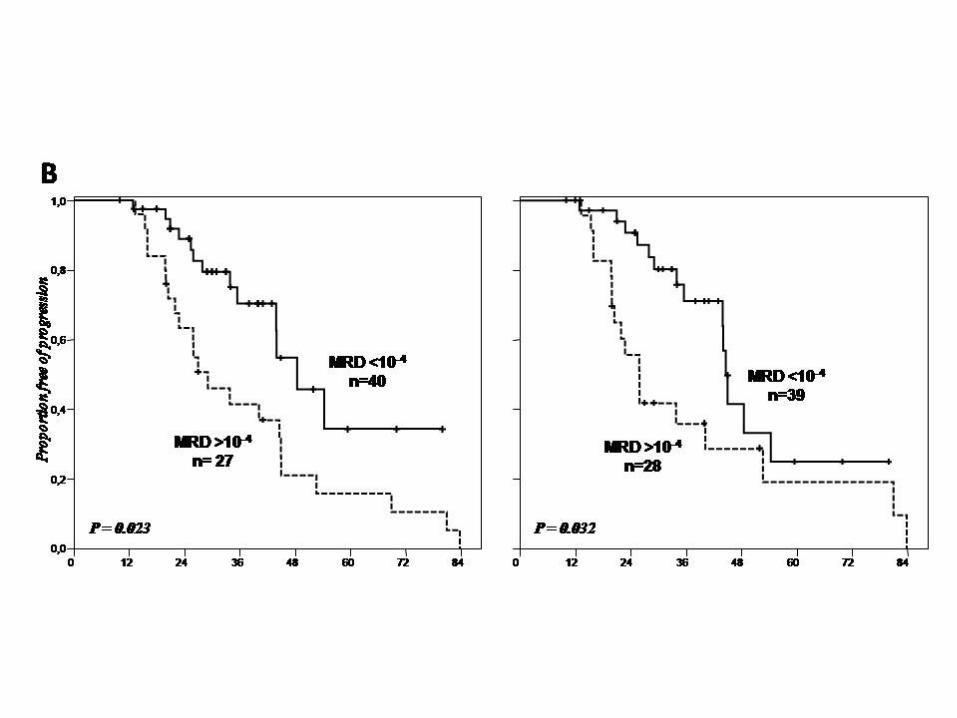
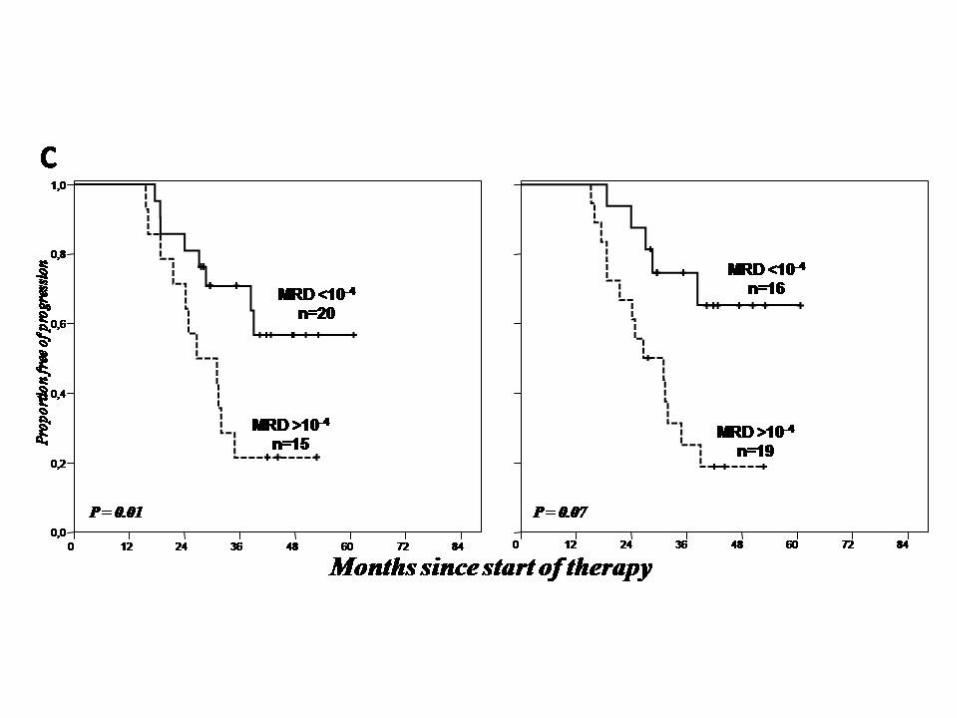


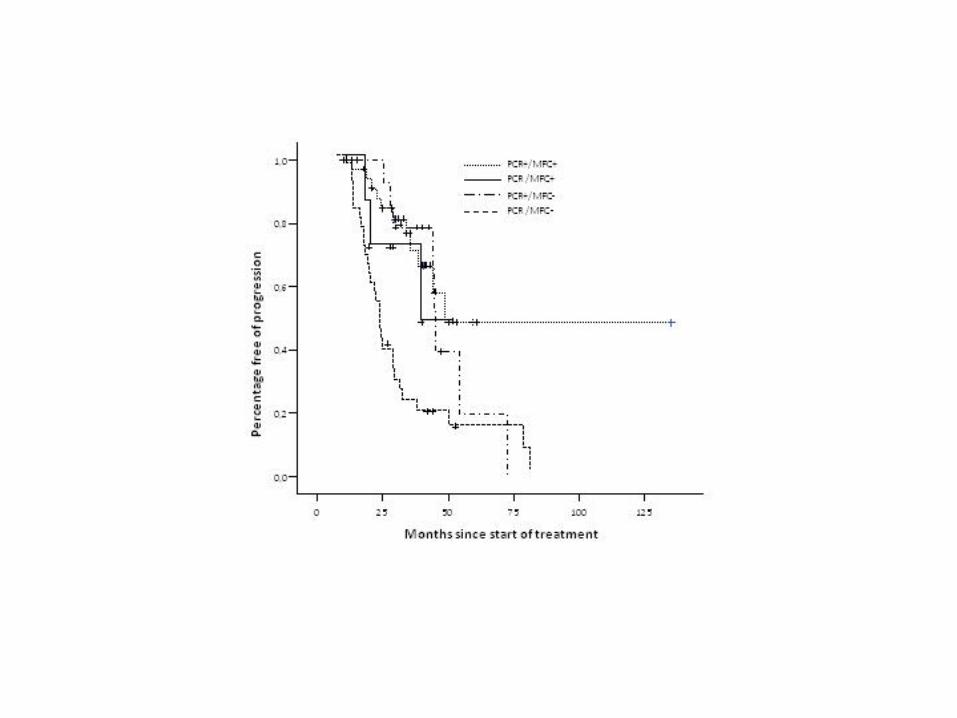

Conclusiones

N. Puig. EMR en MM
‐ 54 ‐

Conclusiones
‐ 55 ‐
‐ En relación con el uso de Kde como marcador molecular adicional para el estudio de la
enfermedad mínima residual mediante RQ‐PCR en pacientes con MM
Nuestro estudio muestra que los reordenamientos de Kde se detectan en 50% de los
pacientes con mieloma, pueden secuenciarse fácilmente y no presentan mutaciones
somáticas. Su uso como marcador adicional para el estudio de EMR en pacientes con mieloma
incrementa la aplicabilidad de estos estudios en un 9% de los casos en general y en 20% en
casos de mieloma lambda, grupo en el que supone por tanto un avance significativo.
‐ En relación con el uso de de muestras de MO enriquecidas en CP mediante selección
inmunomagnética CD138+ como material alternativo para la obtención de marcadores
moleculares para detección de enfermedad mínima residual mediante PCR en MM
Nuestros resultados muestran que el uso de muestras de MO enriquecidas en CP
mediante selección CD138+ como material para la obtención de marcadores moleculares de
EMR en pacientes con MM incrementa de 60% a 96% el porcentaje de casos con, al menos, un
marcador molecular disponible en el momento del diagnóstico. Su uso, por tanto,
incrementaría la aplicabilidad de tales estudios.
‐ En relación con el análisis crítico de la monitorización de enfermedad mínima residual en
pacientes con MM mediante ASO RQ‐PCR y la comparación con la CMF.
Nuestros resultados muestran que:
1. La técnica de ASO RQ‐PCR sólo permitiría el seguimiento de EMR en un 48% (71/170) de
los enfermos debido a fallos en: la detección de clonalidad (n=31), la obtención de la
secuencia de un marcador molecular (n=17), la disponibilidad de un ASO primer
eficiente (n=51).
2. La cuantificación de EMR en pacientes con MM, tanto mediante ASO RQ‐PCR como con
CMF, permite monitorizar la eficacia del tratamiento y demuestra tener valor
pronóstico, estratificando a los pacientes en grupos con diferente riesgo de
progresión. Mientras que la ASO RQ‐PCR tiene una sensibilidad ligeramente más alta,
la aplicabilidad de la CMF es significativamente superior. Por ello, la CMF ha de
considerarse la técnica de elección para la monitorización de EMR en MM, si bien la
PCR tiene la ventaja de permitir trabajar sobre muestras almacenadas al no requerir
inmediatez en el procesamiento de las células.


Referencias

N. Puig. EMR en MM
‐ 58 ‐

Referencias
‐ 59 ‐
Reference List
1. Swerdlow SH, Campo E, Harris NL et al. WHO Classification of Tumours of
Haematopoietic and Lymphoid Tissues.: IARC Press; 2008.
2. Dimopoulos M, Kyle R, Fermand JP et al. Consensus recommendations for standard
investigative workup: report of the International Myeloma Workshop Consensus Panel
3. Blood. 2011;117:4701‐4705.
3. McElwain TJ, Powles RL. High‐dose intravenous melphalan for plasma‐cell leukaemia
and myeloma. Lancet 1983;2:822‐824.
4. Selby PJ, McElwain TJ, Nandi AC et al. Multiple myeloma treated with high dose
intravenous melphalan. Br.J Haematol. 1987;66:55‐62.
5. Barlogie B, Dicke KA, Alexanian R. High dose melphalan for refractory myeloma‐‐the
M.D. Anderson experience. Hematol Oncol. 1988;6:167‐172.
6. Attal M, Harousseau JL, Stoppa AM et al. A prospective, randomized trial of autologous
bone marrow transplantation and chemotherapy in multiple myeloma. Intergroupe
Francais du Myelome. N.Engl.J Med. 1996;335:91‐97.
7. Child JA, Morgan GJ, Davies FE et al. High‐dose chemotherapy with hematopoietic
stem‐cell rescue for multiple myeloma. N.Engl.J Med. 2003;348:1875‐1883.
8. Blade J, Rosinol L, Sureda A et al. High‐dose therapy intensification compared with
continued standard chemotherapy in multiple myeloma patients responding to the
initial chemotherapy: long‐term results from a prospective randomized trial from the
Spanish cooperative group PETHEMA. Blood 2005;106:3755‐3759.
9. San Miguel JF, Gutierrez NC, García‐Sanz R. Thalidomide and new drugs for treatment
of multiple myeloma. Hematol J 2003;4:201‐207.
N. Puig. EMR en MM
‐ 60 ‐
10. Richardson PG, Barlogie B, Berenson J et al. A phase 2 study of bortezomib in relapsed,
refractory myeloma. N.Engl.J Med. 2003;348:2609‐2617.
11. Jagannath S, Barlogie B, Berenson J et al. A phase 2 study of two doses of bortezomib
in relapsed or refractory myeloma. Br.J.Haematol. 2004;127:165‐172.
12. Richardson PG, Sonneveld P, Schuster M et al. Extended follow‐up of a phase 3 trial in
relapsed multiple myeloma: final time‐to‐event results of the APEX trial. Blood.
2007;110:3557‐3560.
13. Orlowski RZ, Voorhees PM, Garcia RA et al. Phase 1 trial of the proteasome inhibitor
bortezomib and pegylated liposomal doxorubicin in patients with advanced
hematologic malignancies. Blood. 2005;105:3058‐3065.
14. Biehn SE, Moore DT, Voorhees PM et al. Extended follow‐up of outcome measures in
multiple myeloma patients treated on a phase I study with bortezomib and pegylated
liposomal doxorubicin. Ann.Hematol. 2007;86:211‐216.
15. Orlowski RZ, Nagler A, Sonneveld P et al. Randomized phase III study of pegylated
liposomal doxorubicin plus bortezomib compared with bortezomib alone in relapsed
or refractory multiple myeloma: combination therapy improves time to progression.
J.Clin.Oncol. 2007;25:3892‐3901.
16. Berenson JR, Boccia R, Siegel D et al. Efficacy and safety of melphalan, arsenic trioxide
and ascorbic acid combination therapy in patients with relapsed or refractory multiple
myeloma: a prospective, multicentre, phase II, single‐arm study. Br.J.Haematol.
2006;135:174‐183.
17. Berenson JR, Yang HH, Sadler K et al. Phase I/II trial assessing bortezomib and
melphalan combination therapy for the treatment of patients with relapsed or
refractory multiple myeloma. J.Clin.Oncol. 2006;%20;24:937‐944.
18. Singhal S, Mehta J, Desikan R et al. Antitumor activity of thalidomide in refractory
multiple myeloma. N.Engl.J.Med. 1999;341:1565‐1571.
Referencias
‐ 61 ‐
19. Barlogie B, Desikan R, Eddlemon P et al. Extended survival in advanced and refractory
multiple myeloma after single‐agent thalidomide: identification of prognostic factors in
a phase 2 study of 169 patients. Blood. 2001;98:492‐494.
20. Richardson PG, Schlossman RL, Weller E et al. Immunomodulatory drug CC‐5013
overcomes drug resistance and is well tolerated in patients with relapsed multiple
myeloma. Blood. 2002;100:3063‐3067.
21. Richardson PG, Blood E, Mitsiades CS et al. A randomized phase 2 study of
lenalidomide therapy for patients with relapsed or relapsed and refractory multiple
myeloma. Blood. 2006;108:3458‐3464.
22. Weber DM, Chen C, Niesvizky R et al. Lenalidomide plus dexamethasone for relapsed
multiple myeloma in North America. N.Engl.J.Med. 2007;357:2133‐2142.
23. Dimopoulos M, Spencer A, Attal M et al. Lenalidomide plus dexamethasone for
relapsed or refractory multiple myeloma. N.Engl.J Med. 2007;357:2123‐2132.
24. Knop S, Gerecke C, Liebisch P et al. Lenalidomide, adriamycin, and dexamethasone
(RAD) in patients with relapsed and refractory multiple myeloma: a report from the
German Myeloma Study Group DSMM (Deutsche Studiengruppe Multiples Myelom).
Blood. 2009;113:4137‐4143.
25. Rajkumar SV, Hayman S, Gertz MA et al. Combination therapy with thalidomide plus
dexamethasone for newly diagnosed myeloma. J Clin.Oncol. 2002;20:4319‐4323.
26. Weber D, Rankin K, Gavino M, Delasalle K, Alexanian R. Thalidomide alone or with
dexamethasone for previously untreated multiple myeloma. J Clin.Oncol. 2003;21:16‐
19.
27. Cavo M, Zamagni E, Tosi P et al. First‐line therapy with thalidomide and
dexamethasone in preparation for autologous stem cell transplantation for multiple
myeloma. Haematologica 2004;89:826‐831.
N. Puig. EMR en MM
‐ 62 ‐
28. Harousseau JL, Attal M, Leleu X et al. Bortezomib plus dexamethasone as induction
treatment prior to autologous stem cell transplantation in patients with newly
diagnosed multiple myeloma: results of an IFM phase II study. Haematologica
2006;91:1498‐1505.
29. Rosinol L, Oriol A, Mateos MV et al. Phase II PETHEMA trial of alternating bortezomib
and dexamethasone as induction regimen before autologous stem‐cell transplantation
in younger patients with multiple myeloma: efficacy and clinical implications of tumor
response kinetics. J Clin.Oncol. 2007;25:4452‐4458.
30. Lacy MQ, Gertz MA, Dispenzieri A et al. Long‐term results of response to therapy, time
to progression, and survival with lenalidomide plus dexamethasone in newly
diagnosed myeloma. Mayo Clin.Proc. 2007;82:1179‐1184.
31. Niesvizky R, Jayabalan DS, Christos PJ et al. BiRD (Biaxin [clarithromycin]/Revlimid
[lenalidomide]/dexamethasone) combination therapy results in high complete‐ and
overall‐response rates in treatment‐naive symptomatic multiple myeloma. Blood
2008;111:1101‐1109.
32. Palumbo A, Falco P, Corradini P et al. Melphalan, prednisone, and lenalidomide
treatment for newly diagnosed myeloma: a report from the GIMEMA‐‐Italian Multiple
Myeloma Network. J.Clin.Oncol. 2007;25:4459‐4465.
33. Rajkumar SV, Blood E, Vesole D, Fonseca R, Greipp PR. Phase III clinical trial of
thalidomide plus dexamethasone compared with dexamethasone alone in newly
diagnosed multiple myeloma: a clinical trial coordinated by the Eastern Cooperative
Oncology Group. J.Clin.Oncol. 2006;%20;24:431‐436.
34. Rajkumar SV, Rosinol L, Hussein M et al. Multicenter, randomized, double‐blind,
placebo‐controlled study of thalidomide plus dexamethasone compared with
dexamethasone as initial therapy for newly diagnosed multiple myeloma. J.Clin.Oncol.
2008;26:2171‐2177.
Referencias
‐ 63 ‐
35. Facon T, Mary JY, Hulin C et al. Melphalan and prednisone plus thalidomide versus
melphalan and prednisone alone or reduced‐intensity autologous stem cell
transplantation in elderly patients with multiple myeloma (IFM 99‐06): a randomised
trial. Lancet. 2007;370:1209‐1218.
36. Palumbo A, Bringhen S, Caravita T et al. Oral melphalan and prednisone chemotherapy
plus thalidomide compared with melphalan and prednisone alone in elderly patients
with multiple myeloma: randomised controlled trial. Lancet. 2006;367:825‐831.
37. Barlogie B, Tricot G, Anaissie E et al. Thalidomide and hematopoietic‐cell
transplantation for multiple myeloma. N.Engl.J.Med. 2006;354:1021‐1030.
38. Lokhorst HM, Schmidt‐Wolf I, Sonneveld P et al. Thalidomide in induction treatment
increases the very good partial response rate before and after high‐dose therapy in
previously untreated multiple myeloma. Haematologica. 2008;93:124‐127.
39. Zervas K, Mihou D, Katodritou E et al. VAD‐doxil versus VAD‐doxil plus thalidomide as
initial treatment for multiple myeloma: results of a multicenter randomized trial of the
Greek Myeloma Study Group. Ann.Oncol. 2007;18:1369‐1375.
40. San Miguel JF, Schlag R, Khuageva NK et al. Bortezomib plus melphalan and prednisone
for initial treatment of multiple myeloma. N.Engl.J.Med. 2008;359:906‐917.
41. Mateos MV, Hernandez JM, Hernandez MT et al. Bortezomib plus melphalan and
prednisone in elderly untreated patients with multiple myeloma: results of a
multicenter phase 1/2 study. Blood. 2006;108:2165‐2172.
42. Harousseau JL, Attal M, Leleu X et al. Bortezomib plus dexamethasone as induction
treatment prior to autologous stem cell transplantation in patients with newly
diagnosed multiple myeloma: results of an IFM phase II study. Haematologica.
2006;91:1498‐1505.

N. Puig. EMR en MM
‐ 64 ‐
43. Oakervee HE, Popat R, Curry N et al. PAD combination therapy (PS‐341/bortezomib,
doxorubicin and dexamethasone) for previously untreated patients with multiple
myeloma. Br.J.Haematol. 2005;129:755‐762.
44. Durie BG, Jacobson J, Barlogie B, Crowley J. Magnitude of response with myeloma
frontline therapy does not predict outcome: importance of time to progression in
southwest oncology group chemotherapy trials. J Clin.Oncol. 2004;22:1857‐1863.
45. Proposed guidelines for protocol studies. II. Plasma cell myeloma. Prepared by a
Committee of the Chronic Leukemia‐‐Myeloma Task Force, National Cancer Institute.
Cancer Chemother.Rep.3 1968;1:17‐39.
46. Proposed guidelines for protocol studies. I. Introduction. II. Plasma cell myeloma. 3.
Chronic lymphocytic leukemia. IV. Chronic granulocytic leukemia. Cancer
Chemother.Rep.3 1973;4:141‐173.
47. Gore ME, Selby PJ, Viner C et al. Intensive treatment of multiple myeloma and criteria
for complete remission. Lancet 1989;2:879‐882.
48. Vesole DH, Tricot G, Jagannath S et al. Autotransplants in multiple myeloma: what
have we learned? Blood 1996;88:838‐847.
49. Blade J, Samson D, Reece D et al. Criteria for evaluating disease response and
progression in patients with multiple myeloma treated by high‐dose therapy and
haemopoietic stem cell transplantation. Myeloma Subcommittee of the EBMT.
European Group for Blood and Marrow Transplant. Br.J Haematol. 1998;102:1115‐
1123.
50. Durie BG, Harousseau JL, Miguel JS et al. International uniform response criteria for
multiple myeloma. Leukemia 2006;20:1467‐1473.
51. Harousseau JL, Attal M, vet‐Loiseau H. The role of complete response in multiple
myeloma. Blood 2009;114:3139‐3146.
Referencias
‐ 65 ‐
52. Samson D, Gaminara E, Newland A et al. Infusion of vincristine and doxorubicin with
oral dexamethasone as first‐line therapy for multiple myeloma. Lancet 1989;2:882‐
885.
53. Dispenzieri A, Zhang L, Katzmann JA et al. Appraisal of immunoglobulin free light chain
as a marker of response. Blood 2008;111:4908‐4915.
54. Dispenzieri A, Kyle R, Merlini G et al. International Myeloma Working Group guidelines
for serum‐free light chain analysis in multiple myeloma and related disorders.
Leukemia 2009;23:215‐224.
55. Lin C, Luciani A, Belhadj K et al. Multiple myeloma treatment response assessment
with whole‐body dynamic contrast‐enhanced MR imaging. Radiology 2010;254:521‐
531.
56. Walker R, Barlogie B, Haessler J et al. Magnetic resonance imaging in multiple
myeloma: diagnostic and clinical implications. J Clin.Oncol. 2007;25:1121‐1128.
57. Dimopoulos M, Terpos E, Comenzo RL et al. International myeloma working group
consensus statement and guidelines regarding the current role of imaging techniques
in the diagnosis and monitoring of multiple Myeloma. Leukemia 2009;23:1545‐1556.
58. Campana D, Coustan‐Smith E. The use of flow cytometry to detect minimal residual
disease in acute leukemia. Eur.J Histochem. 1996;40 Suppl 1:39‐42.
59. Campana D, Coustan‐Smith E. Detection of minimal residual disease in acute leukemia
by flow cytometry. Cytometry 1999;38:139‐152.
60. Orfao A, Ciudad J, Lopez‐Berges MC et al. Acute lymphoblastic leukemia (ALL):
detection of minimal residual disease (MRD) at flow cytometry. Leuk.Lymphoma
1994;13 Suppl 1:87‐90.
61. San‐Miguel JF, Vidriales MB, Orfao A. Immunological evaluation of minimal residual
disease (MRD) in acute myeloid leukaemia (AML). Best.Pract.Res.Clin.Haematol.
2002;15:105‐118.

N. Puig. EMR en MM
‐ 66 ‐
62. Vidriales MB, San‐Miguel JF, Orfao A, Coustan‐Smith E, Campana D. Minimal residual
disease monitoring by flow cytometry. Best.Pract.Res.Clin.Haematol. 2003;16:599‐612.
63. Vidriales MB, Perez JJ, Lopez‐Berges MC et al. Minimal residual disease in adolescent
(older than 14 years) and adult acute lymphoblastic leukemias: early
immunophenotypic evaluation has high clinical value. Blood 2003;101:4695‐4700.
64. Rawstron A, Barrans S, Blythe D et al. Distribution of myeloma plasma cells in
peripheral blood and bone marrow correlates with CD56 expression. Br.J Haematol.
1999;104:138‐143.
65. Almeida J, Orfao A, Ocqueteau M et al. High‐sensitive immunophenotyping and DNA
ploidy studies for the investigation of minimal residual disease in multiple myeloma.
Br.J Haematol. 1999;107:121‐131.
66. Garcia‐Sanz R, Orfao A, Gonzalez M et al. Primary plasma cell leukemia: clinical,
immunophenotypic, DNA ploidy, and cytogenetic characteristics. Blood 1999;93:1032‐
1037.
67. Lin P, Owens R, Tricot G, Wilson CS. Flow cytometric immunophenotypic analysis of
306 cases of multiple myeloma. Am.J Clin.Pathol. 2004;121:482‐488.
68. San Miguel JF, Almeida J, Mateo G et al. Immunophenotypic evaluation of the plasma
cell compartment in multiple myeloma: a tool for comparing the efficacy of different
treatment strategies and predicting outcome. Blood 2002;99:1853‐1856.
69. Mateo MG, San M, I, Orfao de MA. Immunophenotyping of plasma cells in multiple
myeloma. Methods Mol.Med. 2005;113:5‐24.
70. Perez‐Persona E, Vidriales MB, Mateo G et al. New criteria to identify risk of
progression in monoclonal gammopathy of uncertain significance and smoldering
multiple myeloma based on multiparameter flow cytometry analysis of bone marrow
plasma cells. Blood. 2007;110:2586‐2592.

Referencias
‐ 67 ‐
71. Bataille R, Jego G, Robillard N et al. The phenotype of normal, reactive and malignant
plasma cells. Identification of "many and multiple myelomas" and of new targets for
myeloma therapy. Haematologica 2006;91:1234‐1240.
72. Rawstron AC, Orfao A, Beksac M et al. Report of the European Myeloma Network on
multiparametric flow cytometry in multiple myeloma and related disorders.
Haematologica 2008;93:431‐438.
73. Harada H, Kawano MM, Huang N et al. Phenotypic difference of normal plasma cells
from mature myeloma cells. Blood 1993;81:2658‐2663.
74. Perez‐Andres M, Santiago M, Almeida J et al. Immunophenotypic approach to the
identification and characterization of clonal plasma cells from patients with
monoclonal gammopathies. J Biol.Regul.Homeost.Agents 2004;18:392‐398.
75. Campana D, Coustan‐Smith E. Advances in the immunological monitoring of childhood
acute lymphoblastic leukaemia. Best.Pract.Res.Clin.Haematol. 2002;15:1‐19.
76. San Miguel JF, Ciudad J, Vidriales MB et al. Immunophenotypical detection of minimal
residual disease in acute leukemia. Crit Rev.Oncol.Hematol 1999;32:175‐185.
77. Ocqueteau M, Orfao A, Almeida J et al. Immunophenotypic characterization of plasma
cells from monoclonal gammopathy of undetermined significance patients.
Implications for the differential diagnosis between MGUS and multiple myeloma. Am.J
Pathol. 1998;152:1655‐1665.
78. Mateo G, Montalban MA, Vidriales MB et al. Prognostic value of immunophenotyping
in multiple myeloma: a study by the PETHEMA/GEM cooperative study groups on
patients uniformly treated with high‐dose therapy. J Clin.Oncol. 2008;26:2737‐2744.
79. Cao W, Goolsby CL, Nelson BP et al. Instability of immunophenotype in plasma cell
myeloma. Am.J Clin.Pathol. 2008;129:926‐933.

N. Puig. EMR en MM
‐ 68 ‐
80. Gupta R, Bhaskar A, Kumar L, Sharma A, Jain P. Flow cytometric immunophenotyping
and minimal residual disease analysis in multiple myeloma. Am.J Clin.Pathol.
2009;132:728‐732.
81. Rawstron AC, Davies FE, DasGupta R et al. Flow cytometric disease monitoring in
multiple myeloma: the relationship between normal and neoplastic plasma cells
predicts outcome after transplantation. Blood 2002;100:3095‐3100.
82. Liu H, Yuan C, Heinerich J et al. Flow cytometric minimal residual disease monitoring in
patients with multiple myeloma undergoing autologous stem cell transplantation: a
retrospective study. Leuk.Lymphoma. 2008;49:306‐314.
83. Rottenburger C, Kiel K, Bosing T et al. Clonotypic CD20+ and CD19+ B cells in peripheral
blood of patients with multiple myeloma post high‐dose therapy and peripheral blood
stem cell transplantation. Br.J Haematol. 1999;106:545‐552.
84. Ghosh N, Matsui W. Cancer stem cells in multiple myeloma. Cancer Lett. 2009;277:1‐7.
85. Johnsen HE, Kjeldsen MK, Urup T et al. Cancer stem cells and the cellular hierarchy in
haematological malignancies. Eur.J Cancer 2009;45 Suppl 1:194‐201.
86. Paiva B, Vidriales MB, Cervero J et al. Multiparameter flow cytometric remission is the
most relevant prognostic factor for multiple myeloma patients who undergo
autologous stem cell transplantation. Blood 2008;112:4017‐4023.
87. Hallek M, Bergsagel PL, Anderson KC. Multiple myeloma: increasing evidence for a
multistep transformation process. Blood. 1998;91:3‐21.
88. Liesveld JL, Abboud CN, Duerst RE et al. Characterization of human marrow stromal
cells: role in progenitor cell binding and granulopoiesis. Blood. 1989;73:1794‐1800.
89. Hemler ME. Adhesive protein receptors on hematopoietic cells. Immunol.Today.
1988;9:109‐113.
90. Tarlinton D. Germinal centers: getting there is half the fun. Curr.Biol. 1998;8:R753‐
R756.

Referencias
‐ 69 ‐
91. Young AJ. The physiology of lymphocyte migration through the single lymph node in
vivo. Semin.Immunol. 1999;11:73‐83.
92. Delves PJ, Roitt IM. The immune system. Second of two parts. N.Engl.J.Med.
2000;343:108‐117.
93. Delves PJ, Roitt IM. The immune system. First of two parts. N.Engl.J.Med. 2000;343:37‐
49.
94. Tarlinton D. Germinal centers: form and function. Curr.Opin.Immunol. 1998;10:245‐
251.
95. Kelsoe G. V(D)J hypermutation and receptor revision: coloring outside the lines.
Curr.Opin.Immunol. 1999;11:70‐75.
96. Slifka MK, Antia R, Whitmire JK, Ahmed R. Humoral immunity due to long‐lived plasma
cells. Immunity. 1998;8:363‐372.
97. Van Dongen JJ, Wolvers‐Tettero IL. Analysis of immunoglobulin and T cell receptor
genes. Part II: Possibilities and limitations in the diagnosis and management of
lymphoproliferative diseases and related disorders. Clin.Chim.Acta. 1991;198:93‐174.
98. Jensen GS, Mant MJ, Pilarski LM. Sequential maturation stages of monoclonal B
lineage cells from blood, spleen, lymph node, and bone marrow from a terminal
myeloma patient. Am.J.Hematol. 1992;41:199‐208.
99. Reth M. Antigen receptors on B lymphocytes. Annu.Rev.Immunol. 1992;10:97‐121.:97‐
121.
100. Edelman GM. Antibody structure and molecular immunology. Science. 1973;180:830‐
840.
101. Chu PG, Arber DA. CD79: a review. Appl.Immunohistochem.Mol.Morphol. 2001;9:97‐
106.
102. Porter RR. Structural studies of immunoglobulins. Science. 1973;180:713‐716.
N. Puig. EMR en MM
‐ 70 ‐
103. Alt FW, Blackwell TK, Yancopoulos GD. Development of the primary antibody
repertoire. Science. 1987;%20;238:1079‐1087.
104. Tonegawa S. Somatic generation of antibody diversity. Nature. 1983;302:575‐581.
105. Kirsch IR, Morton CC, Nakahara K, Leder P. Human immunoglobulin heavy chain genes
map to a region of translocations in malignant B lymphocytes. Science. 1982;216:301‐
303.
106. Malcolm S, Barton P, Murphy C et al. Localization of human immunoglobulin kappa
light chain variable region genes to the short arm of chromosome 2 by in situ
hybridization. Proc.Natl.Acad.Sci.U.S.A. 1982;79:4957‐4961.
107. Frippiat JP, Williams SC, Tomlinson IM et al. Organization of the human
immunoglobulin lambda light‐chain locus on chromosome 22q11.2. Hum.Mol.Genet.
1995;4:983‐991.
108. Erikson J, Martinis J, Croce CM. Assignment of the genes for human lambda
immunoglobulin chains to chromosome 22. Nature. 1981;294:173‐175.
109. Ruiz M, Pallares N, Contet V, Barbi V, Lefranc MP. The human immunoglobulin heavy
diversity (IGHD) and joining (IGHJ) segments. Exp.Clin.Immunogenet. 1999;16:173‐184.
110. Pallares N, Lefebvre S, Contet V, Matsuda F, Lefranc MP. The human immunoglobulin
heavy variable genes. Exp.Clin.Immunogenet. 1999;16:36‐60.
111. Lefranc MP. IMGT, the international ImMunoGeneTics database: a high‐quality
information system for comparative immunogenetics and immunology. Dev.Comp
Immunol. 2002;26:697‐705.
112. Hofker MH, Walter MA, Cox DW. Complete physical map of the human
immunoglobulin heavy chain constant region gene complex. Proc.Natl.Acad.Sci.U.S.A.
1989;86:5567‐5571.
113. Dunnick W, Hertz GZ, Scappino L, Gritzmacher C. DNA sequences at immunoglobulin
switch region recombination sites. Nucleic Acids Res. 1993;21:365‐372.
Referencias
‐ 71 ‐
114. Barbie V, Lefranc MP. The human immunoglobulin kappa variable (IGKV) genes and
joining (IGKJ) segments. Exp.Clin.Immunogenet. 1998;15:171‐183.
115. Klobeck HG, Zachau HG. The human CK gene segment and the kappa deleting element
are closely linked. Nucleic Acids Res. 1986;14:4591‐4603.
116. Kawasaki K, Minoshima S, Nakato E et al. One‐megabase sequence analysis of the
human immunoglobulin lambda gene locus. Genome Res. 1997;7:250‐261.
117. Lefranc MP, Pallares N, Frippiat JP. Allelic polymorphisms and RFLP in the human
immunoglobulin lambda light chain locus. Hum.Genet. 1999;104:361‐369.
118. Busslinger M, Nutt SL, Rolink AG. Lineage commitment in lymphopoiesis.
Curr.Opin.Immunol. 2000;12:151‐158.
119. Alt FW, Yancopoulos GD, Blackwell TK et al. Ordered rearrangement of
immunoglobulin heavy chain variable region segments. EMBO J. 1984;3:1209‐1219.
120. Sleckman BP, Gorman JR, Alt FW. Accessibility control of antigen‐receptor variable‐
region gene assembly: role of cis‐acting elements. Annu.Rev.Immunol. 1996;14:459‐
81.:459‐481.
121. Melchers F. The pre‐B‐cell receptor: selector of fitting immunoglobulin heavy chains
for the B‐cell repertoire. Nat.Rev.Immunol. 2005;5:578‐584.
122. Lanig H, Bradl H, Jack HM. Three‐dimensional modeling of a pre‐B‐cell receptor.
Mol.Immunol. 2004;40:1263‐1272.
123. Schiff C, Bensmana M, Guglielmi P et al. The immunoglobulin lambda‐like gene cluster
(14.1, 16.1 and F lambda 1) contains gene(s) selectively expressed in pre‐B cells and is
the human counterpart of the mouse lambda 5 gene. Int.Immunol. 1990;2:201‐207.
124. Minaee S, Farmer D, Georgiou A et al. Mapping and functional analysis of regulatory
sequences in the mouse lambda5‐VpreB1 domain. Mol.Immunol. 2005;42:1283‐1292.
125. Sabbattini P, Dillon N. The lambda5‐VpreB1 locus‐‐a model system for studying gene
regulation during early B cell development. Semin.Immunol. 2005;17:121‐127.

N. Puig. EMR en MM
‐ 72 ‐
126. Melchers F, ten BE, Yamagami T, Andersson J, Rolink A. The roles of preB and B cell
receptors in the stepwise allelic exclusion of mouse IgH and L chain gene loci.
Semin.Immunol. 1999;11:307‐317.
127. Wang LD, Clark MR. B‐cell antigen‐receptor signalling in lymphocyte development.
Immunology. 2003;110:411‐420.
128. Graninger WB, Goldman PL, Morton CC, O'Brien SJ, Korsmeyer SJ. The kappa‐deleting
element. Germline and rearranged, duplicated and dispersed forms. J.Exp.Med.
1988;167:488‐501.
129. Siminovitch KA, Bakhshi A, Goldman P, Korsmeyer SJ. A uniform deleting element
mediates the loss of kappa genes in human B cells. Nature. 1985;316:260‐262.
130. Gay D, Saunders T, Camper S, Weigert M. Receptor editing: an approach by
autoreactive B cells to escape tolerance. J.Exp.Med. 1993;177:999‐1008.
131. Sandel PC, Monroe JG. Negative selection of immature B cells by receptor editing or
deletion is determined by site of antigen encounter. Immunity. 1999;10:289‐299.
132. Nemazee D. Receptor editing in B cells. Adv.Immunol. 2000;74:89‐126.:89‐126.
133. Notarangelo LD, Santagata S, Villa A. Recombinase activating gene enzymes of
lymphocytes. Curr.Opin.Hematol. 2001;8:41‐46.
134. Grawunder U, West RB, Lieber MR. Antigen receptor gene rearrangement.
Curr.Opin.Immunol. 1998;10:172‐180.
135. van G, Mizuuchi K, Gellert M. Similarities between initiation of V(D)J recombination
and retroviral integration. Science. 1996;271:1592‐1594.
136. Hiom K, Gellert M. A stable RAG1‐RAG2‐DNA complex that is active in V(D)J cleavage.
Cell. 1997;88:65‐72.
137. Nussenzweig A, Chen C, da CS, V et al. Requirement for Ku80 in growth and
immunoglobulin V(D)J recombination. Nature. 1996;382:551‐555.
Referencias
‐ 73 ‐
138. Gu Y, Jin S, Gao Y, Weaver DT, Alt FW. Ku70‐deficient embryonic stem cells have
increased ionizing radiosensitivity, defective DNA end‐binding activity, and inability to
support V(D)J recombination. Proc.Natl.Acad.Sci.U.S.A. 1997;94:8076‐8081.
139. Gottlieb TM, Jackson SP. The DNA‐dependent protein kinase: requirement for DNA
ends and association with Ku antigen. Cell. 1993;72:131‐142.
140. Lewis SM. The mechanism of V(D)J joining: lessons from molecular, immunological,
and comparative analyses. Adv.Immunol. 1994;56:27‐150.:27‐150.
141. Goodnow CC, Crosbie J, Adelstein S et al. Altered immunoglobulin expression and
functional silencing of self‐reactive B lymphocytes in transgenic mice. Nature.
1988;334:676‐682.
142. Prak EL, Trounstine M, Huszar D, Weigert M. Light chain editing in kappa‐deficient
animals: a potential mechanism of B cell tolerance. J.Exp.Med. 1994;180:1805‐1815.
143. Chen C, Nagy Z, Prak EL, Weigert M. Immunoglobulin heavy chain gene replacement: a
mechanism of receptor editing. Immunity. 1995;3:747‐755.
144. Reth M, Gehrmann P, Petrac E, Wiese P. A novel VH to VHDJH joining mechanism in
heavy‐chain‐negative (null) pre‐B cells results in heavy‐chain production. Nature.
1986;322:840‐842.
145. Steenbergen EJ, Verhagen OJ, van den BH et al. Rearrangement status of the malignant
cell determines type of secondary IgH rearrangement (V‐replacement or V to DJ
joining) in childhood B precursor acute lymphoblastic leukemia. Leukemia.
1997;11:1258‐1265.
146. Gilfillan S, Dierich A, Lemeur M, Benoist C, Mathis D. Mice lacking TdT: mature animals
with an immature lymphocyte repertoire. Science. 1993;261:1175‐1178.
147. Tumas‐Brundage K, Manser T. The transcriptional promoter regulates hypermutation
of the antibody heavy chain locus. J.Exp.Med. 1997;%20;185:239‐250.
N. Puig. EMR en MM
‐ 74 ‐
148. Fukita Y, Jacobs H, Rajewsky K. Somatic hypermutation in the heavy chain locus
correlates with transcription. Immunity. 1998;9:105‐114.
149. Betz AG, Milstein C, Gonzalez‐Fernandez A et al. Elements regulating somatic
hypermutation of an immunoglobulin kappa gene: critical role for the intron
enhancer/matrix attachment region. Cell. 1994;77:239‐248.
150. Lebecque SG, Gearhart PJ. Boundaries of somatic mutation in rearranged
immunoglobulin genes: 5' boundary is near the promoter, and 3' boundary is
approximately 1 kb from V(D)J gene. J.Exp.Med. 1990;172:1717‐1727.
151. Muller‐Hermelink HK, Greiner A. Molecular analysis of human immunoglobulin heavy
chain variable genes (IgVH) in normal and malignant B cells. Am.J.Pathol.
1998;153:1341‐1346.
152. Goossens T, Klein U, Kuppers R. Frequent occurrence of deletions and duplications
during somatic hypermutation: implications for oncogene translocations and heavy
chain disease. Proc.Natl.Acad.Sci.U.S.A. 1998;95:2463‐2468.
153. Milstein C, Neuberger MS, Staden R. Both DNA strands of antibody genes are
hypermutation targets. Proc.Natl.Acad.Sci.U.S.A. 1998;95:8791‐8794.
154. Neuberger MS, Milstein C. Somatic hypermutation. Curr.Opin.Immunol. 1995;7:248‐
254.
155. Stavnezer J. Immunoglobulin class switching. Curr.Opin.Immunol. 1996;8:199‐205.
156. Stavnezer J. Antibody class switching. Adv.Immunol. 1996;61:79‐146.:79‐146.
157. Iwasato T, Shimizu A, Honjo T, Yamagishi H. Circular DNA is excised by immunoglobulin
class switch recombination. Cell. 1990;62:143‐149.
158. Esser C, Radbruch A. Immunoglobulin class switching: molecular and cellular analysis.
Annu.Rev.Immunol. 1990;8:717‐35.:717‐735.
159. Blade J, Rosinol L, Sureda A et al. High‐dose therapy intensification compared with
continued standard chemotherapy in multiple myeloma patients responding to the
Referencias
‐ 75 ‐
initial chemotherapy: long‐term results from a prospective randomized trial from the
Spanish cooperative group PETHEMA. Blood. 2005;106:3755‐3759.
160. Cavo M, Tosi P, Zamagni E et al. Prospective, randomized study of single compared
with double autologous stem‐cell transplantation for multiple myeloma: Bologna 96
clinical study. J.Clin.Oncol. 2007;25:2434‐2441.
161. Ocio EM, Mateos MV, Maiso P, Pandiella A, San‐Miguel JF. New drugs in multiple
myeloma: mechanisms of action and phase I/II clinical findings. Lancet Oncol.
2008;9:1157‐1165.
162. Rajkumar SV, Harousseau JL, Durie B et al. Consensus recommendations for the
uniform reporting of clinical trials: report of the International Myeloma Workshop
Consensus Panel 1. Blood. 2011;117:4691‐4695.
163. Van Dongen JJ, Macintyre EA, Gabert JA et al. Standardized RT‐PCR analysis of fusion
gene transcripts from chromosome aberrations in acute leukemia for detection of
minimal residual disease. Report of the BIOMED‐1 Concerted Action: investigation of
minimal residual disease in acute leukemia. Leukemia. 1999;13:1901‐1928.
164. Drunat S, Olivi M, Brunie G et al. Quantification of TEL‐AML1 transcript for minimal
residual disease assessment in childhood acute lymphoblastic leukaemia.
Br.J.Haematol. 2001;114:281‐289.
165. Cassinat B, Zassadowski F, Balitrand N et al. Quantitation of minimal residual disease in
acute promyelocytic leukemia patients with t(15;17) translocation using real‐time RT‐
PCR. Leukemia. 2000;14:324‐328.
166. Donovan JW, Ladetto M, Zou G et al. Immunoglobulin heavy‐chain consensus probes
for real‐time PCR quantification of residual disease in acute lymphoblastic leukemia.
Blood. 2000;95:2651‐2658.

N. Puig. EMR en MM
‐ 76 ‐
167. Voso MT, Hohaus S, Moos M, Haas R. Lack of t(14;18) polymerase chain reaction‐
positive cells in highly purified CD34+ cells and their CD19 subsets in patients with
follicular lymphoma. Blood. 1997;89:3763‐3768.
168. Martinelli G, Terragna C, Lemoli RM et al. Clinical and molecular follow‐up by
amplification of the CDR‐III IgH region in multiple myeloma patients after autologous
transplantation of hematopoietic CD34+ stem cells. Haematologica. 1999;84:397‐404.
169. Owen RG, Goulden NJ, Oakhill A et al. Comparison of fluorescent consensus IgH PCR
and allele‐specific oligonucleotide probing in the detection of minimal residual disease
in childhood ALL. Br.J.Haematol. 1997;97:457‐459.
170. Vescio RA, Han EJ, Schiller GJ et al. Quantitative comparison of multiple myeloma
tumor contamination in bone marrow harvest and leukapheresis autografts. Bone
Marrow Transplant. 1996;18:103‐110.
171. Schiller G, Vescio R, Freytes C et al. Transplantation of CD34+ peripheral blood
progenitor cells after high‐dose chemotherapy for patients with advanced multiple
myeloma. Blood. 1995;86:390‐397.
172. Sykes PJ, Neoh SH, Brisco MJ et al. Quantitation of targets for PCR by use of limiting
dilution. Biotechniques. 1992;13:444‐449.
173. Gerard CJ, Olsson K, Ramanathan R, Reading C, Hanania EG. Improved quantitation of
minimal residual disease in multiple myeloma using real‐time polymerase chain
reaction and plasmid‐DNA complementarity determining region III standards. Cancer
Res. 1998;58:3957‐3964.
174. Livak KJ, Flood SJ, Marmaro J, Giusti W, Deetz K. Oligonucleotides with fluorescent
dyes at opposite ends provide a quenched probe system useful for detecting PCR
product and nucleic acid hybridization. PCR Methods Appl. 1995;4:357‐362.
175. Wittwer CT, Ririe KM, Andrew RV et al. The LightCycler: a microvolume multisample
fluorimeter with rapid temperature control. Biotechniques. 1997;22:176‐181.

Referencias
‐ 77 ‐
176. Livak KJ, Flood SJ, Marmaro J, Giusti W, Deetz K. Oligonucleotides with fluorescent
dyes at opposite ends provide a quenched probe system useful for detecting PCR
product and nucleic acid hybridization. PCR Methods Appl. 1995;4:357‐362.
177. Pongers‐Willemse MJ, Verhagen OJ, Tibbe GJ et al. Real‐time quantitative PCR for the
detection of minimal residual disease in acute lymphoblastic leukemia using junctional
region specific TaqMan probes. Leukemia. 1998;12:2006‐2014.
178. Rasmussen T, Poulsen TS, Honore L, Johnsen HE. Quantitation of minimal residual
disease in multiple myeloma using an allele‐specific real‐time PCR assay. Exp.Hematol.
2000;28:1039‐1045.
179. Wattjes MP, Krauter J, Nagel S et al. Comparison of nested competitive RT‐PCR and
real‐time RT‐PCR for the detection and quantification of AML1/MTG8 fusion
transcripts in t(8;21) positive acute myelogenous leukemia. Leukemia. 2000;14:329‐
335.
180. Bruggemann M, Droese J, Bolz I et al. Improved assessment of minimal residual
disease in B cell malignancies using fluorogenic consensus probes for real‐time
quantitative PCR. Leukemia. 2000;14:1419‐1425.
181. Pfitzner T, Engert A, Wittor H et al. A real‐time PCR assay for the quantification of
residual malignant cells in B cell chronic lymphatic leukemia. Leukemia. 2000;14:754‐
766.
182. Verhagen OJ, Willemse MJ, Breunis WB et al. Application of germline IGH probes in
real‐time quantitative PCR for the detection of minimal residual disease in acute
lymphoblastic leukemia. Leukemia. 2000;14:1426‐1435.
183. Corradini P, Voena C, Astolfi M et al. High‐dose sequential chemoradiotherapy in
multiple myeloma: residual tumor cells are detectable in bone marrow and peripheral
blood cell harvests and after autografting. Blood. 1995;85:1596‐1602.
N. Puig. EMR en MM
‐ 78 ‐
184. Bjorkstrand B, Ljungman P, Bird JM, Samson D, Gahrton G. Double high‐dose
chemoradiotherapy with autologous stem cell transplantation can induce molecular
remissions in multiple myeloma. Bone Marrow Transplant. 1995;15:367‐371.
185. Swedin A, Lenhoff S, Olofsson T, Thuresson B, Westin J. Clinical utility of
immunoglobulin heavy chain gene rearrangement identification for tumour cell
detection in multiple myeloma. Br.J.Haematol. 1998;103:1145‐1151.
186. Corradini P, Voena C, Tarella C et al. Molecular and clinical remissions in multiple
myeloma: role of autologous and allogeneic transplantation of hematopoietic cells.
J.Clin.Oncol. 1999;17:208‐215.
187. Martinelli G, Terragna C, Zamagni E et al. Polymerase chain reaction‐based detection
of minimal residual disease in multiple myeloma patients receiving allogeneic stem cell
transplantation. Haematologica. 2000;85:930‐934.
188. Martinelli G, Terragna C, Zamagni E et al. Molecular remission after allogeneic or
autologous transplantation of hematopoietic stem cells for multiple myeloma.
J.Clin.Oncol. 2000;18:2273‐2281.
189. Cavo M, Terragna C, Martinelli G et al. Molecular monitoring of minimal residual
disease in patients in long‐term complete remission after allogeneic stem cell
transplantation for multiple myeloma. Blood. 2000;96:355‐357.
190. Corradini P, Voena C, Tarella C et al. Molecular and clinical remissions in multiple
myeloma: role of autologous and allogeneic transplantation of hematopoietic cells.
J.Clin.Oncol. 1999;17:208‐215.
191. Ladetto M, Donovan JW, Harig S et al. Real‐Time polymerase chain reaction of
immunoglobulin rearrangements for quantitative evaluation of minimal residual
disease in multiple myeloma. Biol.Blood Marrow Transplant. 2000;6:241‐253.
Referencias
‐ 79 ‐
192. Rasmussen T, Poulsen TS, Honore L, Johnsen HE. Quantitation of minimal residual
disease in multiple myeloma using an allele‐specific real‐time PCR assay. Exp.Hematol.
2000;28:1039‐1045.
193. Bakkus MH, Bouko Y, Samson D et al. Post‐transplantation tumour load in bone
marrow, as assessed by quantitative ASO‐PCR, is a prognostic parameter in multiple
myeloma. Br.J.Haematol. 2004;126:665‐674.
194. Fenk R, Ak M, Kobbe G et al. Levels of minimal residual disease detected by
quantitative molecular monitoring herald relapse in patients with multiple myeloma.
Haematologica. 2004;89:557‐566.
195. Novella E, Giaretta I, Elice F et al. Fluorescent polymerase chain reaction and capillary
electrophoresis for IgH rearrangement and minimal residual disease evaluation in
multiple myeloma. Haematologica. 2002;87:1157‐1164.
196. Korthals M, Sehnke N, Kronenwett R et al. The level of minimal residual disease in the
bone marrow of patients with multiple myeloma before high‐dose therapy and
autologous blood stem cell transplantation is an independent predictive parameter.
Biol.Blood Marrow Transplant. 2012;18:423‐431.
197. Ladetto M, Pagliano G, Ferrero S et al. Major tumor shrinking and persistent molecular
remissions after consolidation with bortezomib, thalidomide, and dexamethasone in
patients with autografted myeloma. J.Clin.Oncol. 2010;%20;28:2077‐2084.
198. Hadzidimitriou A, Stamatopoulos K, Belessi C et al. Immunoglobulin genes in multiple
myeloma: expressed and non‐expressed repertoires, heavy and light chain pairings and
somatic mutation patterns in a series of 101 cases. Haematologica. 2006;91:781‐787.
199. Gonzalez D, Balanzategui A, Garcia‐Sanz R et al. Incomplete DJH rearrangements of the
IgH gene are frequent in multiple myeloma patients: immunobiological characteristics
and clinical implications. Leukemia. 2003;17:1398‐1403.
N. Puig. EMR en MM
‐ 80 ‐
200. Sarasquete ME, Garcia‐Sanz R, Gonzalez D et al. Minimal residual disease monitoring in
multiple myeloma: a comparison between allelic‐specific oligonucleotide real‐time
quantitative polymerase chain reaction and flow cytometry. Haematologica.
2005;90:1365‐1372.
201. Lioznov M, Badbaran A, Fehse B et al. Monitoring of minimal residual disease in
multiple myeloma after allo‐SCT: flow cytometry vs PCR‐based techniques. Bone
Marrow Transplant. 2008;41:913‐916.