statistik pasar modal - otoritas jasa keuangan...statistik pasar modal 2 minggu ke iv maret 2004...
TRANSCRIPT

Statistik Pasar Modal

Statistik Pasar Modal
Statistik Pasar Modal
1
Daftar Isi
Riset - Biro PIR Bapepam
Halaman
Daftar Isi ...................................................................................................................... 1Analisis Mingguan Perkembangan Pasar Modal ....................................................... 2
EmisiNilai Emisi Saham dan Obligasi ................................................................................. 3Tabel 1. Emisi Saham ............................................................................................... 4Initial Public Offering (IPO) & Right Issue (HMETD) ............................................. 5Tabel 2. Emisi Obligasi ............................................................................................. 6Initial Public Offering (IPO) Obligasi & Obligasi Pemerintah RI ............................ 7Indikator BursaTabel 3. Perdagangan Saham di Bursa Efek Jakarta (BEJ) .................................... 8Tabel 4. Perdagangan Saham di Bursa Efek Surabaya (BES) ................................ 9Tabel 5. Perdagangan LQ45 Futures ........................................................................ 10Tabel 6. Perdagangan Obligasi SUN (Surat Utang Negara) .................................. 11Tabel 7. Perdagangan Obligasi Korporasi .............................................................. 12Tabel 8. Indeks Harga Saham Gabungan (IHSG) BEJ dan BES ........................... 13Tabel 9. Indeks Saham Bursa Asean ........................................................................ 15Tabel 10. Indeks Saham Bursa Dunia ........................................................................ 16Tabel 11. Jumlah Saham Tercatat dan Nilai Kapitalisasi BEJ dan BES .................. 17Tabel 12. Nilai Kapitalisasi Saham Milik Pemodal Asing di BEJ ........................... 18Perdagangan Saham yang dilakukan oleh Pemodal Indonesia dan Asing di BEJTabel 13. Volume Perdagangan .................................................................................. 19Tabel 14. Persentase Volume Perdagangan terhadap Total Perdagangan ................ 20Tabel 15. Nilai Perdagangan ....................................................................................... 21Tabel 16. Persentase Nilai Perdagangan terhadap Total Perdagangan ..................... 22Kinerja BUMNTabel 17. Nilai Kapitalisasi dan Persentase terhadap Nilai Kapitalisasi BEJ .......... 23Tabel 18. Perkembangan Harga Saham ...................................................................... 24Tabel 19. Volume Perdagangan .................................................................................. 25Tabel 20. Nilai Perdagangan ....................................................................................... 26Tabel 21. Frekuensi Perdagangan ............................................................................... 27Tabel 22. Kinerja BUMN (Laporan Keuangan) ....................................................... 28ReksadanaTabel 23. Kinerja Reksadana ...................................................................................... 29Pemodal Saham ........................................................................................................... 30Lembaga Penunjang dan Profesi Pasar Modal .......................................................... 31

Statistik Pasar Modal
Statistik Pasar Modal
2
Minggu Ke IV Maret 2004 Analisis Perkembangan Pasar Modal
Riset - Biro PIR Bapepam
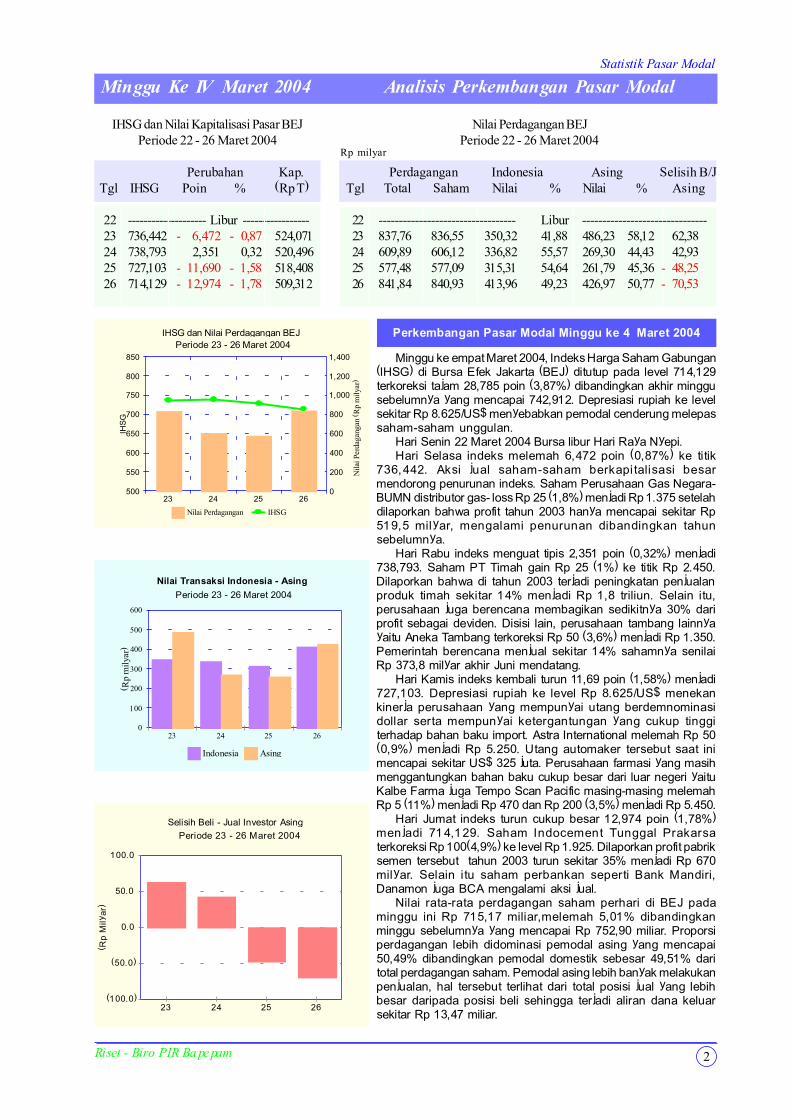
IHSG dan Nilai Kapitalisasi Pasar BEJPeriode 22 - 26 Maret 2004
Perubahan Kap. Tgl IHSG Poin % (Rp T)
22 -------------------- Libur ----------------- 23 736,442 - 6,472 - 0,87 524,071 24 738,793 2,351 0,32 520,496 25 727,103 - 11,690 - 1,58 518,408 26 714,129 - 12,974 - 1,78 509,312
Perkembangan Pasar Modal Minggu ke 4 Maret 2004
Minggu ke empat Maret 2004, Indeks Harga Saham Gabungan(IHSG) di Bursa Efek Jakarta (BEJ) ditutup pada level 714,129terkoreksi tajam 28,785 poin (3,87%) dibandingkan akhir minggusebelumnya yang mencapai 742,912. Depresiasi rupiah ke levelsekitar Rp 8.625/US$ menyebabkan pemodal cenderung melepassaham-saham unggulan.
Hari Senin 22 Maret 2004 Bursa libur Hari Raya Nyepi.Hari Selasa indeks melemah 6,472 poin (0,87%) ke titik
736,442. Aksi jual saham-saham berkapitalisasi besarmendorong penurunan indeks. Saham Perusahaan Gas Negara-BUMN distributor gas- loss Rp 25 (1,8%) menjadi Rp 1.375 setelahdilaporkan bahwa profit tahun 2003 hanya mencapai sekitar Rp519,5 milyar, mengalami penurunan dibandingkan tahunsebelumnya.
Hari Rabu indeks menguat tipis 2,351 poin (0,32%) menjadi738,793. Saham PT Timah gain Rp 25 (1%) ke titik Rp 2.450.Dilaporkan bahwa di tahun 2003 terjadi peningkatan penjualanproduk timah sekitar 14% menjadi Rp 1,8 triliun. Selain itu,perusahaan juga berencana membagikan sedikitnya 30% dariprofit sebagai deviden. Disisi lain, perusahaan tambang lainnyayaitu Aneka Tambang terkoreksi Rp 50 (3,6%) menjadi Rp 1.350.Pemerintah berencana menjual sekitar 14% sahamnya senilaiRp 373,8 milyar akhir Juni mendatang.
Hari Kamis indeks kembali turun 11,69 poin (1,58%) menjadi727,103. Depresiasi rupiah ke level Rp 8.625/US$ menekankinerja perusahaan yang mempunyai utang berdemnominasidollar serta mempunyai ketergantungan yang cukup tinggiterhadap bahan baku import. Astra International melemah Rp 50(0,9%) menjadi Rp 5.250. Utang automaker tersebut saat inimencapai sekitar US$ 325 juta. Perusahaan farmasi yang masihmenggantungkan bahan baku cukup besar dari luar negeri yaituKalbe Farma juga Tempo Scan Pacific masing-masing melemahRp 5 (11%) menjadi Rp 470 dan Rp 200 (3,5%) menjadi Rp 5.450.
Hari Jumat indeks turun cukup besar 12,974 poin (1,78%)menjadi 714,129. Saham Indocement Tunggal Prakarsaterkoreksi Rp 100(4,9%) ke level Rp 1.925. Dilaporkan profit pabriksemen tersebut tahun 2003 turun sekitar 35% menjadi Rp 670milyar. Selain itu saham perbankan seperti Bank Mandiri,Danamon juga BCA mengalami aksi jual.
Nilai rata-rata perdagangan saham perhari di BEJ padaminggu ini Rp 715,17 miliar,melemah 5,01% dibandingkanminggu sebelumnya yang mencapai Rp 752,90 miliar. Proporsiperdagangan lebih didominasi pemodal asing yang mencapai50,49% dibandingkan pemodal domestik sebesar 49,51% daritotal perdagangan saham. Pemodal asing lebih banyak melakukanpenjualan, hal tersebut terlihat dari total posisi jual yang lebihbesar daripada posisi beli sehingga terjadi aliran dana keluarsekitar Rp 13,47 miliar.
500
550
600
650
700
750
800
850
IHS
G
0
200
400
600
800
1,000
1,200
1,400 N
ilai P
erda
gang
an (
Rp
mily
ar)
23 24 25 26
Nilai Perdagangan IHSG
IHSG dan Nilai Perdagangan BEJPeriode 23 - 26 Maret 2004
0
100
200
300
400
500
600
(Rp
mily
ar)
23 24 25 26
Indonesia Asing
Nilai Transaksi Indonesia - Asing
Periode 23 - 26 Maret 2004
Rp milyar
Nilai Perdagangan BEJPeriode 22 - 26 Maret 2004
Perdagangan Indonesia Asing Selisih B/J Tgl Total Saham Nilai % Nilai % Asing
22 ---------------------------------- Libur -------------------------------23 837,76 836,55 350,32 41,88 486,23 58,12 62,3824 609,89 606,12 336,82 55,57 269,30 44,43 42,9325 577,48 577,09 315,31 54,64 261,79 45,36 - 48,2526 841,84 840,93 413,96 49,23 426,97 50,77 - 70,53
(100.0)
(50.0)
0.0
50.0
100.0
(Rp
Mily
ar)
23 24 25 26
Selisih Beli - Jual Investor Asing
Periode 23 - 26 Maret 2004
Statistik Pasar Modal
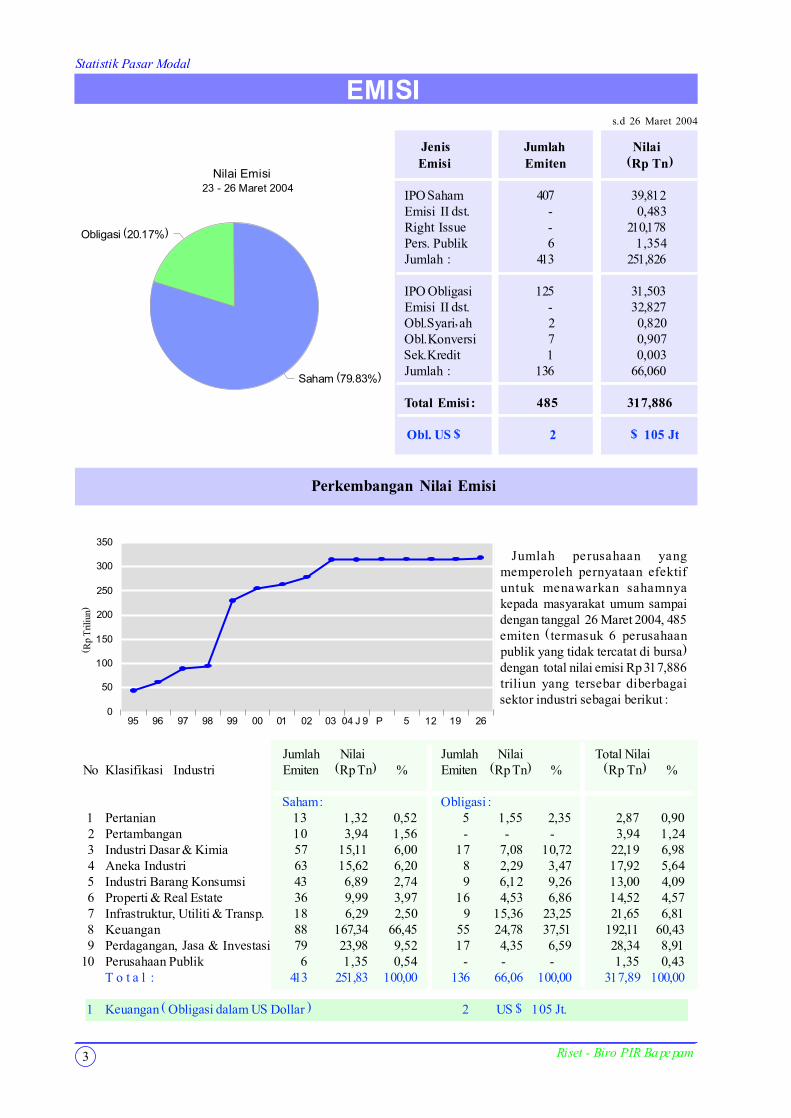
Jumlah Nilai Jumlah Nilai Total NilaiNo Klasifikasi Industri Emiten (Rp Tn) % Emiten (Rp Tn) % (Rp Tn) %
Saham : Obligasi : 1 Pertanian 13 1,32 0,52 5 1,55 2,35 2,87 0,90 2 Pertambangan 10 3,94 1,56 - - - 3,94 1,24 3 Industri Dasar & Kimia 57 15,11 6,00 17 7,08 10,72 22,19 6,98 4 Aneka Industri 63 15,62 6,20 8 2,29 3,47 17,92 5,64 5 Industri Barang Konsumsi 43 6,89 2,74 9 6,12 9,26 13,00 4,09 6 Properti & Real Estate 36 9,99 3,97 16 4,53 6,86 14,52 4,57 7 Infrastruktur, Utiliti & Transp. 18 6,29 2,50 9 15,36 23,25 21,65 6,81 8 Keuangan 88 167,34 66,45 55 24,78 37,51 192,11 60,43 9 Perdagangan, Jasa & Investasi 79 23,98 9,52 17 4,35 6,59 28,34 8,9110 Perusahaan Publik 6 1,35 0,54 - - - 1,35 0,43
T o t a l : 413 251,83 100,00 136 66,06 100,00 317,89 100,00
1 Keuangan ( Obligasi dalam US Dollar ) 2 US $ 105 Jt.
EMISI
Saham (79.83%)
Obligasi (20.17%)
Nilai Emisi
Jumlah perusahaan yangmemperoleh pernyataan efektifuntuk menawarkan sahamnyakepada masyarakat umum sampaidengan tanggal 26 Maret 2004, 485emiten (termasuk 6 perusahaanpublik yang tidak tercatat di bursa)dengan total nilai emisi Rp 317,886triliun yang tersebar diberbagaisektor industri sebagai berikut :
Perkembangan Nilai Emisi
s.d 26 Maret 2004
23 - 26 Maret 2004
Jenis Jumlah Nilai Emisi Emiten (Rp Tn)
IPO Saham 407 39,812Emisi II dst. - 0,483Right Issue - 210,178Pers. Publik 6 1,354Jumlah : 413 251,826
IPO Obligasi 125 31,503Emisi II dst. - 32,827Obl.Syari�ah 2 0,820Obl.Konversi 7 0,907Sek.Kredit 1 0,003Jumlah : 136 66,060
Total Emisi : 485 317,886
Obl. US $ 2 $ 105 Jt
Riset - Biro PIR Bapepam3
0
50
100
150
200
250
300
350
(Rp
Tri
liun)
95 96 97 98 99 00 01 02 03 04 J 9 P 5 12 19 26
Statistik Pasar Modal
EMISI
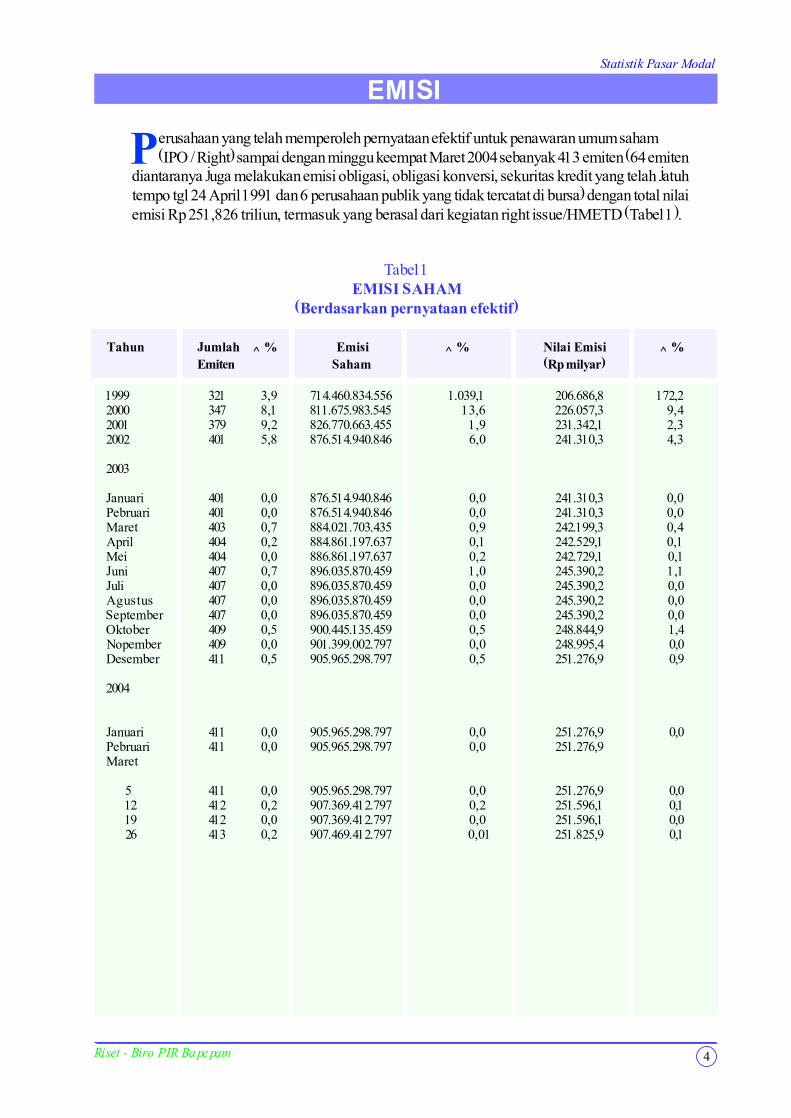
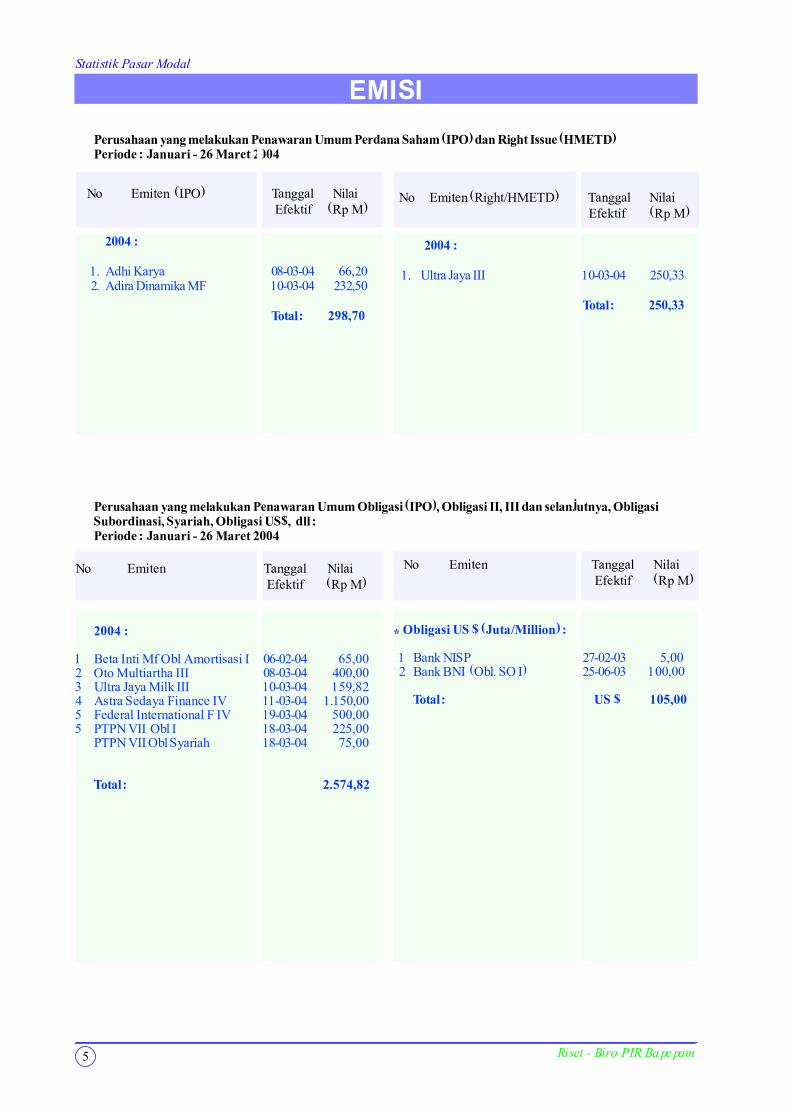
Perusahaan yang telah memperoleh pernyataan efektif untuk penawaran umum saham(IPO / Right) sampai dengan minggu keempat Maret 2004 sebanyak 413 emiten (64 emiten
diantaranya juga melakukan emisi obligasi, obligasi konversi, sekuritas kredit yang telah jatuhtempo tgl 24 April 1991 dan 6 perusahaan publik yang tidak tercatat di bursa) dengan total nilaiemisi Rp 251,826 triliun, termasuk yang berasal dari kegiatan right issue/HMETD (Tabel 1).
Tabel 1EMISI SAHAM
(Berdasarkan pernyataan efektif)
Tahun Jumlah ^ % Emisi ^ % Nilai Emisi ^ %Emiten Saham (Rp milyar)
1999 321 3,9 714.460.834.556 1.039,1 206.686,8 172,22000 347 8,1 811.675.983.545 13,6 226.057,3 9,42001 379 9,2 826.770.663.455 1,9 231.342,1 2,32002 401 5,8 876.514.940.846 6,0 241.310,3 4,3
2003
Januari 401 0,0 876.514.940.846 0,0 241.310,3 0,0Pebruari 401 0,0 876.514.940.846 0,0 241.310,3 0,0Maret 403 0,7 884.021.703.435 0,9 242.199,3 0,4April 404 0,2 884.861.197.637 0,1 242.529,1 0,1Mei 404 0,0 886.861.197.637 0,2 242.729,1 0,1Juni 407 0,7 896.035.870.459 1,0 245.390,2 1,1Juli 407 0,0 896.035.870.459 0,0 245.390,2 0,0Agustus 407 0,0 896.035.870.459 0,0 245.390,2 0,0September 407 0,0 896.035.870.459 0,0 245.390,2 0,0Oktober 409 0,5 900.445.135.459 0,5 248.844,9 1,4Nopember 409 0,0 901.399.002.797 0,0 248.995,4 0,0Desember 411 0,5 905.965.298.797 0,5 251.276,9 0,9
2004
Januari 411 0,0 905.965.298.797 0,0 251.276,9 0,0Pebruari 411 0,0 905.965.298.797 0,0 251.276,9Maret
5 411 0,0 905.965.298.797 0,0 251.276,9 0,012 412 0,2 907.369.412.797 0,2 251.596,1 0,119 412 0,0 907.369.412.797 0,0 251.596,1 0,026 413 0,2 907.469.412.797 0,01 251.825,9 0,1
Riset - Biro PIR Bapepam 4
Statistik Pasar Modal
5 Riset - Biro PIR Bapepam
EMISI
No Emiten (IPO) Tanggal Nilai Efektif (Rp M)
2004 :
1. Adhi Karya 08-03-04 66,20 2. Adira Dinamika MF 10-03-04 232,50
Total : 298,70
Perusahaan yang melakukan Penawaran Umum Perdana Saham (IPO) dan Right Issue (HMETD)Periode : Januari - 26 Maret 2004
No Emiten (Right/HMETD) Tanggal Nilai Efektif (Rp M)
2004 :
1. Ultra Jaya III 10-03-04 250,33
Total : 250,33
No Emiten Tanggal Nilai Efektif (Rp M)
2004 :
1 Beta Inti Mf Obl Amortisasi I 06-02-04 65,002 Oto Multiartha III 08-03-04 400,003 Ultra Jaya Milk III 10-03-04 159,824 Astra Sedaya Finance IV 11-03-04 1.150,005 Federal International F IV 19-03-04 500,005 PTPN VII Obl I 18-03-04 225,00
PTPN VII Obl Syariah 18-03-04 75,00
Total : 2.574,82
No Emiten Tanggal Nilai Efektif (Rp M)
Perusahaan yang melakukan Penawaran Umum Obligasi (IPO), Obligasi II, III dan selanjutnya, ObligasiSubordinasi, Syariah, Obligasi US$, dll :Periode : Januari - 26 Maret 2004
* Obligasi US $ (Juta/Million) :
1 Bank NISP 27-02-03 5,00 2 Bank BNI (Obl. SO I) 25-06-03 100,00
Total : US $ 105,00
Statistik Pasar Modal
6Riset - Biro PIR Bapepam
EMISI
P
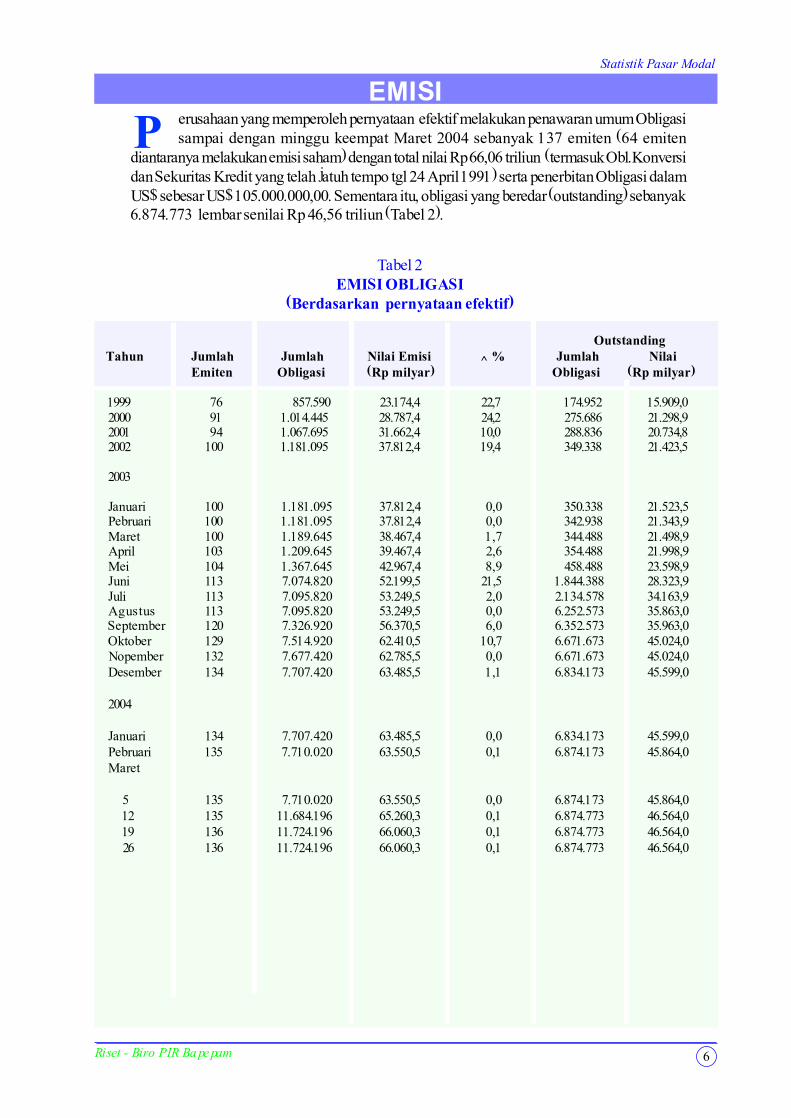
Tabel 2EMISI OBLIGASI
(Berdasarkan pernyataan efektif)
Outstanding Tahun Jumlah Jumlah Nilai Emisi ^ % Jumlah Nilai
Emiten Obligasi (Rp milyar) Obligasi (Rp milyar)
1999 76 857.590 23.174,4 22,7 174.952 15.909,02000 91 1.014.445 28.787,4 24,2 275.686 21.298,92001 94 1.067.695 31.662,4 10,0 288.836 20.734,82002 100 1.181.095 37.812,4 19,4 349.338 21.423,5
2003
Januari 100 1.181.095 37.812,4 0,0 350.338 21.523,5Pebruari 100 1.181.095 37.812,4 0,0 342.938 21.343,9Maret 100 1.189.645 38.467,4 1,7 344.488 21.498,9April 103 1.209.645 39.467,4 2,6 354.488 21.998,9Mei 104 1.367.645 42.967,4 8,9 458.488 23.598,9Juni 113 7.074.820 52.199,5 21,5 1.844.388 28.323,9Juli 113 7.095.820 53.249,5 2,0 2.134.578 34.163,9Agustus 113 7.095.820 53.249,5 0,0 6.252.573 35.863,0September 120 7.326.920 56.370,5 6,0 6.352.573 35.963,0Oktober 129 7.514.920 62.410,5 10,7 6.671.673 45.024,0Nopember 132 7.677.420 62.785,5 0,0 6.671.673 45.024,0Desember 134 7.707.420 63.485,5 1,1 6.834.173 45.599,0
2004
Januari 134 7.707.420 63.485,5 0,0 6.834.173 45.599,0Pebruari 135 7.710.020 63.550,5 0,1 6.874.173 45.864,0Maret
5 135 7.710.020 63.550,5 0,0 6.874.173 45.864,012 135 11.684.196 65.260,3 0,1 6.874.773 46.564,019 136 11.724.196 66.060,3 0,1 6.874.773 46.564,026 136 11.724.196 66.060,3 0,1 6.874.773 46.564,0
erusahaan yang memperoleh pernyataan efektif melakukan penawaran umum Obligasisampai dengan minggu keempat Maret 2004 sebanyak 137 emiten (64 emiten
diantaranya melakukan emisi saham) dengan total nilai Rp 66,06 triliun (termasuk Obl.Konversidan Sekuritas Kredit yang telah jatuh tempo tgl 24 April 1991) serta penerbitan Obligasi dalamUS$ sebesar US$ 105.000.000,00. Sementara itu, obligasi yang beredar (outstanding) sebanyak6.874.773 lembar senilai Rp 46,56 triliun (Tabel 2).
Statistik Pasar Modal
7 Riset - Biro PIR Bapepam
EMISI
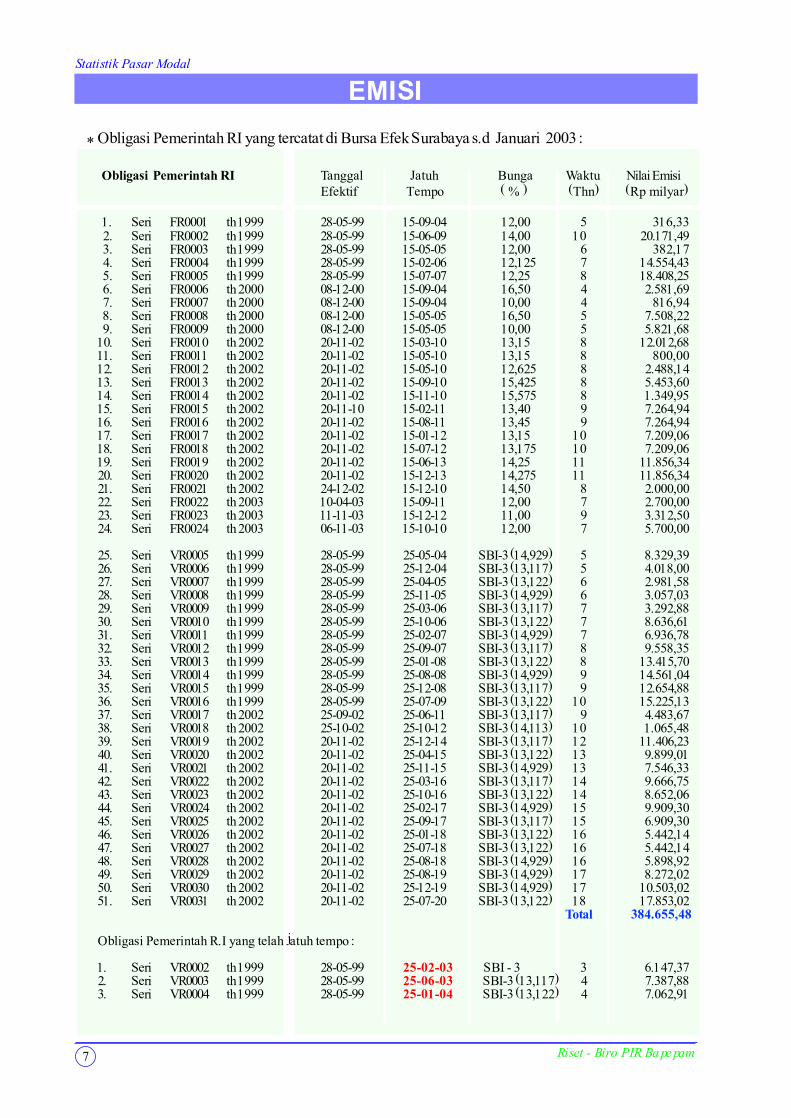
* Obligasi Pemerintah RI yang tercatat di Bursa Efek Surabaya s.d Januari 2003 :
Obligasi Pemerintah RI Tanggal Jatuh Bunga Waktu Nilai EmisiEfektif Tempo ( % ) (Thn) (Rp milyar)
1. Seri FR0001 th 1999 28-05-99 15-09-04 12,00 5 316,33 2. Seri FR0002 th 1999 28-05-99 15-06-09 14,00 10 20.171,49 3. Seri FR0003 th 1999 28-05-99 15-05-05 12,00 6 382,17 4. Seri FR0004 th 1999 28-05-99 15-02-06 12,125 7 14.554,43 5. Seri FR0005 th 1999 28-05-99 15-07-07 12,25 8 18.408,25 6. Seri FR0006 th 2000 08-12-00 15-09-04 16,50 4 2.581,69 7. Seri FR0007 th 2000 08-12-00 15-09-04 10,00 4 816,94 8. Seri FR0008 th 2000 08-12-00 15-05-05 16,50 5 7.508,22 9. Seri FR0009 th 2000 08-12-00 15-05-05 10,00 5 5.821,6810. Seri FR0010 th 2002 20-11-02 15-03-10 13,15 8 12.012,6811. Seri FR0011 th 2002 20-11-02 15-05-10 13,15 8 800,0012. Seri FR0012 th 2002 20-11-02 15-05-10 12,625 8 2.488,1413. Seri FR0013 th 2002 20-11-02 15-09-10 15,425 8 5.453,6014. Seri FR0014 th 2002 20-11-02 15-11-10 15,575 8 1.349,9515. Seri FR0015 th 2002 20-11-10 15-02-11 13,40 9 7.264,9416. Seri FR0016 th 2002 20-11-02 15-08-11 13,45 9 7.264,9417. Seri FR0017 th 2002 20-11-02 15-01-12 13,15 10 7.209,0618. Seri FR0018 th 2002 20-11-02 15-07-12 13,175 10 7.209,0619. Seri FR0019 th 2002 20-11-02 15-06-13 14,25 11 11.856,3420. Seri FR0020 th 2002 20-11-02 15-12-13 14,275 11 11.856,3421. Seri FR0021 th 2002 24-12-02 15-12-10 14,50 8 2.000,0022. Seri FR0022 th 2003 10-04-03 15-09-11 12,00 7 2.700,0023. Seri FR0023 th 2003 11-11-03 15-12-12 11,00 9 3.312,5024. Seri FR0024 th 2003 06-11-03 15-10-10 12,00 7 5.700,00
25. Seri VR0005 th 1999 28-05-99 25-05-04 SBI-3 (14,929) 5 8.329,3926. Seri VR0006 th 1999 28-05-99 25-12-04 SBI-3 (13,117) 5 4.018,0027. Seri VR0007 th 1999 28-05-99 25-04-05 SBI-3 (13,122) 6 2.981,5828. Seri VR0008 th 1999 28-05-99 25-11-05 SBI-3 (14,929) 6 3.057,0329. Seri VR0009 th 1999 28-05-99 25-03-06 SBI-3 (13,117) 7 3.292,8830. Seri VR0010 th 1999 28-05-99 25-10-06 SBI-3 (13,122) 7 8.636,6131. Seri VR0011 th 1999 28-05-99 25-02-07 SBI-3 (14,929) 7 6.936,7832. Seri VR0012 th 1999 28-05-99 25-09-07 SBI-3 (13,117) 8 9.558,3533. Seri VR0013 th 1999 28-05-99 25-01-08 SBI-3 (13,122) 8 13.415,7034. Seri VR0014 th 1999 28-05-99 25-08-08 SBI-3 (14,929) 9 14.561,0435. Seri VR0015 th 1999 28-05-99 25-12-08 SBI-3 (13,117) 9 12.654,8836. Seri VR0016 th 1999 28-05-99 25-07-09 SBI-3 (13,122) 10 15.225,1337. Seri VR0017 th 2002 25-09-02 25-06-11 SBI-3 (13,117) 9 4.483,6738. Seri VR0018 th 2002 25-10-02 25-10-12 SBI-3 (14,113) 10 1.065,4839. Seri VR0019 th 2002 20-11-02 25-12-14 SBI-3 (13,117) 12 11.406,2340. Seri VR0020 th 2002 20-11-02 25-04-15 SBI-3 (13,122) 13 9.899,0141. Seri VR0021 th 2002 20-11-02 25-11-15 SBI-3 (14,929) 13 7.546,3342. Seri VR0022 th 2002 20-11-02 25-03-16 SBI-3 (13,117) 14 9.666,7543. Seri VR0023 th 2002 20-11-02 25-10-16 SBI-3 (13,122) 14 8.652,0644. Seri VR0024 th 2002 20-11-02 25-02-17 SBI-3 (14,929) 15 9.909,3045. Seri VR0025 th 2002 20-11-02 25-09-17 SBI-3 (13,117) 15 6.909,3046. Seri VR0026 th 2002 20-11-02 25-01-18 SBI-3 (13,122) 16 5.442,1447. Seri VR0027 th 2002 20-11-02 25-07-18 SBI-3 (13,122) 16 5.442,1448. Seri VR0028 th 2002 20-11-02 25-08-18 SBI-3 (14,929) 16 5.898,9249. Seri VR0029 th 2002 20-11-02 25-08-19 SBI-3 (14,929) 17 8.272,0250. Seri VR0030 th 2002 20-11-02 25-12-19 SBI-3 (14,929) 17 10.503,0251. Seri VR0031 th 2002 20-11-02 25-07-20 SBI-3 (13,122) 18 17.853,02
Total 384.655,48
Obligasi Pemerintah R.I yang telah jatuh tempo :
1. Seri VR0002 th 1999 28-05-99 25-02-03 SBI - 3 3 6.147,372. Seri VR0003 th 1999 28-05-99 25-06-03 SBI-3 (13,117) 4 7.387,883. Seri VR0004 th 1999 28-05-99 25-01-04 SBI-3 (13,122) 4 7.062,91
Statistik Pasar Modal
Riset - Biro PIR Bapepam
Indikator Bursa
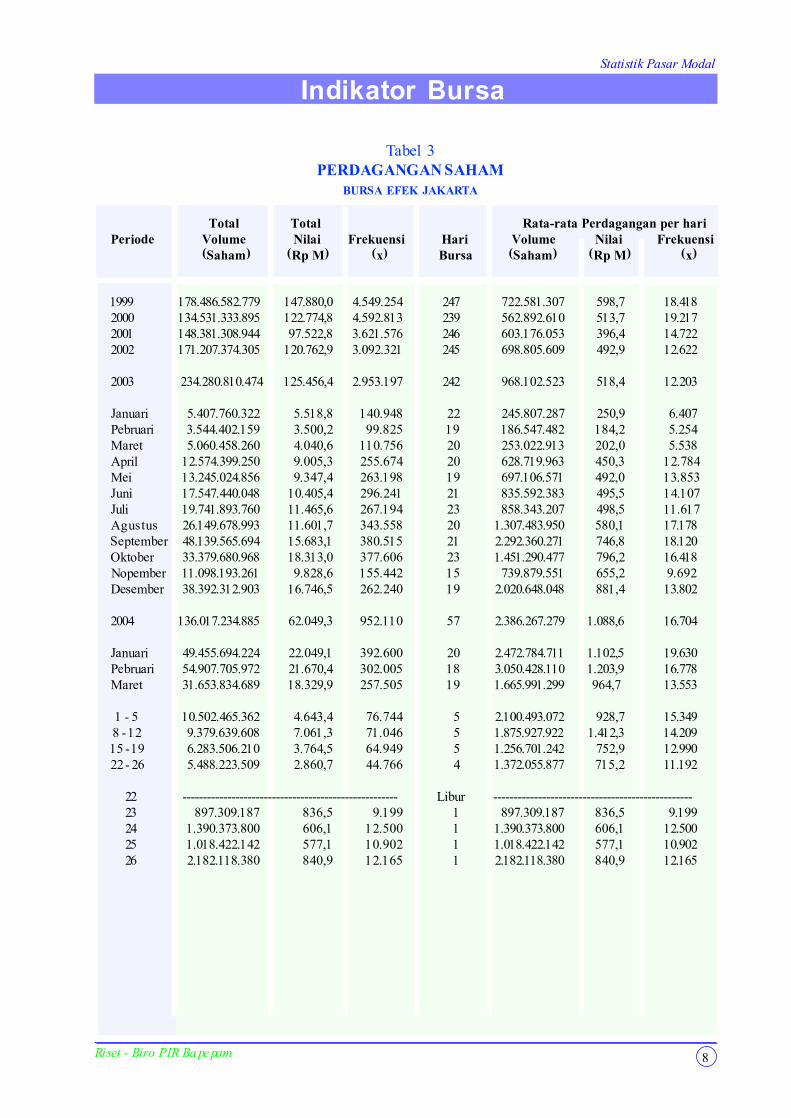
Tabel 3PERDAGANGAN SAHAM
BURSA EFEK JAKARTA
Total Total Rata-rata Perdagangan per hariPeriode Volume Nilai Frekuensi Hari Volume Nilai Frekuensi
(Saham) (Rp M) (x) Bursa (Saham) (Rp M) (x)
1999 178.486.582.779 147.880,0 4.549.254 247 722.581.307 598,7 18.4182000 134.531.333.895 122.774,8 4.592.813 239 562.892.610 513,7 19.2172001 148.381.308.944 97.522,8 3.621.576 246 603.176.053 396,4 14.7222002 171.207.374.305 120.762,9 3.092.321 245 698.805.609 492,9 12.622
2003 234.280.810.474 125.456,4 2.953.197 242 968.102.523 518,4 12.203
Januari 5.407.760.322 5.518,8 140.948 22 245.807.287 250,9 6.407Pebruari 3.544.402.159 3.500,2 99.825 19 186.547.482 184,2 5.254Maret 5.060.458.260 4.040,6 110.756 20 253.022.913 202,0 5.538April 12.574.399.250 9.005,3 255.674 20 628.719.963 450,3 12.784Mei 13.245.024.856 9.347,4 263.198 19 697.106.571 492,0 13.853Juni 17.547.440.048 10.405,4 296.241 21 835.592.383 495,5 14.107Juli 19.741.893.760 11.465,6 267.194 23 858.343.207 498,5 11.617Agustus 26.149.678.993 11.601,7 343.558 20 1.307.483.950 580,1 17.178September 48.139.565.694 15.683,1 380.515 21 2.292.360.271 746,8 18.120Oktober 33.379.680.968 18.313,0 377.606 23 1.451.290.477 796,2 16.418Nopember 11.098.193.261 9.828,6 155.442 15 739.879.551 655,2 9.692Desember 38.392.312.903 16.746,5 262.240 19 2.020.648.048 881,4 13.802
2004 136.017.234.885 62.049,3 952.110 57 2.386.267.279 1.088,6 16.704
Januari 49.455.694.224 22.049,1 392.600 20 2.472.784.711 1.102,5 19.630Pebruari 54.907.705.972 21.670,4 302.005 18 3.050.428.110 1.203,9 16.778Maret 31.653.834.689 18.329,9 257.505 19 1.665.991.299 964,7 13.553
1 - 5 10.502.465.362 4.643,4 76.744 5 2.100.493.072 928,7 15.349 8 - 12 9.379.639.608 7.061,3 71.046 5 1.875.927.922 1.412,3 14.20915 - 19 6.283.506.210 3.764,5 64.949 5 1.256.701.242 752,9 12.99022 - 26 5.488.223.509 2.860,7 44.766 4 1.372.055.877 715,2 11.192
22 ----------------------------------------------------- Libur -------------------------------------------------23 897.309.187 836,5 9.199 1 897.309.187 836,5 9.19924 1.390.373.800 606,1 12.500 1 1.390.373.800 606,1 12.50025 1.018.422.142 577,1 10.902 1 1.018.422.142 577,1 10.90226 2.182.118.380 840,9 12.165 1 2.182.118.380 840,9 12.165
8
Statistik Pasar Modal
9 Riset - Biro PIR Bapepam
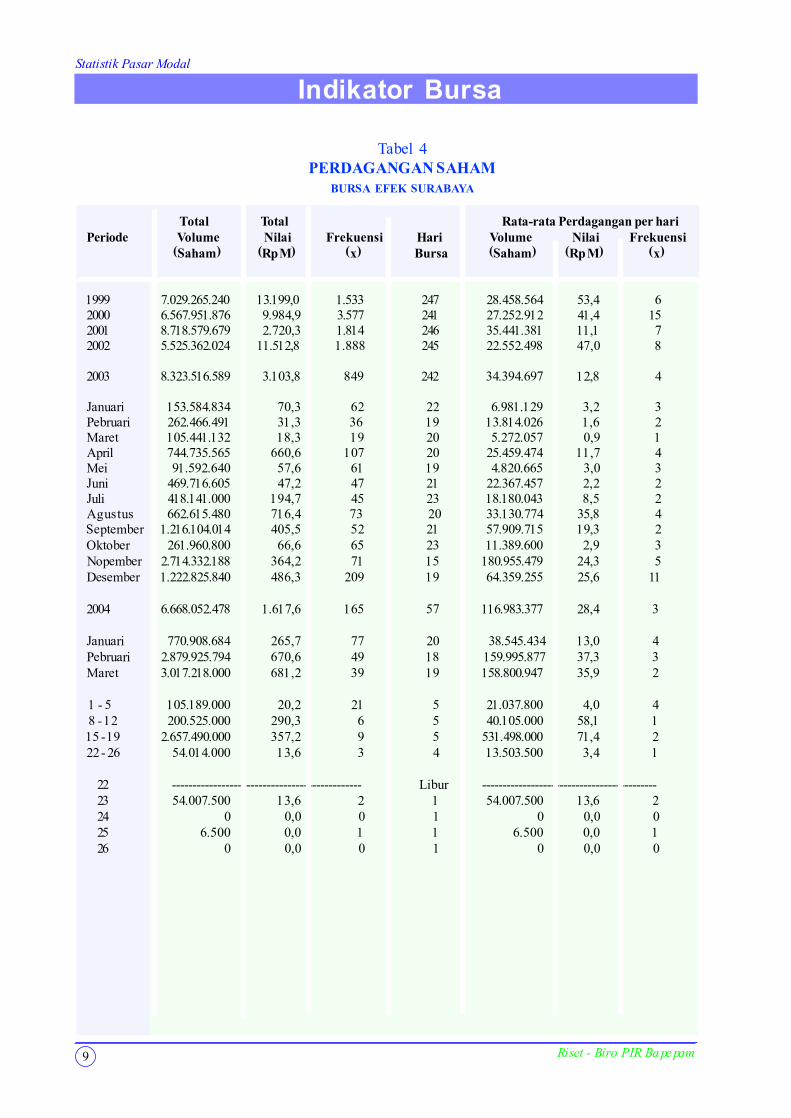
Tabel 4PERDAGANGAN SAHAM
BURSA EFEK SURABAYA
Total Total Rata-rata Perdagangan per hariPeriode Volume Nilai Frekuensi Hari Volume Nilai Frekuensi
(Saham) (Rp M) (x) Bursa (Saham) (Rp M) (x)
1999 7.029.265.240 13.199,0 1.533 247 28.458.564 53,4 62000 6.567.951.876 9.984,9 3.577 241 27.252.912 41,4 152001 8.718.579.679 2.720,3 1.814 246 35.441.381 11,1 72002 5.525.362.024 11.512,8 1.888 245 22.552.498 47,0 8
2003 8.323.516.589 3.103,8 849 242 34.394.697 12,8 4
Januari 153.584.834 70,3 62 22 6.981.129 3,2 3Pebruari 262.466.491 31,3 36 19 13.814.026 1,6 2Maret 105.441.132 18,3 19 20 5.272.057 0,9 1April 744.735.565 660,6 107 20 25.459.474 11,7 4Mei 91.592.640 57,6 61 19 4.820.665 3,0 3Juni 469.716.605 47,2 47 21 22.367.457 2,2 2Juli 418.141.000 194,7 45 23 18.180.043 8,5 2Agustus 662.615.480 716,4 73 20 33.130.774 35,8 4September 1.216.104.014 405,5 52 21 57.909.715 19,3 2Oktober 261.960.800 66,6 65 23 11.389.600 2,9 3Nopember 2.714.332.188 364,2 71 15 180.955.479 24,3 5Desember 1.222.825.840 486,3 209 19 64.359.255 25,6 11
2004 6.668.052.478 1.617,6 165 57 116.983.377 28,4 3
Januari 770.908.684 265,7 77 20 38.545.434 13,0 4Pebruari 2.879.925.794 670,6 49 18 159.995.877 37,3 3Maret 3.017.218.000 681,2 39 19 158.800.947 35,9 2
1 - 5 105.189.000 20,2 21 5 21.037.800 4,0 4 8 - 12 200.525.000 290,3 6 5 40.105.000 58,1 115 - 19 2.657.490.000 357,2 9 5 531.498.000 71,4 222 - 26 54.014.000 13,6 3 4 13.503.500 3,4 1
22 ---------------------------------------------- Libur -------------------------------------------23 54.007.500 13,6 2 1 54.007.500 13,6 224 0 0,0 0 1 0 0,0 025 6.500 0,0 1 1 6.500 0,0 126 0 0,0 0 1 0 0,0 0
Indikator Bursa
Statistik Pasar Modal
10Riset - Biro PIR Bapepam
Indikator BursaIndikator BursaIndikator Bursa
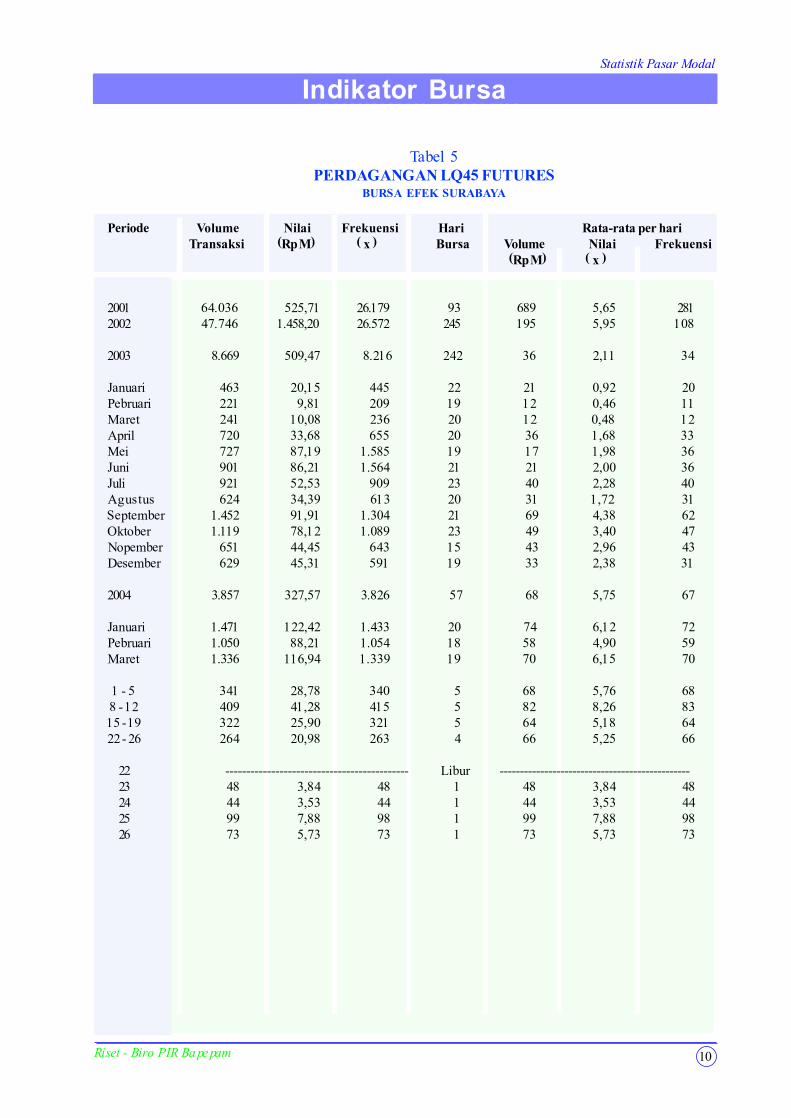
Tabel 5PERDAGANGAN LQ45 FUTURES
BURSA EFEK SURABAYA
Periode Volume Nilai Frekuensi Hari Rata-rata per hari Transaksi (Rp M) ( x ) Bursa Volume Nilai Frekuensi
(Rp M) ( x )
2001 64.036 525,71 26.179 93 689 5,65 2812002 47.746 1.458,20 26.572 245 195 5,95 108
2003 8.669 509,47 8.216 242 36 2,11 34
Januari 463 20,15 445 22 21 0,92 20Pebruari 221 9,81 209 19 12 0,46 11Maret 241 10,08 236 20 12 0,48 12April 720 33,68 655 20 36 1,68 33Mei 727 87,19 1.585 19 17 1,98 36Juni 901 86,21 1.564 21 21 2,00 36Juli 921 52,53 909 23 40 2,28 40Agustus 624 34,39 613 20 31 1,72 31September 1.452 91,91 1.304 21 69 4,38 62Oktober 1.119 78,12 1.089 23 49 3,40 47Nopember 651 44,45 643 15 43 2,96 43Desember 629 45,31 591 19 33 2,38 31
2004 3.857 327,57 3.826 57 68 5,75 67
Januari 1.471 122,42 1.433 20 74 6,12 72Pebruari 1.050 88,21 1.054 18 58 4,90 59Maret 1.336 116,94 1.339 19 70 6,15 70
1 - 5 341 28,78 340 5 68 5,76 68 8 - 12 409 41,28 415 5 82 8,26 8315 - 19 322 25,90 321 5 64 5,18 6422 - 26 264 20,98 263 4 66 5,25 66
22 -------------------------------------------- Libur -----------------------------------------------23 48 3,84 48 1 48 3,84 4824 44 3,53 44 1 44 3,53 4425 99 7,88 98 1 99 7,88 9826 73 5,73 73 1 73 5,73 73
Statistik Pasar Modal
11 Riset - Biro PIR Bapepam
Indikator Bursa
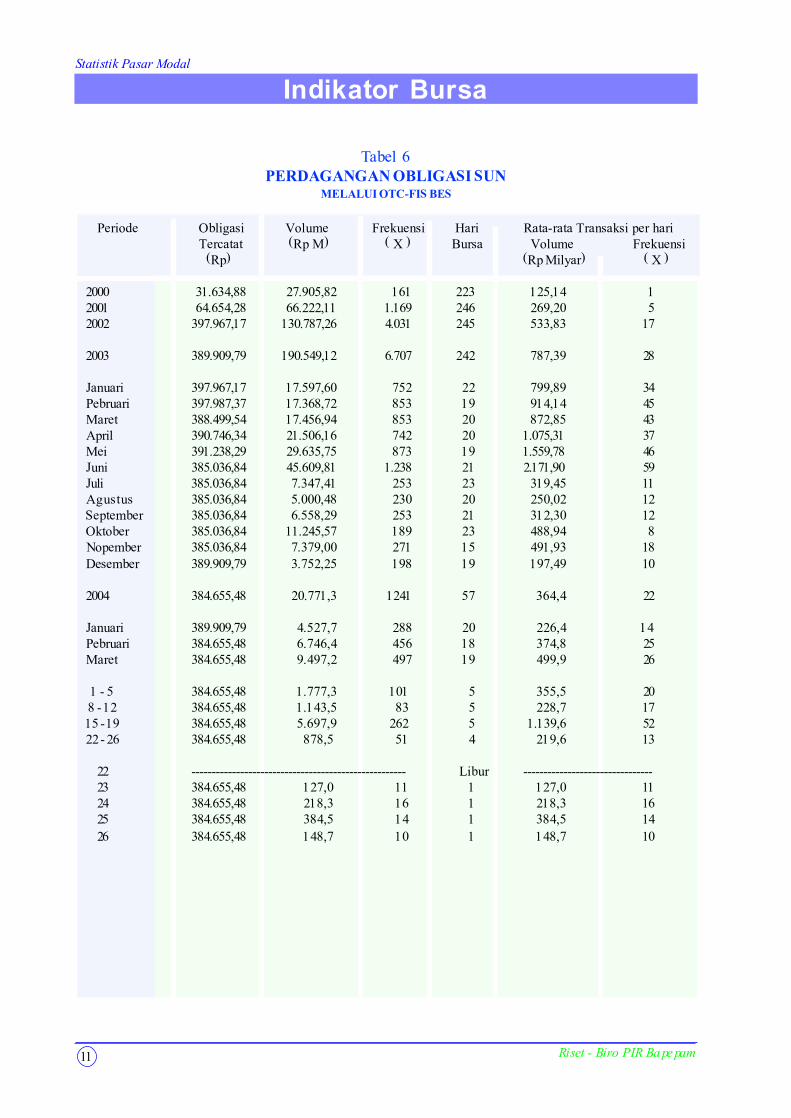
Tabel 6PERDAGANGAN OBLIGASI SUN
MELALUI OTC-FIS BES
Periode Obligasi Volume Frekuensi Hari Rata-rata Transaksi per hariTercatat (Rp M) ( X ) Bursa Volume Frekuensi (Rp) (Rp Milyar) ( X )
2000 31.634,88 27.905,82 161 223 125,14 12001 64.654,28 66.222,11 1.169 246 269,20 52002 397.967,17 130.787,26 4.031 245 533,83 17
2003 389.909,79 190.549,12 6.707 242 787,39 28
Januari 397.967,17 17.597,60 752 22 799,89 34Pebruari 397.987,37 17.368,72 853 19 914,14 45Maret 388.499,54 17.456,94 853 20 872,85 43April 390.746,34 21.506,16 742 20 1.075,31 37Mei 391.238,29 29.635,75 873 19 1.559,78 46Juni 385.036,84 45.609,81 1.238 21 2.171,90 59Juli 385.036,84 7.347,41 253 23 319,45 11Agustus 385.036,84 5.000,48 230 20 250,02 12September 385.036,84 6.558,29 253 21 312,30 12Oktober 385.036,84 11.245,57 189 23 488,94 8Nopember 385.036,84 7.379,00 271 15 491,93 18Desember 389.909,79 3.752,25 198 19 197,49 10
2004 384.655,48 20.771,3 1241 57 364,4 22
Januari 389.909,79 4.527,7 288 20 226,4 14Pebruari 384.655,48 6.746,4 456 18 374,8 25Maret 384.655,48 9.497,2 497 19 499,9 26
1 - 5 384.655,48 1.777,3 101 5 355,5 20 8 - 12 384.655,48 1.143,5 83 5 228,7 1715 - 19 384.655,48 5.697,9 262 5 1.139,6 5222 - 26 384.655,48 878,5 51 4 219,6 13
22 ----------------------------------------------------- Libur --------------------------------23 384.655,48 127,0 11 1 127,0 1124 384.655,48 218,3 16 1 218,3 1625 384.655,48 384,5 14 1 384,5 1426 384.655,48 148,7 10 1 148,7 10
Statistik Pasar Modal
12Riset - Biro PIR Bapepam
Indikator Bursa
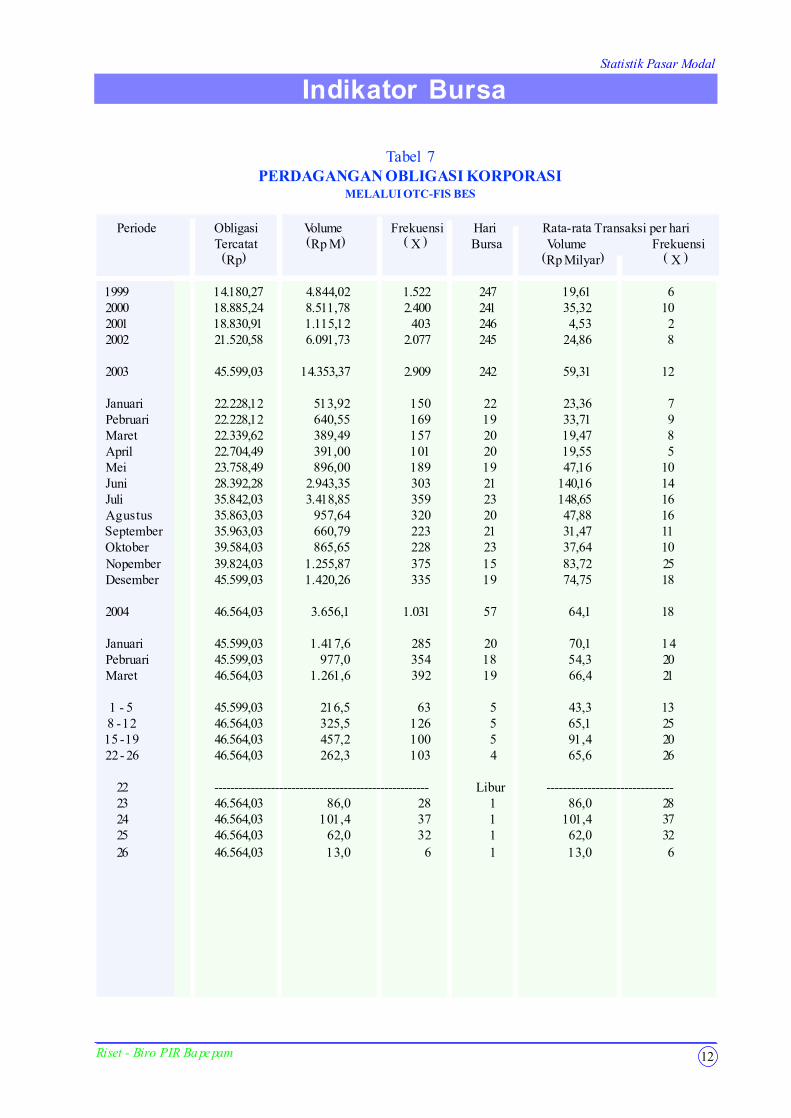
Tabel 7PERDAGANGAN OBLIGASI KORPORASI
MELALUI OTC-FIS BES
Periode Obligasi Volume Frekuensi Hari Rata-rata Transaksi per hariTercatat (Rp M) ( X ) Bursa Volume Frekuensi (Rp) (Rp Milyar) ( X )
1999 14.180,27 4.844,02 1.522 247 19,61 62000 18.885,24 8.511,78 2.400 241 35,32 102001 18.830,91 1.115,12 403 246 4,53 22002 21.520,58 6.091,73 2.077 245 24,86 8
2003 45.599,03 14.353,37 2.909 242 59,31 12
Januari 22.228,12 513,92 150 22 23,36 7Pebruari 22.228,12 640,55 169 19 33,71 9Maret 22.339,62 389,49 157 20 19,47 8April 22.704,49 391,00 101 20 19,55 5Mei 23.758,49 896,00 189 19 47,16 10Juni 28.392,28 2.943,35 303 21 140,16 14Juli 35.842,03 3.418,85 359 23 148,65 16Agustus 35.863,03 957,64 320 20 47,88 16September 35.963,03 660,79 223 21 31,47 11Oktober 39.584,03 865,65 228 23 37,64 10Nopember 39.824,03 1.255,87 375 15 83,72 25Desember 45.599,03 1.420,26 335 19 74,75 18
2004 46.564,03 3.656,1 1.031 57 64,1 18
Januari 45.599,03 1.417,6 285 20 70,1 14Pebruari 45.599,03 977,0 354 18 54,3 20Maret 46.564,03 1.261,6 392 19 66,4 21
1 - 5 45.599,03 216,5 63 5 43,3 13 8 - 12 46.564,03 325,5 126 5 65,1 2515 - 19 46.564,03 457,2 100 5 91,4 2022 - 26 46.564,03 262,3 103 4 65,6 26
22 ----------------------------------------------------- Libur -------------------------------23 46.564,03 86,0 28 1 86,0 2824 46.564,03 101,4 37 1 101,4 3725 46.564,03 62,0 32 1 62,0 3226 46.564,03 13,0 6 1 13,0 6
Statistik Pasar Modal
13 Riset - Biro PIR Bapepam
Indikator BursaIndikator BursaIndikator Bursa
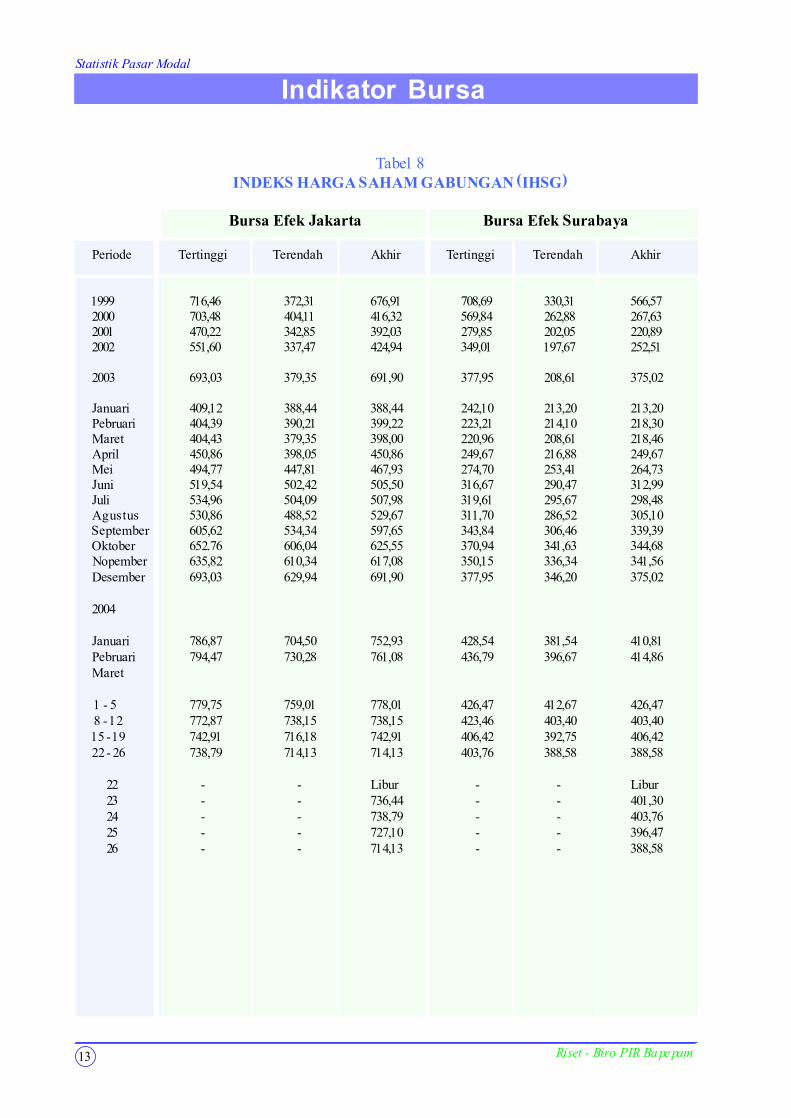
Tabel 8INDEKS HARGA SAHAM GABUNGAN (IHSG)
Bursa Efek Jakarta Bursa Efek Surabaya
Periode Tertinggi Terendah Akhir Tertinggi Terendah Akhir
1999 716,46 372,31 676,91 708,69 330,31 566,572000 703,48 404,11 416,32 569,84 262,88 267,632001 470,22 342,85 392,03 279,85 202,05 220,892002 551,60 337,47 424,94 349,01 197,67 252,51
2003 693,03 379,35 691,90 377,95 208,61 375,02
Januari 409,12 388,44 388,44 242,10 213,20 213,20Pebruari 404,39 390,21 399,22 223,21 214,10 218,30Maret 404,43 379,35 398,00 220,96 208,61 218,46April 450,86 398,05 450,86 249,67 216,88 249,67Mei 494,77 447,81 467,93 274,70 253,41 264,73Juni 519,54 502,42 505,50 316,67 290,47 312,99Juli 534,96 504,09 507,98 319,61 295,67 298,48Agustus 530,86 488,52 529,67 311,70 286,52 305,10September 605,62 534,34 597,65 343,84 306,46 339,39Oktober 652.76 606,04 625,55 370,94 341,63 344,68Nopember 635,82 610,34 617,08 350,15 336,34 341,56Desember 693,03 629,94 691,90 377,95 346,20 375,02
2004
Januari 786,87 704,50 752,93 428,54 381,54 410,81Pebruari 794,47 730,28 761,08 436,79 396,67 414,86Maret
1 - 5 779,75 759,01 778,01 426,47 412,67 426,47 8 - 12 772,87 738,15 738,15 423,46 403,40 403,4015 - 19 742,91 716,18 742,91 406,42 392,75 406,4222 - 26 738,79 714,13 714,13 403,76 388,58 388,58
22 - - Libur - - Libur23 - - 736,44 - - 401,3024 - - 738,79 - - 403,7625 - - 727,10 - - 396,4726 - - 714,13 - - 388,58
Statistik Pasar Modal
14
Indikator Bursa
Riset - Biro PIR Bapepam
Indeks Harga Saham Gabungan
Maret 2002 - 26 Maret 2004
100 150 200 250 300 350 400 450 500 550 600 650 700 750 800 850 900
IHS
G
M A M J J A S O N D 03 J P M A M J J A S O N D 04 J P M
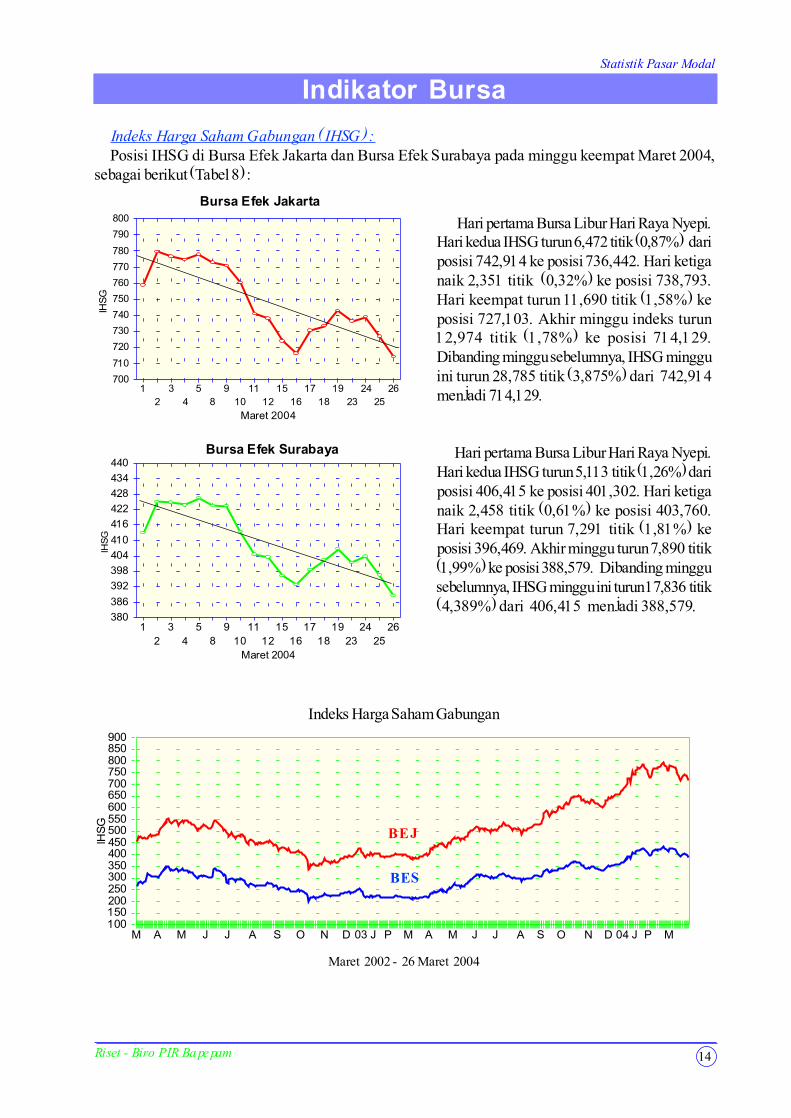
Hari pertama Bursa Libur Hari Raya Nyepi.Hari kedua IHSG turun 6,472 titik (0,87%) dariposisi 742,914 ke posisi 736,442. Hari ketiganaik 2,351 titik (0,32%) ke posisi 738,793.Hari keempat turun 11,690 titik (1,58%) keposisi 727,103. Akhir minggu indeks turun12,974 titik (1,78%) ke posisi 714,129.Dibanding minggu sebelumnya, IHSG mingguini turun 28,785 titik (3,875%) dari 742,914menjadi 714,129.
Hari pertama Bursa Libur Hari Raya Nyepi.Hari kedua IHSG turun 5,113 titik (1,26%) dariposisi 406,415 ke posisi 401,302. Hari ketiganaik 2,458 titik (0,61%) ke posisi 403,760.Hari keempat turun 7,291 titik (1,81%) keposisi 396,469. Akhir minggu turun 7,890 titik(1,99%) ke posisi 388,579. Dibanding minggusebelumnya, IHSG minggu ini turun 17,836 titik(4,389%) dari 406,415 menjadi 388,579.
Indeks Harga Saham Gabungan (IHSG) :Posisi IHSG di Bursa Efek Jakarta dan Bursa Efek Surabaya pada minggu keempat Maret 2004,
sebagai berikut (Tabel 8) :
700
710
720
730
740
750
760
770
780
790
800
IHS
G
12
34
58
910
1112
1516
1718
1923
2425
26
Maret 2004
Bursa Efek Jakarta
380
386
392
398
404
410
416
422
428
434
440
IHS
G
12
34
58
910
1112
1516
1718
1923
2425
26
Maret 2004
Bursa Efek Surabaya
BEJ
BES
Indikator Bursa
Statistik Pasar Modal
15
Indikator Bursa
Riset - Biro PIR Bapepam
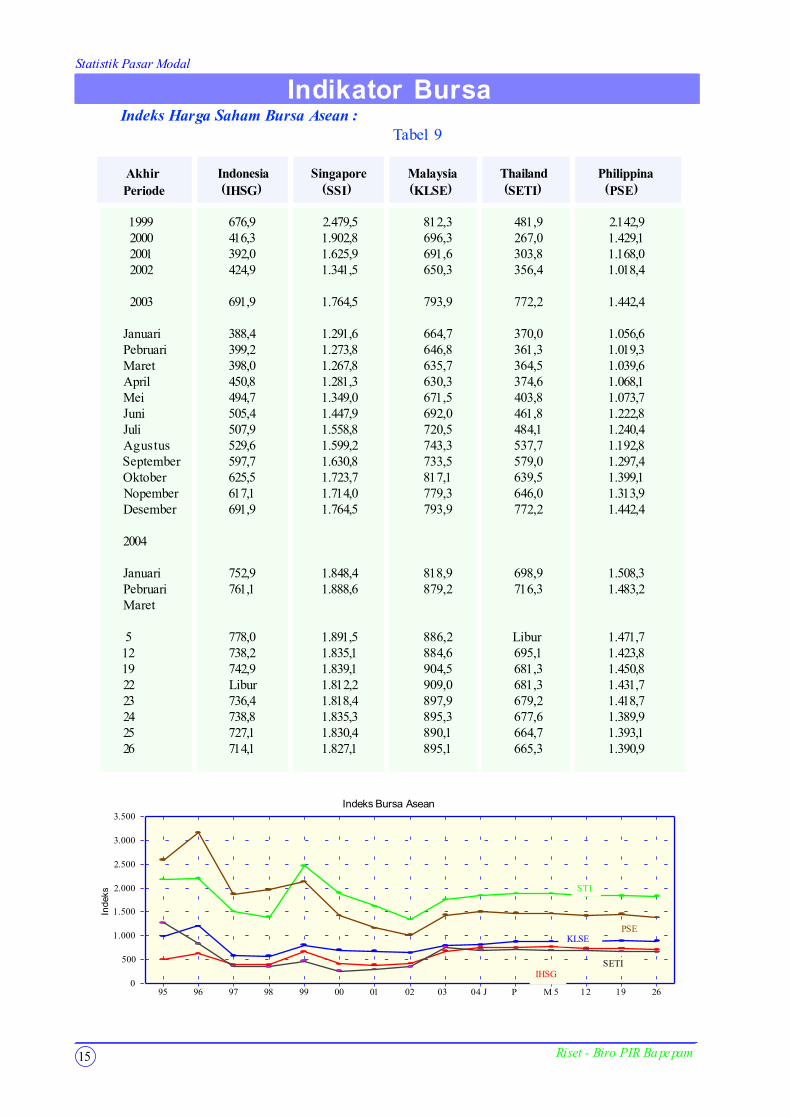
Indikator Bursa Indeks Harga Saham Bursa Asean :
Tabel 9
Akhir Indonesia Singapore Malaysia Thailand PhilippinaPeriode (IHSG) (SSI) (KLSE) (SETI) (PSE)
1999 676,9 2.479,5 812,3 481,9 2.142,92000 416,3 1.902,8 696,3 267,0 1.429,12001 392,0 1.625,9 691,6 303,8 1.168,02002 424,9 1.341,5 650,3 356,4 1.018,4
2003 691,9 1.764,5 793,9 772,2 1.442,4
Januari 388,4 1.291,6 664,7 370,0 1.056,6Pebruari 399,2 1.273,8 646,8 361,3 1.019,3Maret 398,0 1.267,8 635,7 364,5 1.039,6April 450,8 1.281,3 630,3 374,6 1.068,1Mei 494,7 1.349,0 671,5 403,8 1.073,7Juni 505,4 1.447,9 692,0 461,8 1.222,8Juli 507,9 1.558,8 720,5 484,1 1.240,4Agustus 529,6 1.599,2 743,3 537,7 1.192,8September 597,7 1.630,8 733,5 579,0 1.297,4Oktober 625,5 1.723,7 817,1 639,5 1.399,1Nopember 617,1 1.714,0 779,3 646,0 1.313,9Desember 691,9 1.764,5 793,9 772,2 1.442,4
2004
Januari 752,9 1.848,4 818,9 698,9 1.508,3Pebruari 761,1 1.888,6 879,2 716,3 1.483,2Maret
5 778,0 1.891,5 886,2 Libur 1.471,712 738,2 1.835,1 884,6 695,1 1.423,819 742,9 1.839,1 904,5 681,3 1.450,822 Libur 1.812,2 909,0 681,3 1.431,723 736,4 1.818,4 897,9 679,2 1.418,724 738,8 1.835,3 895,3 677,6 1.389,925 727,1 1.830,4 890,1 664,7 1.393,126 714,1 1.827,1 895,1 665,3 1.390,9
0
500
1.000
1.500
2.000
2.500
3.000
3.500
Inde
ks
95 96 97 98 99 00 01 02 03 04 J P M 5 12 19 26
Indeks Bursa Asean
PSE
SETIIHSG
STI
KLSE
Statistik Pasar Modal
16
Indikator Bursa
Riset - Biro PIR Bapepam
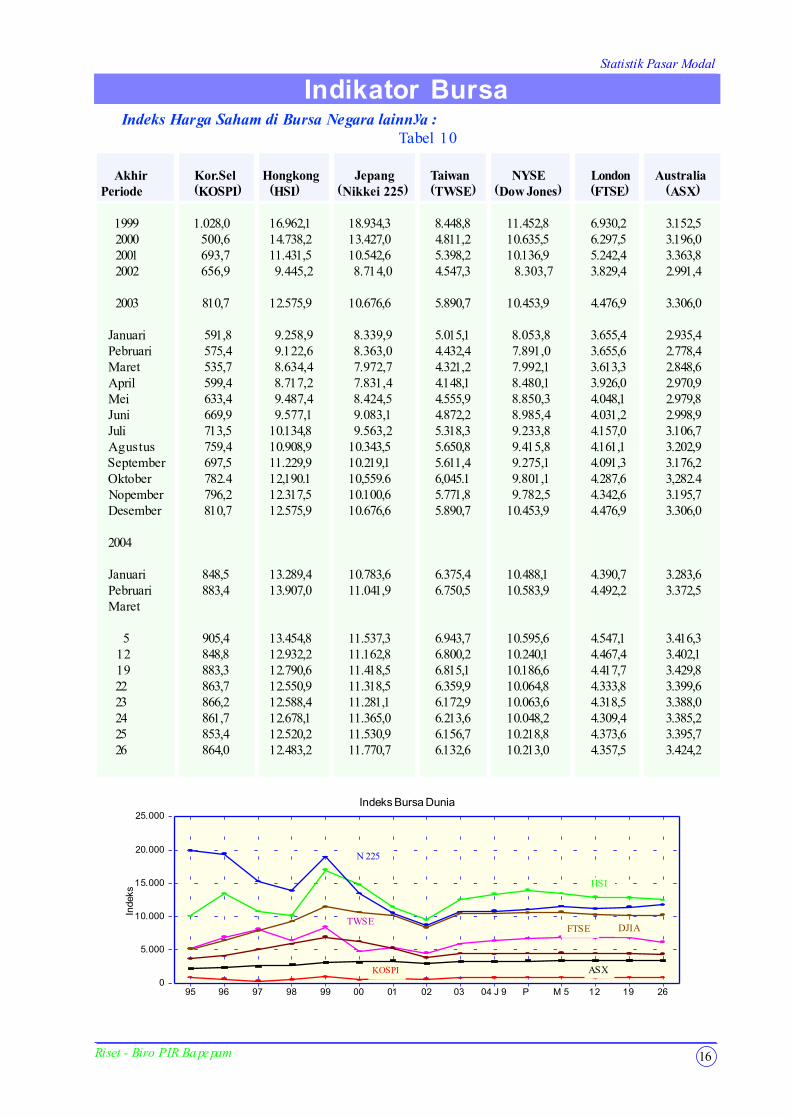
Indikator Bursa Indeks Harga Saham di Bursa Negara lainnya :
Tabel 10
Akhir Kor.Sel Hongkong Jepang Taiwan NYSE London AustraliaPeriode (KOSPI) (HSI) (Nikkei 225) (TWSE) (Dow Jones) (FTSE) (ASX)
1999 1.028,0 16.962,1 18.934,3 8.448,8 11.452,8 6.930,2 3.152,52000 500,6 14.738,2 13.427,0 4.811,2 10.635,5 6.297,5 3.196,02001 693,7 11.431,5 10.542,6 5.398,2 10.136,9 5.242,4 3.363,82002 656,9 9.445,2 8.714,0 4.547,3 8.303,7 3.829,4 2.991,4
2003 810,7 12.575,9 10.676,6 5.890,7 10.453,9 4.476,9 3.306,0
Januari 591,8 9.258,9 8.339,9 5.015,1 8.053,8 3.655,4 2.935,4Pebruari 575,4 9.122,6 8.363,0 4.432,4 7.891,0 3.655,6 2.778,4Maret 535,7 8.634,4 7.972,7 4.321,2 7.992,1 3.613,3 2.848,6April 599,4 8.717,2 7.831,4 4.148,1 8.480,1 3.926,0 2.970,9Mei 633,4 9.487,4 8.424,5 4.555,9 8.850,3 4.048,1 2.979,8Juni 669,9 9.577,1 9.083,1 4.872,2 8.985,4 4.031,2 2.998,9Juli 713,5 10.134,8 9.563,2 5.318,3 9.233,8 4.157,0 3.106,7Agustus 759,4 10.908,9 10.343,5 5.650,8 9.415,8 4.161,1 3.202,9September 697,5 11.229,9 10.219,1 5.611,4 9.275,1 4.091,3 3.176,2Oktober 782.4 12,190.1 10,559.6 6,045.1 9.801,1 4.287,6 3,282.4Nopember 796,2 12.317,5 10.100,6 5.771,8 9.782,5 4.342,6 3.195,7Desember 810,7 12.575,9 10.676,6 5.890,7 10.453,9 4.476,9 3.306,0
2004
Januari 848,5 13.289,4 10.783,6 6.375,4 10.488,1 4.390,7 3.283,6Pebruari 883,4 13.907,0 11.041,9 6.750,5 10.583,9 4.492,2 3.372,5Maret
5 905,4 13.454,8 11.537,3 6.943,7 10.595,6 4.547,1 3.416,3 12 848,8 12.932,2 11.162,8 6.800,2 10.240,1 4.467,4 3.402,1 19 883,3 12.790,6 11.418,5 6.815,1 10.186,6 4.417,7 3.429,822 863,7 12.550,9 11.318,5 6.359,9 10.064,8 4.333,8 3.399,623 866,2 12.588,4 11.281,1 6.172,9 10.063,6 4.318,5 3.388,024 861,7 12.678,1 11.365,0 6.213,6 10.048,2 4.309,4 3.385,225 853,4 12.520,2 11.530,9 6.156,7 10.218,8 4.373,6 3.395,726 864,0 12.483,2 11.770,7 6.132,6 10.213,0 4.357,5 3.424,2
0
5.000
10.000
15.000
20.000
25.000
Inde
ks
95 96 97 98 99 00 01 02 03 04 J 9 P M 5 12 19 26
Indeks Bursa Dunia
N 225
KOSPI
HSI
TWSEDJIAFTSE
ASX
Statistik Pasar Modal
17
Indikator Bursa
Riset - Biro PIR Bapepam
0
100
200
300
400
500
600
(Rp
triliu
n)
95 96 97 98 99 00 01 02 03 04 J P M 5 12 19 26
BEJ BES
Nilai Kapitalisasi
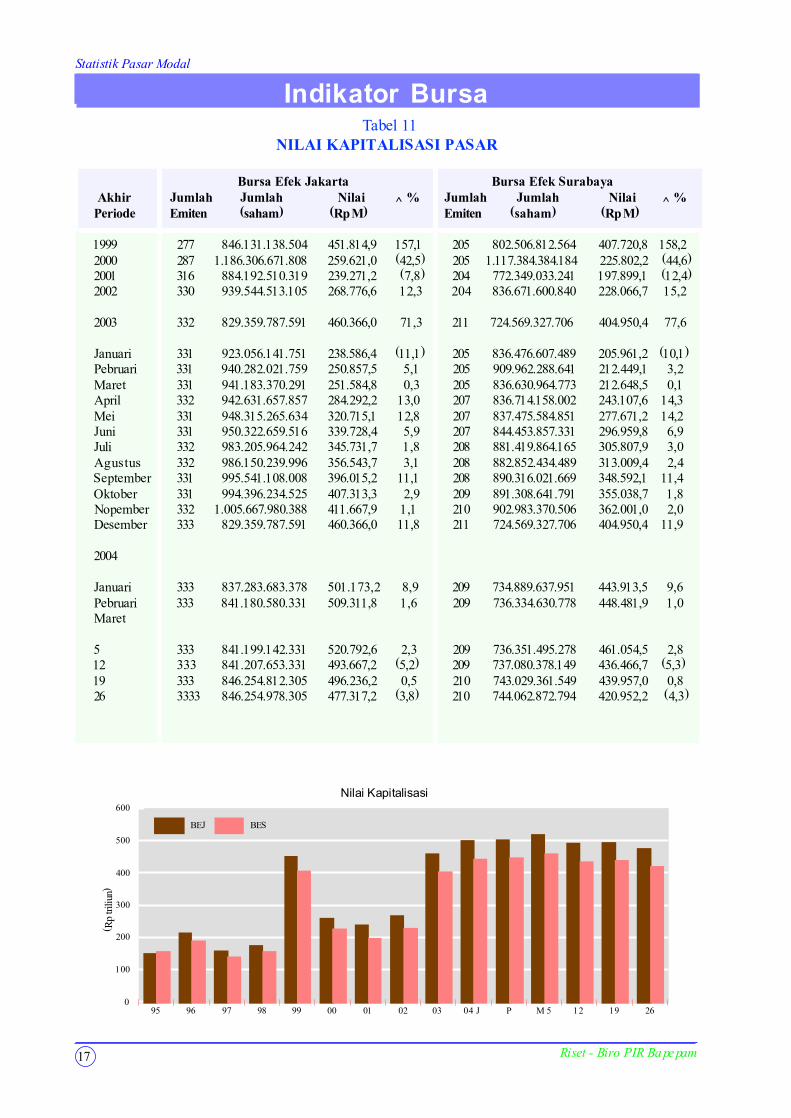
Indikator BursaTabel 11
NILAI KAPITALISASI PASAR
Bursa Efek Jakarta Bursa Efek Surabaya Akhir Jumlah Jumlah Nilai ^ % Jumlah Jumlah Nilai ^ %Periode Emiten (saham) (Rp M) Emiten (saham) (Rp M)
1999 277 846.131.138.504 451.814,9 157,1 205 802.506.812.564 407.720,8 158,22000 287 1.186.306.671.808 259.621,0 (42,5) 205 1.117.384.384.184 225.802,2 (44,6)2001 316 884.192.510.319 239.271,2 (7,8) 204 772.349.033.241 197.899,1 (12,4)2002 330 939.544.513.105 268.776,6 12,3 204 836.671.600.840 228.066,7 15,2
2003 332 829.359.787.591 460.366,0 71,3 211 724.569.327.706 404.950,4 77,6
Januari 331 923.056.141.751 238.586,4 (11,1) 205 836.476.607.489 205.961,2 (10,1)Pebruari 331 940.282.021.759 250.857,5 5,1 205 909.962.288.641 212.449,1 3,2Maret 331 941.183.370.291 251.584,8 0,3 205 836.630.964.773 212.648,5 0,1April 332 942.631.657.857 284.292,2 13,0 207 836.714.158.002 243.107,6 14,3Mei 331 948.315.265.634 320.715,1 12,8 207 837.475.584.851 277.671,2 14,2Juni 331 950.322.659.516 339.728,4 5,9 207 844.453.857.331 296.959,8 6,9Juli 332 983.205.964.242 345.731,7 1,8 208 881.419.864.165 305.807,9 3,0Agustus 332 986.150.239.996 356.543,7 3,1 208 882.852.434.489 313.009,4 2,4September 331 995.541.108.008 396.015,2 11,1 208 890.316.021.669 348.592,1 11,4Oktober 331 994.396.234.525 407.313,3 2,9 209 891.308.641.791 355.038,7 1,8Nopember 332 1.005.667.980.388 411.667,9 1,1 210 902.983.370.506 362.001,0 2,0Desember 333 829.359.787.591 460.366,0 11,8 211 724.569.327.706 404.950,4 11,9
2004
Januari 333 837.283.683.378 501.173,2 8,9 209 734.889.637.951 443.913,5 9,6Pebruari 333 841.180.580.331 509.311,8 1,6 209 736.334.630.778 448.481,9 1,0Maret
5 333 841.199.142.331 520.792,6 2,3 209 736.351.495.278 461.054,5 2,812 333 841.207.653.331 493.667,2 (5,2) 209 737.080.378.149 436.466,7 (5,3)19 333 846.254.812.305 496.236,2 0,5 210 743.029.361.549 439.957,0 0,826 3333 846.254.978.305 477.317,2 (3,8) 210 744.062.872.794 420.952,2 (4,3)
Statistik Pasar Modal
18
Indikator Bursa
Riset - Biro PIR Bapepam
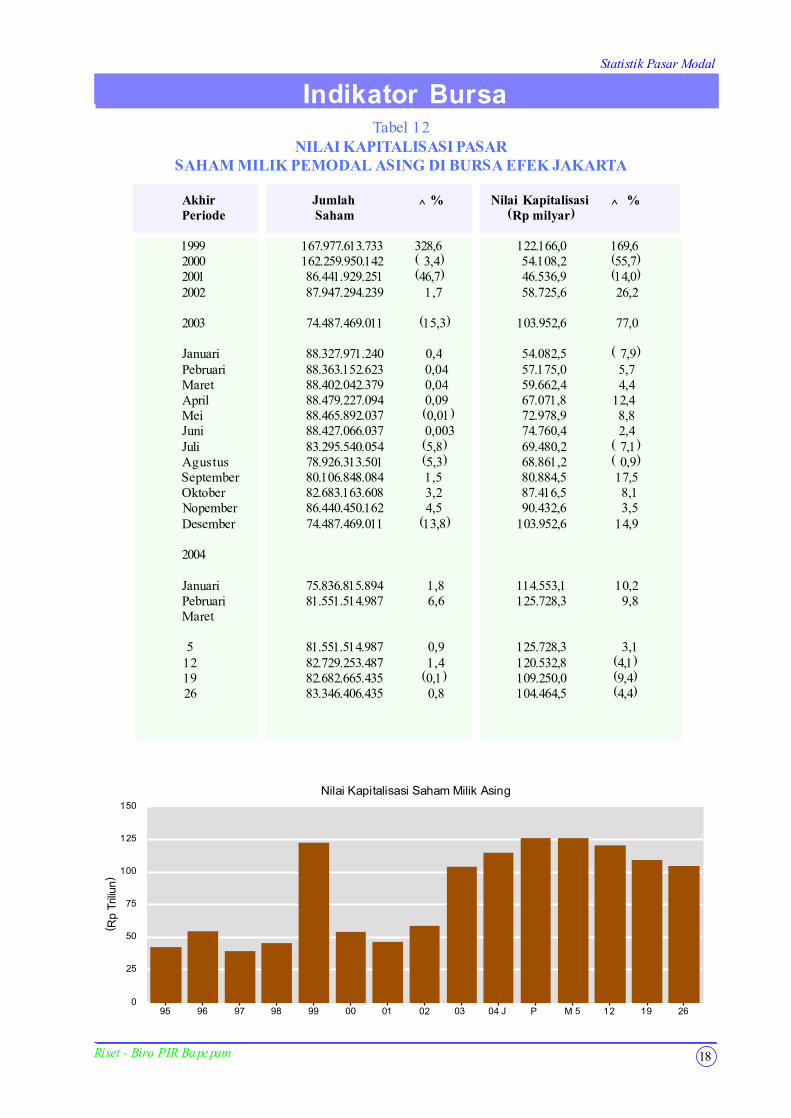
Akhir Jumlah ^ % Nilai Kapitalisasi ^ %Periode Saham (Rp milyar)
1999 167.977.613.733 328,6 122.166,0 169,62000 162.259.950.142 ( 3,4) 54.108,2 (55,7)2001 86.441.929.251 (46,7) 46.536,9 (14,0)2002 87.947.294.239 1,7 58.725,6 26,2
2003 74.487.469.011 (15,3) 103.952,6 77,0
Januari 88.327.971.240 0,4 54.082,5 ( 7,9)Pebruari 88.363.152.623 0,04 57.175,0 5,7Maret 88.402.042.379 0,04 59.662,4 4,4April 88.479.227.094 0,09 67.071,8 12,4Mei 88.465.892.037 (0,01) 72.978,9 8,8Juni 88.427.066.037 0,003 74.760,4 2,4Juli 83.295.540.054 (5,8) 69.480,2 ( 7,1)Agustus 78.926.313.501 (5,3) 68.861,2 ( 0,9)September 80.106.848.084 1,5 80.884,5 17,5Oktober 82.683.163.608 3,2 87.416,5 8,1Nopember 86.440.450.162 4,5 90.432,6 3,5Desember 74.487.469.011 (13,8) 103.952,6 14,9
2004
Januari 75.836.815.894 1,8 114.553,1 10,2Pebruari 81.551.514.987 6,6 125.728,3 9,8Maret
5 81.551.514.987 0,9 125.728,3 3,1 12 82.729.253.487 1,4 120.532,8 (4,1) 19 82.682.665.435 (0,1) 109.250,0 (9,4) 26 83.346.406.435 0,8 104.464,5 (4,4)
0
25
50
75
100
125
150
(Rp
Tril
iun)
95 96 97 98 99 00 01 02 03 04 J P M 5 12 19 26
Nilai Kapitalisasi Saham Milik Asing
Indikator BursaTabel 12
NILAI KAPITALISASI PASARSAHAM MILIK PEMODAL ASING DI BURSA EFEK JAKARTA
Statistik Pasar Modal
19 Riset - Biro PIR Bapepam
Indikator Bursa
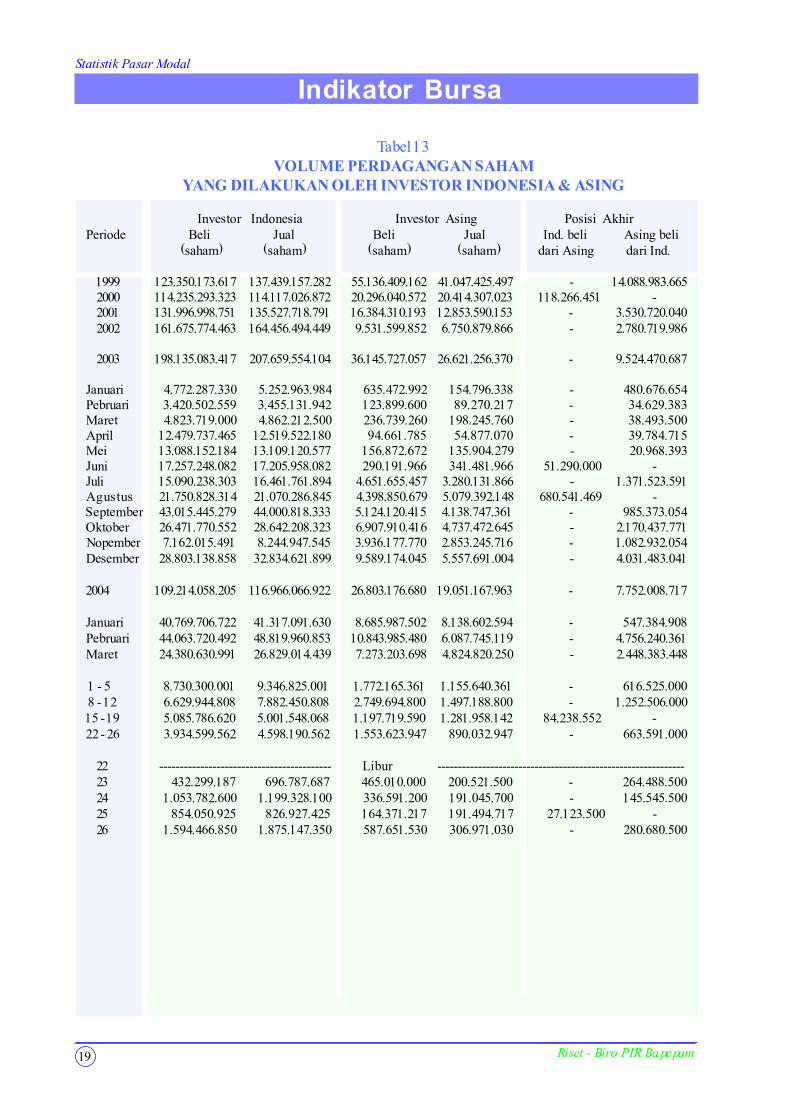
Tabel 13VOLUME PERDAGANGAN SAHAM
YANG DILAKUKAN OLEH INVESTOR INDONESIA & ASING
Investor Indonesia Investor Asing Posisi AkhirPeriode Beli Jual Beli Jual Ind. beli Asing beli
(saham) (saham) (saham) (saham) dari Asing dari Ind.
1999 123.350.173.617 137.439.157.282 55.136.409.162 41.047.425.497 - 14.088.983.6652000 114.235.293.323 114.117.026.872 20.296.040.572 20.414.307.023 118.266.451 -2001 131.996.998.751 135.527.718.791 16.384.310.193 12.853.590.153 - 3.530.720.0402002 161.675.774.463 164.456.494.449 9.531.599.852 6.750.879.866 - 2.780.719.986
2003 198.135.083.417 207.659.554.104 36.145.727.057 26.621.256.370 - 9.524.470.687
Januari 4.772.287.330 5.252.963.984 635.472.992 154.796.338 - 480.676.654Pebruari 3.420.502.559 3.455.131.942 123.899.600 89.270.217 - 34.629.383Maret 4.823.719.000 4.862.212.500 236.739.260 198.245.760 - 38.493.500April 12.479.737.465 12.519.522.180 94.661.785 54.877.070 - 39.784.715Mei 13.088.152.184 13.109.120.577 156.872.672 135.904.279 - 20.968.393Juni 17.257.248.082 17.205.958.082 290.191.966 341.481.966 51.290.000 -Juli 15.090.238.303 16.461.761.894 4.651.655.457 3.280.131.866 - 1.371.523.591Agustus 21.750.828.314 21.070.286.845 4.398.850.679 5.079.392.148 680.541.469 -September 43.015.445.279 44.000.818.333 5.124.120.415 4.138.747.361 - 985.373.054Oktober 26.471.770.552 28.642.208.323 6.907.910.416 4.737.472.645 - 2.170.437.771Nopember 7.162.015.491 8.244.947.545 3.936.177.770 2.853.245.716 - 1.082.932.054Desember 28.803.138.858 32.834.621.899 9.589.174.045 5.557.691.004 - 4.031.483.041
2004 109.214.058.205 116.966.066.922 26.803.176.680 19.051.167.963 - 7.752.008.717
Januari 40.769.706.722 41.317.091.630 8.685.987.502 8.138.602.594 - 547.384.908Pebruari 44.063.720.492 48.819.960.853 10.843.985.480 6.087.745.119 - 4.756.240.361Maret 24.380.630.991 26.829.014.439 7.273.203.698 4.824.820.250 - 2.448.383.448
1 - 5 8.730.300.001 9.346.825.001 1.772.165.361 1.155.640.361 - 616.525.000 8 - 12 6.629.944.808 7.882.450.808 2.749.694.800 1.497.188.800 - 1.252.506.00015 - 19 5.085.786.620 5.001.548.068 1.197.719.590 1.281.958.142 84.238.552 -22 - 26 3.934.599.562 4.598.190.562 1.553.623.947 890.032.947 - 663.591.000
22 ------------------------------------------ Libur -------------------------------------------------------------23 432.299.187 696.787.687 465.010.000 200.521.500 - 264.488.50024 1.053.782.600 1.199.328.100 336.591.200 191.045.700 - 145.545.50025 854.050.925 826.927.425 164.371.217 191.494.717 27.123.500 -26 1.594.466.850 1.875.147.350 587.651.530 306.971.030 - 280.680.500
Indikator Bursa
Statistik Pasar Modal
20
Indikator Bursa
Riset - Biro PIR Bapepam
Indikator Bursa
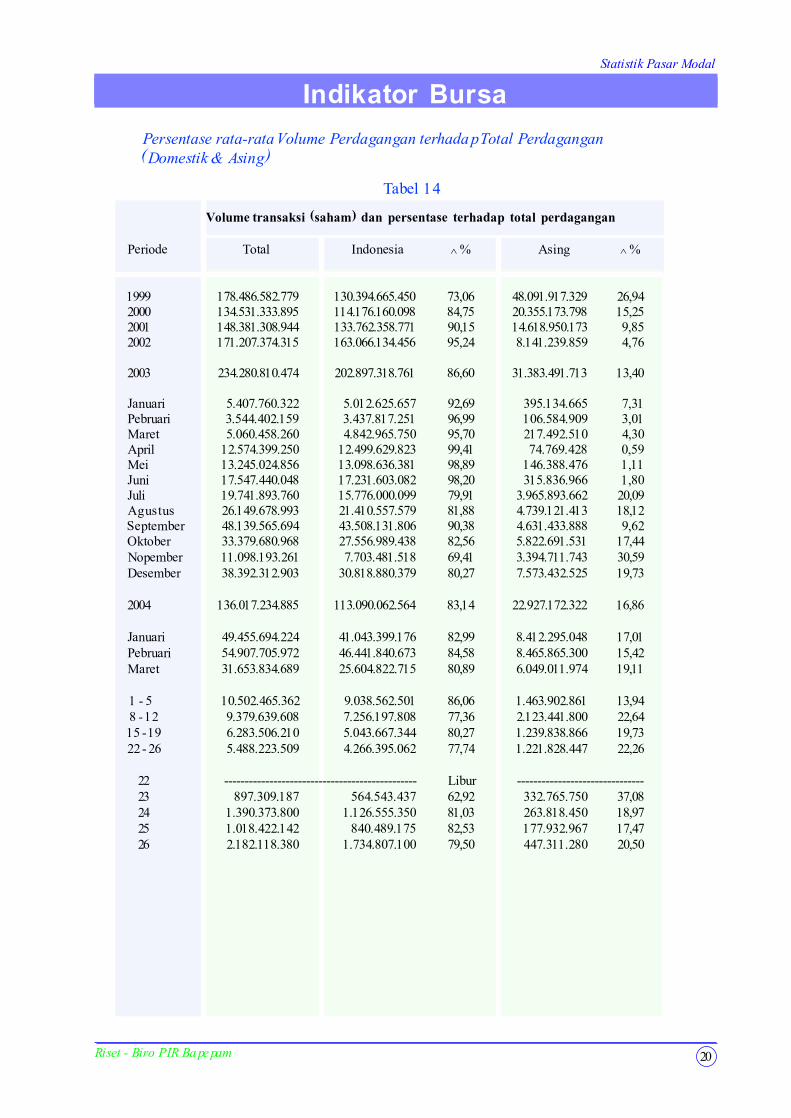
Tabel 14
Persentase rata-rata Volume Perdagangan terhadap Total Perdagangan(Domestik & Asing)
Volume transaksi (saham) dan persentase terhadap total perdagangan
Periode Total Indonesia ̂ % Asing ̂ %
1999 178.486.582.779 130.394.665.450 73,06 48.091.917.329 26,942000 134.531.333.895 114.176.160.098 84,75 20.355.173.798 15,252001 148.381.308.944 133.762.358.771 90,15 14.618.950.173 9,852002 171.207.374.315 163.066.134.456 95,24 8.141.239.859 4,76
2003 234.280.810.474 202.897.318.761 86,60 31.383.491.713 13,40
Januari 5.407.760.322 5.012.625.657 92,69 395.134.665 7,31Pebruari 3.544.402.159 3.437.817.251 96,99 106.584.909 3,01Maret 5.060.458.260 4.842.965.750 95,70 217.492.510 4,30April 12.574.399.250 12.499.629.823 99,41 74.769.428 0,59Mei 13.245.024.856 13.098.636.381 98,89 146.388.476 1,11Juni 17.547.440.048 17.231.603.082 98,20 315.836.966 1,80Juli 19.741.893.760 15.776.000.099 79,91 3.965.893.662 20,09Agustus 26.149.678.993 21.410.557.579 81,88 4.739.121.413 18,12September 48.139.565.694 43.508.131.806 90,38 4.631.433.888 9,62Oktober 33.379.680.968 27.556.989.438 82,56 5.822.691.531 17,44Nopember 11.098.193.261 7.703.481.518 69,41 3.394.711.743 30,59Desember 38.392.312.903 30.818.880.379 80,27 7.573.432.525 19,73
2004 136.017.234.885 113.090.062.564 83,14 22.927.172.322 16,86
Januari 49.455.694.224 41.043.399.176 82,99 8.412.295.048 17,01Pebruari 54.907.705.972 46.441.840.673 84,58 8.465.865.300 15,42Maret 31.653.834.689 25.604.822.715 80,89 6.049.011.974 19,11
1 - 5 10.502.465.362 9.038.562.501 86,06 1.463.902.861 13,94 8 - 12 9.379.639.608 7.256.197.808 77,36 2.123.441.800 22,6415 - 19 6.283.506.210 5.043.667.344 80,27 1.239.838.866 19,7322 - 26 5.488.223.509 4.266.395.062 77,74 1.221.828.447 22,26
22 ----------------------------------------------- Libur -------------------------------23 897.309.187 564.543.437 62,92 332.765.750 37,0824 1.390.373.800 1.126.555.350 81,03 263.818.450 18,9725 1.018.422.142 840.489.175 82,53 177.932.967 17,4726 2.182.118.380 1.734.807.100 79,50 447.311.280 20,50
Statistik Pasar Modal
21
Indikator Bursa
Riset - Biro PIR Bapepam
Indikator Bursa
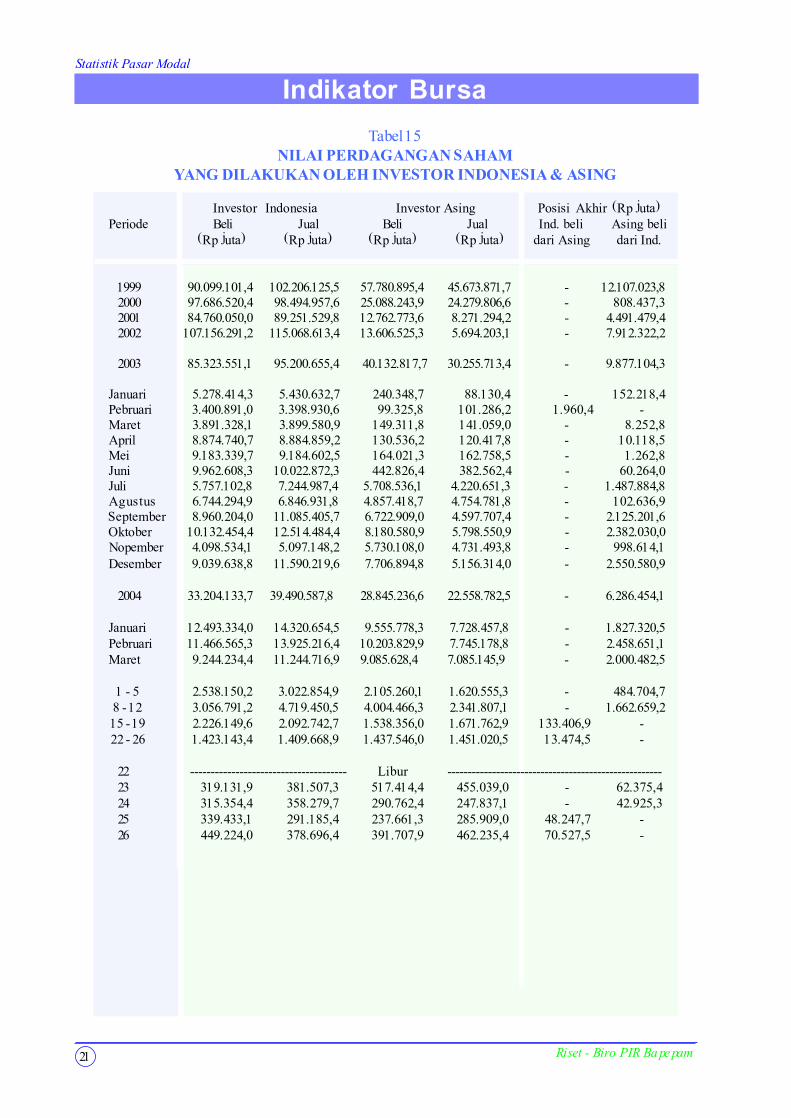
Tabel 15NILAI PERDAGANGAN SAHAM
YANG DILAKUKAN OLEH INVESTOR INDONESIA & ASING
Investor Indonesia Investor Asing Posisi Akhir (Rp juta)Periode Beli Jual Beli Jual Ind. beli Asing beli
(Rp juta) (Rp juta) (Rp juta) (Rp juta) dari Asing dari Ind.
1999 90.099.101,4 102.206.125,5 57.780.895,4 45.673.871,7 - 12.107.023,82000 97.686.520,4 98.494.957,6 25.088.243,9 24.279.806,6 - 808.437,32001 84.760.050,0 89.251.529,8 12.762.773,6 8.271.294,2 - 4.491.479,42002 107.156.291,2 115.068.613,4 13.606.525,3 5.694.203,1 - 7.912.322,2
2003 85.323.551,1 95.200.655,4 40.132.817,7 30.255.713,4 - 9.877.104,3
Januari 5.278.414,3 5.430.632,7 240.348,7 88.130,4 - 152.218,4Pebruari 3.400.891,0 3.398.930,6 99.325,8 101.286,2 1.960,4 -Maret 3.891.328,1 3.899.580,9 149.311,8 141.059,0 - 8.252,8April 8.874.740,7 8.884.859,2 130.536,2 120.417,8 - 10.118,5Mei 9.183.339,7 9.184.602,5 164.021,3 162.758,5 - 1.262,8Juni 9.962.608,3 10.022.872,3 442.826,4 382.562,4 - 60.264,0Juli 5.757.102,8 7.244.987,4 5.708.536,1 4.220.651,3 - 1.487.884,8Agustus 6.744.294,9 6.846.931,8 4.857.418,7 4.754.781,8 - 102.636,9September 8.960.204,0 11.085.405,7 6.722.909,0 4.597.707,4 - 2.125.201,6Oktober 10.132.454,4 12.514.484,4 8.180.580,9 5.798.550,9 - 2.382.030,0Nopember 4.098.534,1 5.097.148,2 5.730.108,0 4.731.493,8 - 998.614,1Desember 9.039.638,8 11.590.219,6 7.706.894,8 5.156.314,0 - 2.550.580,9
2004 33.204.133,7 39.490.587,8 28.845.236,6 22.558.782,5 - 6.286.454,1
Januari 12.493.334,0 14.320.654,5 9.555.778,3 7.728.457,8 - 1.827.320,5Pebruari 11.466.565,3 13.925.216,4 10.203.829,9 7.745.178,8 - 2.458.651,1Maret 9.244.234,4 11.244.716,9 9.085.628,4 7.085.145,9 - 2.000.482,5
1 - 5 2.538.150,2 3.022.854,9 2.105.260,1 1.620.555,3 - 484.704,7 8 - 12 3.056.791,2 4.719.450,5 4.004.466,3 2.341.807,1 - 1.662.659,2 15 - 19 2.226.149,6 2.092.742,7 1.538.356,0 1.671.762,9 133.406,9 - 22 - 26 1.423.143,4 1.409.668,9 1.437.546,0 1.451.020,5 13.474,5 -
22 -------------------------------------- Libur -----------------------------------------------------23 319.131,9 381.507,3 517.414,4 455.039,0 - 62.375,424 315.354,4 358.279,7 290.762,4 247.837,1 - 42.925,325 339.433,1 291.185,4 237.661,3 285.909,0 48.247,7 -26 449.224,0 378.696,4 391.707,9 462.235,4 70.527,5 -
Statistik Pasar Modal
22
Indikator Bursa
Riset - Biro PIR Bapepam
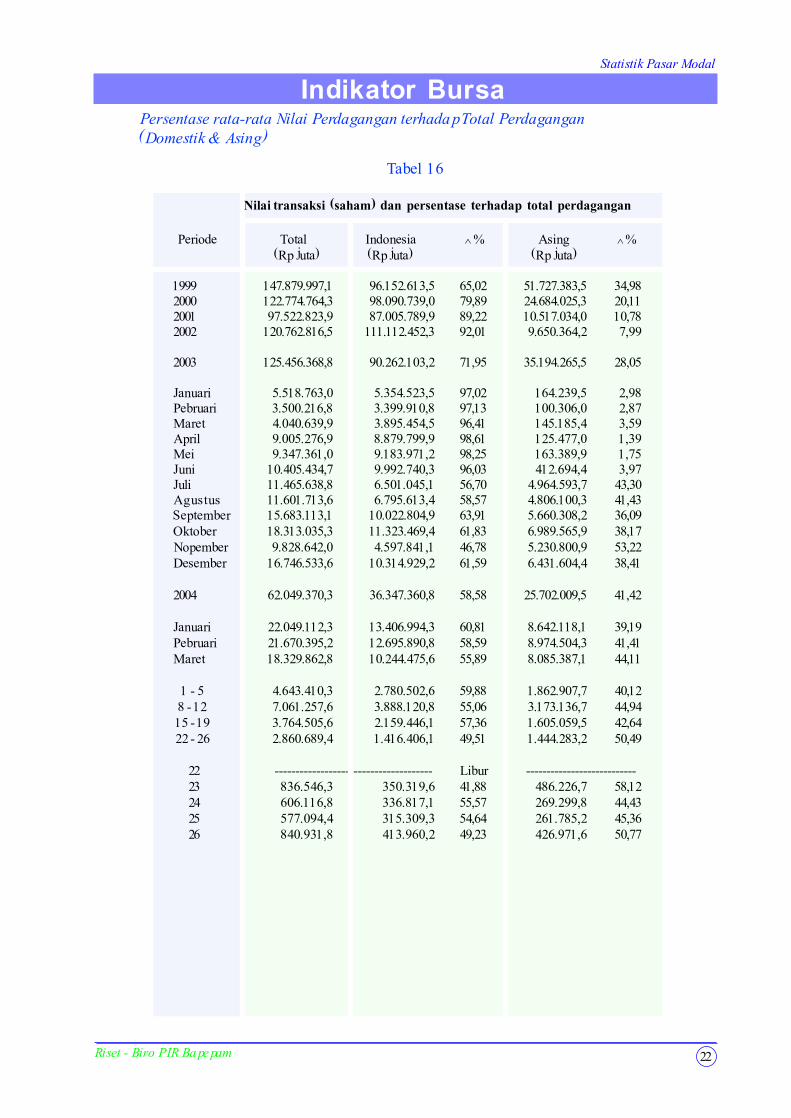
Periode Total Indonesia ̂ % Asing ̂ % (Rp juta) (Rp juta) (Rp juta)
1999 147.879.997,1 96.152.613,5 65,02 51.727.383,5 34,982000 122.774.764,3 98.090.739,0 79,89 24.684.025,3 20,112001 97.522.823,9 87.005.789,9 89,22 10.517.034,0 10,782002 120.762.816,5 111.112.452,3 92,01 9.650.364,2 7,99
2003 125.456.368,8 90.262.103,2 71,95 35.194.265,5 28,05
Januari 5.518.763,0 5.354.523,5 97,02 164.239,5 2,98Pebruari 3.500.216,8 3.399.910,8 97,13 100.306,0 2,87Maret 4.040.639,9 3.895.454,5 96,41 145.185,4 3,59April 9.005.276,9 8.879.799,9 98,61 125.477,0 1,39Mei 9.347.361,0 9.183.971,2 98,25 163.389,9 1,75Juni 10.405.434,7 9.992.740,3 96,03 412.694,4 3,97Juli 11.465.638,8 6.501.045,1 56,70 4.964.593,7 43,30Agustus 11.601.713,6 6.795.613,4 58,57 4.806.100,3 41,43September 15.683.113,1 10.022.804,9 63,91 5.660.308,2 36,09Oktober 18.313.035,3 11.323.469,4 61,83 6.989.565,9 38,17Nopember 9.828.642,0 4.597.841,1 46,78 5.230.800,9 53,22Desember 16.746.533,6 10.314.929,2 61,59 6.431.604,4 38,41
2004 62.049.370,3 36.347.360,8 58,58 25.702.009,5 41,42
Januari 22.049.112,3 13.406.994,3 60,81 8.642.118,1 39,19Pebruari 21.670.395,2 12.695.890,8 58,59 8.974.504,3 41,41Maret 18.329.862,8 10.244.475,6 55,89 8.085.387,1 44,11
1 - 5 4.643.410,3 2.780.502,6 59,88 1.862.907,7 40,12 8 - 12 7.061.257,6 3.888.120,8 55,06 3.173.136,7 44,94 15 - 19 3.764.505,6 2.159.446,1 57,36 1.605.059,5 42,64 22 - 26 2.860.689,4 1.416.406,1 49,51 1.444.283,2 50,49
22 -------------------------------------- Libur ---------------------------23 836.546,3 350.319,6 41,88 486.226,7 58,1224 606.116,8 336.817,1 55,57 269.299,8 44,4325 577.094,4 315.309,3 54,64 261.785,2 45,3626 840.931,8 413.960,2 49,23 426.971,6 50,77
Tabel 16
Persentase rata-rata Nilai Perdagangan terhadap Total Perdagangan(Domestik & Asing)
Indikator Bursa
Nilai transaksi (saham) dan persentase terhadap total perdagangan
Statistik Pasar Modal
23 Riset - Biro PIR Bapepam
Saham BUMN
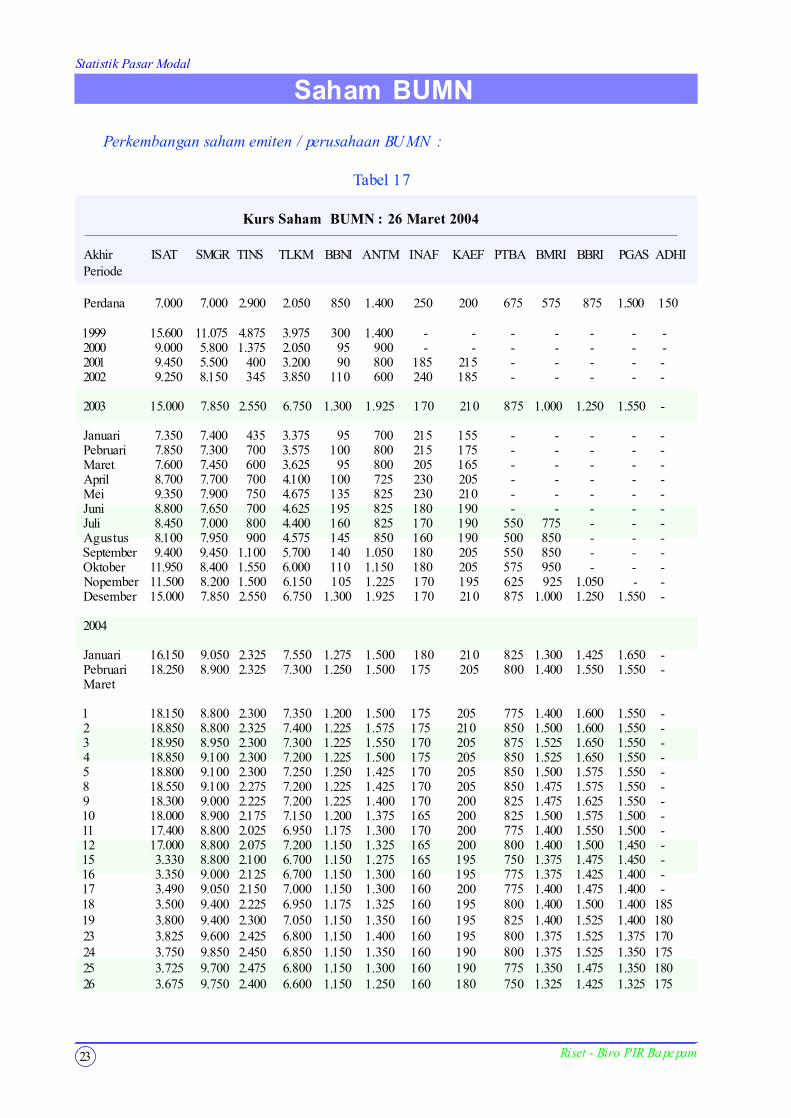
Perkembangan saham emiten / perusahaan BUMN :
Tabel 17
Kurs Saham BUMN : 26 Maret 2004
Akhir ISAT SMGR TINS TLKM BBNI ANTM INAF KAEF PTBA BMRI BBRI PGAS ADHIPeriode
Perdana 7.000 7.000 2.900 2.050 850 1.400 250 200 675 575 875 1.500 150
1999 15.600 11.075 4.875 3.975 300 1.400 - - - - - - -2000 9.000 5.800 1.375 2.050 95 900 - - - - - - -2001 9.450 5.500 400 3.200 90 800 185 215 - - - - -2002 9.250 8.150 345 3.850 110 600 240 185 - - - - -
2003 15.000 7.850 2.550 6.750 1.300 1.925 170 210 875 1.000 1.250 1.550 -
Januari 7.350 7.400 435 3.375 95 700 215 155 - - - - -Pebruari 7.850 7.300 700 3.575 100 800 215 175 - - - - -Maret 7.600 7.450 600 3.625 95 800 205 165 - - - - -April 8.700 7.700 700 4.100 100 725 230 205 - - - - -Mei 9.350 7.900 750 4.675 135 825 230 210 - - - - -Juni 8.800 7.650 700 4.625 195 825 180 190 - - - - -Juli 8.450 7.000 800 4.400 160 825 170 190 550 775 - - -Agustus 8.100 7.950 900 4.575 145 850 160 190 500 850 - - -September 9.400 9.450 1.100 5.700 140 1.050 180 205 550 850 - - -Oktober 11.950 8.400 1.550 6.000 110 1.150 180 205 575 950 - - -Nopember 11.500 8.200 1.500 6.150 105 1.225 170 195 625 925 1.050 - -Desember 15.000 7.850 2.550 6.750 1.300 1.925 170 210 875 1.000 1.250 1.550 -
2004
Januari 16.150 9.050 2.325 7.550 1.275 1.500 180 210 825 1.300 1.425 1.650 -Pebruari 18.250 8.900 2.325 7.300 1.250 1.500 175 205 800 1.400 1.550 1.550 -Maret
1 18.150 8.800 2.300 7.350 1.200 1.500 175 205 775 1.400 1.600 1.550 -2 18.850 8.800 2.325 7.400 1.225 1.575 175 210 850 1.500 1.600 1.550 -3 18.950 8.950 2.300 7.300 1.225 1.550 170 205 875 1.525 1.650 1.550 -4 18.850 9.100 2.300 7.200 1.225 1.500 175 205 850 1.525 1.650 1.550 -5 18.800 9.100 2.300 7.250 1.250 1.425 170 205 850 1.500 1.575 1.550 -8 18.550 9.100 2.275 7.200 1.225 1.425 170 205 850 1.475 1.575 1.550 -9 18.300 9.000 2.225 7.200 1.225 1.400 170 200 825 1.475 1.625 1.550 -10 18.000 8.900 2.175 7.150 1.200 1.375 165 200 825 1.500 1.575 1.500 -11 17.400 8.800 2.025 6.950 1.175 1.300 170 200 775 1.400 1.550 1.500 -12 17.000 8.800 2.075 7.200 1.150 1.325 165 200 800 1.400 1.500 1.450 -15 3.330 8.800 2.100 6.700 1.150 1.275 165 195 750 1.375 1.475 1.450 -16 3.350 9.000 2.125 6.700 1.150 1.300 160 195 775 1.375 1.425 1.400 -17 3.490 9.050 2.150 7.000 1.150 1.300 160 200 775 1.400 1.475 1.400 -18 3.500 9.400 2.225 6.950 1.175 1.325 160 195 800 1.400 1.500 1.400 18519 3.800 9.400 2.300 7.050 1.150 1.350 160 195 825 1.400 1.525 1.400 18023 3.825 9.600 2.425 6.800 1.150 1.400 160 195 800 1.375 1.525 1.375 17024 3.750 9.850 2.450 6.850 1.150 1.350 160 190 800 1.375 1.525 1.350 17525 3.725 9.700 2.475 6.800 1.150 1.300 160 190 775 1.350 1.475 1.350 18026 3.675 9.750 2.400 6.600 1.150 1.250 160 180 750 1.325 1.425 1.325 175
Statistik Pasar Modal
24Riset - Biro PIR Bapepam
Saham BUMN
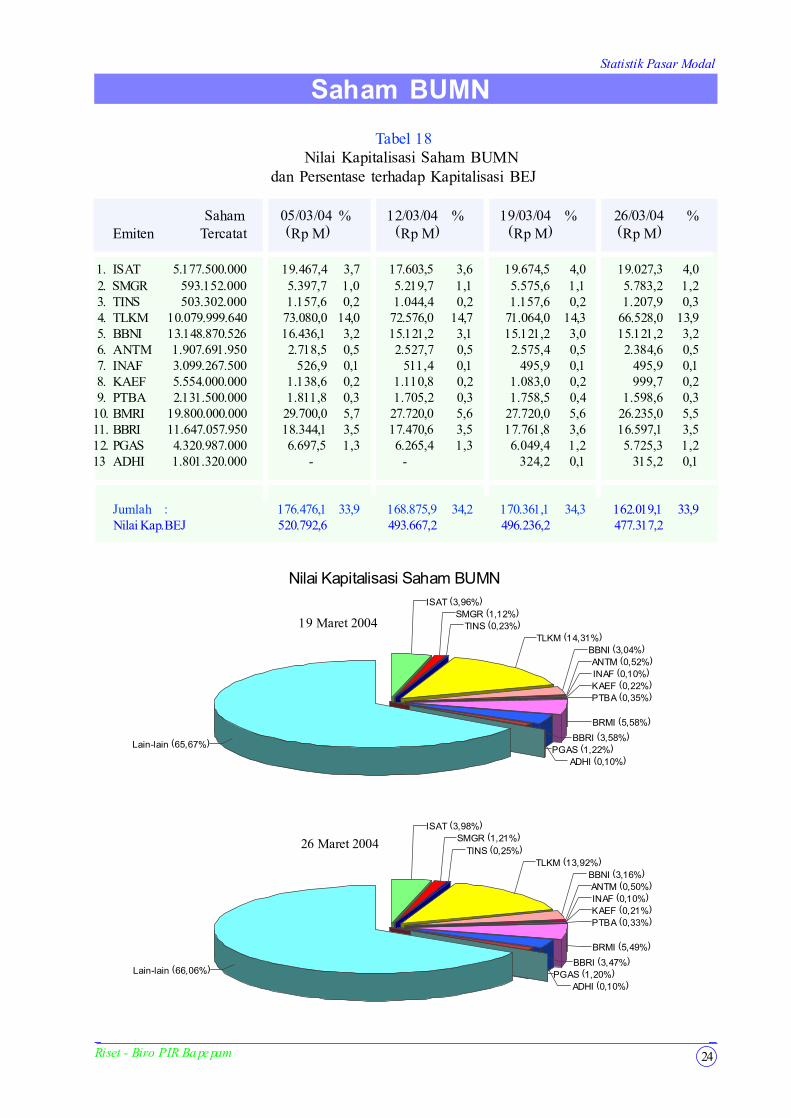
ISAT (3,96%)SMGR (1,12%)
TINS (0,23%)TLKM (14,31%)
BBNI (3,04%)ANTM (0,52%)INAF (0,10%)KAEF (0,22%)PTBA (0,35%)
BRMI (5,58%)
BBRI (3,58%)PGAS (1,22%)
ADHI (0,10%)
Lain-lain (65,67%)
ISAT (3,98%)SMGR (1,21%)
TINS (0,25%)TLKM (13,92%)
BBNI (3,16%)ANTM (0,50%)INAF (0,10%)KAEF (0,21%)PTBA (0,33%)
BRMI (5,49%)
BBRI (3,47%)PGAS (1,20%)
ADHI (0,10%)
Lain-lain (66,06%)
Nilai Kapitalisasi Saham BUMN
26 Maret 2004
19 Maret 2004
Tabel 18 Nilai Kapitalisasi Saham BUMN
dan Persentase terhadap Kapitalisasi BEJ
Saham 05/03/04 % 12/03/04 % 19/03/04 % 26/03/04 %Emiten Tercatat (Rp M) (Rp M) (Rp M) (Rp M)
1. ISAT 5.177.500.000 19.467,4 3,7 17.603,5 3,6 19.674,5 4,0 19.027,3 4,02. SMGR 593.152.000 5.397,7 1,0 5.219,7 1,1 5.575,6 1,1 5.783,2 1,23. TINS 503.302.000 1.157,6 0,2 1.044,4 0,2 1.157,6 0,2 1.207,9 0,34. TLKM 10.079.999.640 73.080,0 14,0 72.576,0 14,7 71.064,0 14,3 66.528,0 13,95. BBNI 13.148.870.526 16.436,1 3,2 15.121,2 3,1 15.121,2 3,0 15.121,2 3,26. ANTM 1.907.691.950 2.718,5 0,5 2.527,7 0,5 2.575,4 0,5 2.384,6 0,57. INAF 3.099.267.500 526,9 0,1 511,4 0,1 495,9 0,1 495,9 0,18. KAEF 5.554.000.000 1.138,6 0,2 1.110,8 0,2 1.083,0 0,2 999,7 0,29. PTBA 2.131.500.000 1.811,8 0,3 1.705,2 0,3 1.758,5 0,4 1.598,6 0,310. BMRI 19.800.000.000 29.700,0 5,7 27.720,0 5,6 27.720,0 5,6 26.235,0 5,511. BBRI 11.647.057.950 18.344,1 3,5 17.470,6 3,5 17.761,8 3,6 16.597,1 3,512. PGAS 4.320.987.000 6.697,5 1,3 6.265,4 1,3 6.049,4 1,2 5.725,3 1,213 ADHI 1.801.320.000 - - 324,2 0,1 315,2 0,1
Jumlah : 176.476,1 33,9 168.875,9 34,2 170.361,1 34,3 162.019,1 33,9Nilai Kap.BEJ 520.792,6 493.667,2 496.236,2 477.317,2
Statistik Pasar Modal
25 Riset - Biro PIR Bapepam
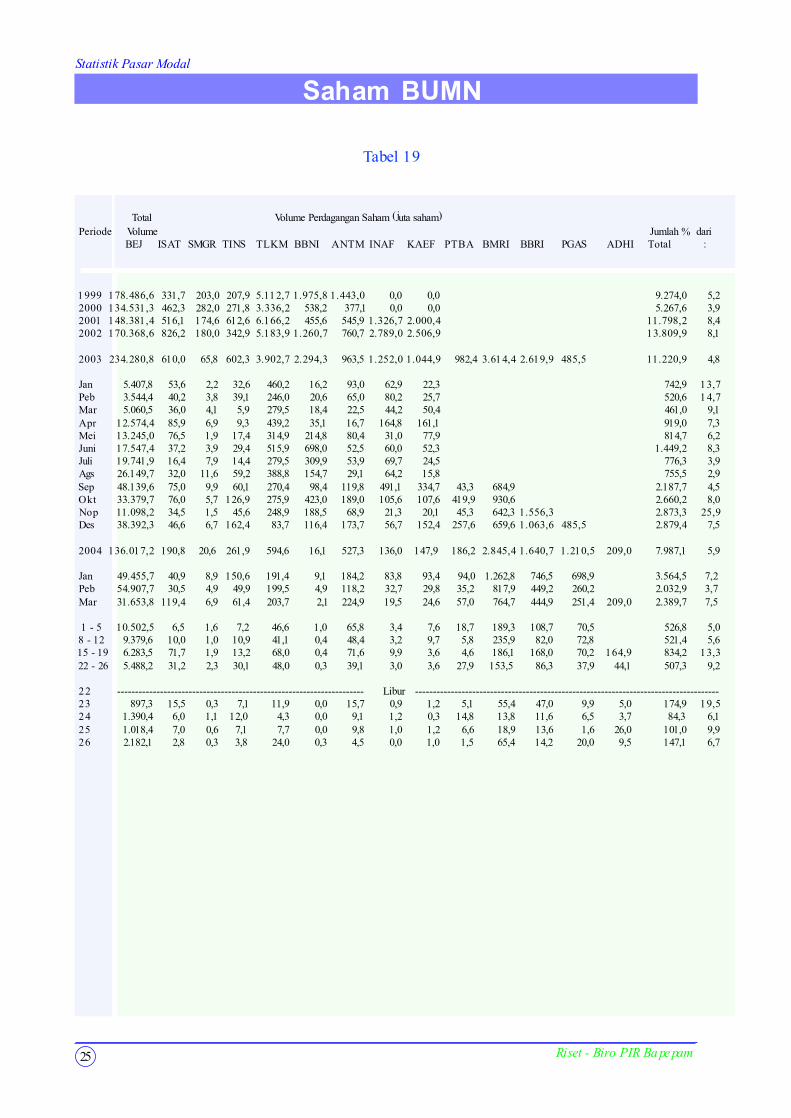
Total Volume Perdagangan Saham (juta saham)Periode Volume Jumlah % dari
BEJ ISAT SMGR TINS TLKM BBNI ANTM INAF KAEF PTBA BMRI BBRI PGAS ADHI Total :
1999 178.486,6 331,7 203,0 207,9 5.112,7 1.975,8 1.443,0 0,0 0,0 9.274,0 5,22000 134.531,3 462,3 282,0 271,8 3.336,2 538,2 377,1 0,0 0,0 5.267,6 3,92001 148.381,4 516,1 174,6 612,6 6.166,2 455,6 545,9 1.326,7 2.000,4 11.798,2 8,42002 170.368,6 826,2 180,0 342,9 5.183,9 1.260,7 760,7 2.789,0 2.506,9 13.809,9 8,1
2003 234.280,8 610,0 65,8 602,3 3.902,7 2.294,3 963,5 1.252,0 1.044,9 982,4 3.614,4 2.619,9 485,5 11.220,9 4,8
Jan 5.407,8 53,6 2,2 32,6 460,2 16,2 93,0 62,9 22,3 742,9 13,7Peb 3.544,4 40,2 3,8 39,1 246,0 20,6 65,0 80,2 25,7 520,6 14,7Mar 5.060,5 36,0 4,1 5,9 279,5 18,4 22,5 44,2 50,4 461,0 9,1Apr 12.574,4 85,9 6,9 9,3 439,2 35,1 16,7 164,8 161,1 919,0 7,3Mei 13.245,0 76,5 1,9 17,4 314,9 214,8 80,4 31,0 77,9 814,7 6,2Juni 17.547,4 37,2 3,9 29,4 515,9 698,0 52,5 60,0 52,3 1.449,2 8,3Juli 19.741,9 16,4 7,9 14,4 279,5 309,9 53,9 69,7 24,5 776,3 3,9Ags 26.149,7 32,0 11,6 59,2 388,8 154,7 29,1 64,2 15,8 755,5 2,9Sep 48.139,6 75,0 9,9 60,1 270,4 98,4 119,8 491,1 334,7 43,3 684,9 2.187,7 4,5Okt 33.379,7 76,0 5,7 126,9 275,9 423,0 189,0 105,6 107,6 419,9 930,6 2.660,2 8,0Nop 11.098,2 34,5 1,5 45,6 248,9 188,5 68,9 21,3 20,1 45,3 642,3 1.556,3 2.873,3 25,9Des 38.392,3 46,6 6,7 162,4 83,7 116,4 173,7 56,7 152,4 257,6 659,6 1.063,6 485,5 2.879,4 7,5
2004 136.017,2 190,8 20,6 261,9 594,6 16,1 527,3 136,0 147,9 186,2 2.845,4 1.640,7 1.210,5 209,0 7.987,1 5,9
Jan 49.455,7 40,9 8,9 150,6 191,4 9,1 184,2 83,8 93,4 94,0 1.262,8 746,5 698,9 3.564,5 7,2Peb 54.907,7 30,5 4,9 49,9 199,5 4,9 118,2 32,7 29,8 35,2 817,9 449,2 260,2 2.032,9 3,7Mar 31.653,8 119,4 6,9 61,4 203,7 2,1 224,9 19,5 24,6 57,0 764,7 444,9 251,4 209,0 2.389,7 7,5
1 - 5 10.502,5 6,5 1,6 7,2 46,6 1,0 65,8 3,4 7,6 18,7 189,3 108,7 70,5 526,8 5,08 - 12 9.379,6 10,0 1,0 10,9 41,1 0,4 48,4 3,2 9,7 5,8 235,9 82,0 72,8 521,4 5,6
15 - 19 6.283,5 71,7 1,9 13,2 68,0 0,4 71,6 9,9 3,6 4,6 186,1 168,0 70,2 164,9 834,2 13,3 22 - 26 5.488,2 31,2 2,3 30,1 48,0 0,3 39,1 3,0 3,6 27,9 153,5 86,3 37,9 44,1 507,3 9,2
22 --------------------------------------------------------------------- Libur -------------------------------------------------------------------------------------23 897,3 15,5 0,3 7,1 11,9 0,0 15,7 0,9 1,2 5,1 55,4 47,0 9,9 5,0 174,9 19,524 1.390,4 6,0 1,1 12,0 4,3 0,0 9,1 1,2 0,3 14,8 13,8 11,6 6,5 3,7 84,3 6,125 1.018,4 7,0 0,6 7,1 7,7 0,0 9,8 1,0 1,2 6,6 18,9 13,6 1,6 26,0 101,0 9,926 2.182,1 2,8 0,3 3,8 24,0 0,3 4,5 0,0 1,0 1,5 65,4 14,2 20,0 9,5 147,1 6,7
Saham BUMN
Tabel 19
Statistik Pasar Modal
26Riset - Biro PIR Bapepam
Saham BUMN
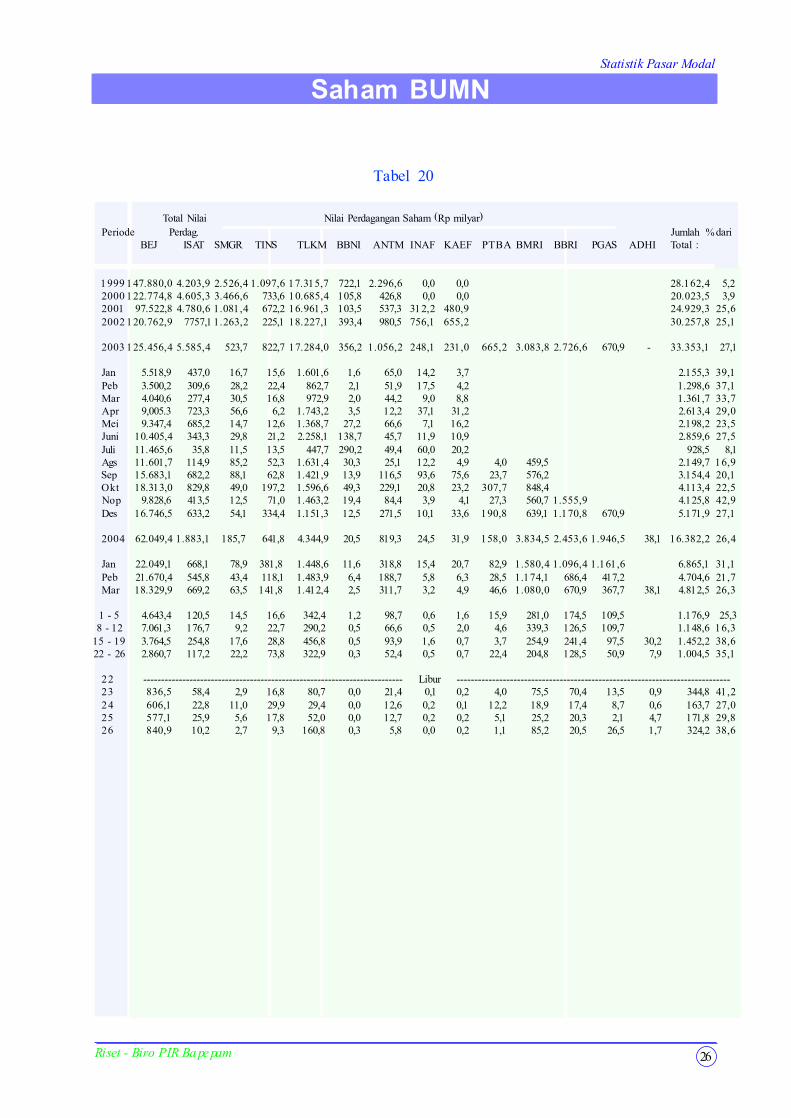
Tabel 20
Total Nilai Nilai Perdagangan Saham (Rp milyar)Periode Perdag. Jumlah %dari
BEJ ISAT SMGR TINS TLKM BBNI ANTM INAF KAEF PTBA BMRI BBRI PGAS ADHI Total :
1999 147.880,0 4.203,9 2.526,4 1.097,6 17.315,7 722,1 2.296,6 0,0 0,0 28.162,4 5,22000 122.774,8 4.605,3 3.466,6 733,6 10.685,4 105,8 426,8 0,0 0,0 20.023,5 3,92001 97.522,8 4.780,6 1.081,4 672,2 16.961,3 103,5 537,3 312,2 480,9 24.929,3 25,62002 120.762,9 7757,1 1.263,2 225,1 18.227,1 393,4 980,5 756,1 655,2 30.257,8 25,1
2003 125.456,4 5.585,4 523,7 822,7 17.284,0 356,2 1.056,2 248,1 231,0 665,2 3.083,8 2.726,6 670,9 - 33.353,1 27,1
Jan 5.518,9 437,0 16,7 15,6 1.601,6 1,6 65,0 14,2 3,7 2.155,3 39,1Peb 3.500,2 309,6 28,2 22,4 862,7 2,1 51,9 17,5 4,2 1.298,6 37,1Mar 4.040,6 277,4 30,5 16,8 972,9 2,0 44,2 9,0 8,8 1.361,7 33,7Apr 9,005.3 723,3 56,6 6,2 1.743,2 3,5 12,2 37,1 31,2 2.613,4 29,0Mei 9.347,4 685,2 14,7 12,6 1.368,7 27,2 66,6 7,1 16,2 2.198,2 23,5Juni 10.405,4 343,3 29,8 21,2 2.258,1 138,7 45,7 11,9 10,9 2.859,6 27,5Juli 11.465,6 35,8 11,5 13,5 447,7 290,2 49,4 60,0 20,2 928,5 8,1Ags 11.601,7 114,9 85,2 52,3 1.631,4 30,3 25,1 12,2 4,9 4,0 459,5 2.149,7 16,9Sep 15.683,1 682,2 88,1 62,8 1.421,9 13,9 116,5 93,6 75,6 23,7 576,2 3.154,4 20,1Okt 18.313,0 829,8 49,0 197,2 1.596,6 49,3 229,1 20,8 23,2 307,7 848,4 4.113,4 22,5Nop 9.828,6 413,5 12,5 71,0 1.463,2 19,4 84,4 3,9 4,1 27,3 560,7 1.555,9 4.125,8 42,9Des 16.746,5 633,2 54,1 334,4 1.151,3 12,5 271,5 10,1 33,6 190,8 639,1 1.170,8 670,9 5.171,9 27,1
2004 62.049,4 1.883,1 185,7 641,8 4.344,9 20,5 819,3 24,5 31,9 158,0 3.834,5 2.453,6 1.946,5 38,1 16.382,2 26,4
Jan 22.049,1 668,1 78,9 381,8 1.448,6 11,6 318,8 15,4 20,7 82,9 1.580,4 1.096,4 1.161,6 6.865,1 31,1Peb 21.670,4 545,8 43,4 118,1 1.483,9 6,4 188,7 5,8 6,3 28,5 1.174,1 686,4 417,2 4.704,6 21,7Mar 18.329,9 669,2 63,5 141,8 1.412,4 2,5 311,7 3,2 4,9 46,6 1.080,0 670,9 367,7 38,1 4.812,5 26,3
1 - 5 4.643,4 120,5 14,5 16,6 342,4 1,2 98,7 0,6 1,6 15,9 281,0 174,5 109,5 1.176,9 25,3 8 - 12 7.061,3 176,7 9,2 22,7 290,2 0,5 66,6 0,5 2,0 4,6 339,3 126,5 109,7 1.148,6 16,315 - 19 3.764,5 254,8 17,6 28,8 456,8 0,5 93,9 1,6 0,7 3,7 254,9 241,4 97,5 30,2 1.452,2 38,622 - 26 2.860,7 117,2 22,2 73,8 322,9 0,3 52,4 0,5 0,7 22,4 204,8 128,5 50,9 7,9 1.004,5 35,1
22 ------------------------------------------------------------------------- Libur -----------------------------------------------------------------------------23 836,5 58,4 2,9 16,8 80,7 0,0 21,4 0,1 0,2 4,0 75,5 70,4 13,5 0,9 344,8 41,224 606,1 22,8 11,0 29,9 29,4 0,0 12,6 0,2 0,1 12,2 18,9 17,4 8,7 0,6 163,7 27,025 577,1 25,9 5,6 17,8 52,0 0,0 12,7 0,2 0,2 5,1 25,2 20,3 2,1 4,7 171,8 29,826 840,9 10,2 2,7 9,3 160,8 0,3 5,8 0,0 0,2 1,1 85,2 20,5 26,5 1,7 324,2 38,6
Statistik Pasar Modal
27 Riset - Biro PIR Bapepam
Saham BUMN
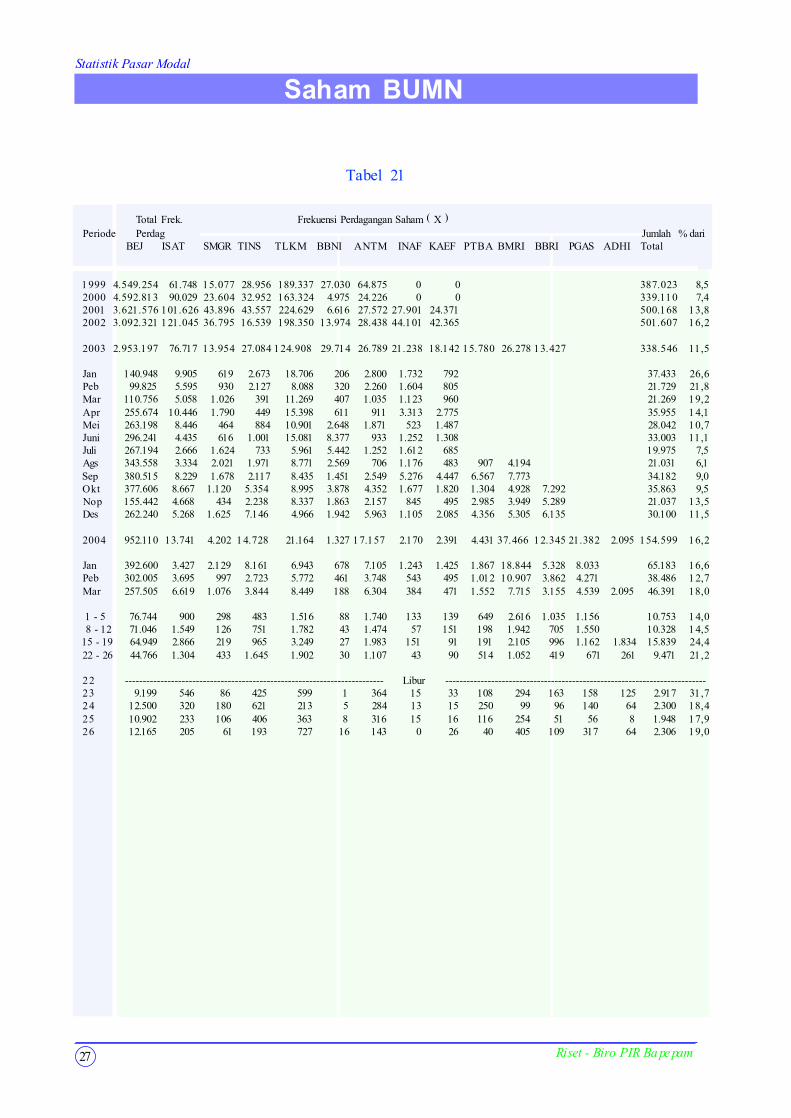
Tabel 21
Total Frek. Frekuensi Perdagangan Saham ( X )Periode Perdag Jumlah % dari
BEJ ISAT SMGR TINS TLKM BBNI ANTM INAF KAEF PTBA BMRI BBRI PGAS ADHI Total
1999 4.549.254 61.748 15.077 28.956 189.337 27.030 64.875 0 0 387.023 8,52000 4.592.813 90.029 23.604 32.952 163.324 4.975 24.226 0 0 339.110 7,42001 3.621.576 101.626 43.896 43.557 224.629 6.616 27.572 27.901 24.371 500.168 13,82002 3.092.321 121.045 36.795 16.539 198.350 13.974 28.438 44.101 42.365 501.607 16,2
2003 2.953.197 76.717 13.954 27.084 124.908 29.714 26.789 21.238 18.142 15.780 26.278 13.427 338.546 11,5
Jan 140.948 9.905 619 2.673 18.706 206 2.800 1.732 792 37.433 26,6Peb 99.825 5.595 930 2.127 8.088 320 2.260 1.604 805 21.729 21,8Mar 110.756 5.058 1.026 391 11.269 407 1.035 1.123 960 21.269 19,2Apr 255.674 10.446 1.790 449 15.398 611 911 3.313 2.775 35.955 14,1Mei 263.198 8.446 464 884 10.901 2.648 1.871 523 1.487 28.042 10,7Juni 296.241 4.435 616 1.001 15.081 8.377 933 1.252 1.308 33.003 11,1Juli 267.194 2.666 1.624 733 5.961 5.442 1.252 1.612 685 19.975 7,5Ags 343.558 3.334 2.021 1.971 8.771 2.569 706 1.176 483 907 4.194 21.031 6,1Sep 380.515 8.229 1.678 2.117 8.435 1.451 2.549 5.276 4.447 6.567 7.773 34.182 9,0Okt 377.606 8.667 1.120 5.354 8.995 3.878 4.352 1.677 1.820 1.304 4.928 7.292 35.863 9,5Nop 155.442 4.668 434 2.238 8.337 1.863 2.157 845 495 2.985 3.949 5.289 21.037 13,5Des 262.240 5.268 1.625 7.146 4.966 1.942 5.963 1.105 2.085 4.356 5.305 6.135 30.100 11,5
2004 952.110 13.741 4.202 14.728 21.164 1.327 17.157 2.170 2.391 4.431 37.466 12.345 21.382 2.095 154.599 16,2
Jan 392.600 3.427 2.129 8.161 6.943 678 7.105 1.243 1.425 1.867 18.844 5.328 8.033 65.183 16,6Peb 302.005 3.695 997 2.723 5.772 461 3.748 543 495 1.012 10.907 3.862 4.271 38.486 12,7Mar 257.505 6.619 1.076 3.844 8.449 188 6.304 384 471 1.552 7.715 3.155 4.539 2.095 46.391 18,0
1 - 5 76.744 900 298 483 1.516 88 1.740 133 139 649 2.616 1.035 1.156 10.753 14,0 8 - 12 71.046 1.549 126 751 1.782 43 1.474 57 151 198 1.942 705 1.550 10.328 14,515 - 19 64.949 2.866 219 965 3.249 27 1.983 151 91 191 2.105 996 1.162 1.834 15.839 24,422 - 26 44.766 1.304 433 1.645 1.902 30 1.107 43 90 514 1.052 419 671 261 9.471 21,2
22 ------------------------------------------------------------------------- Libur --------------------------------------------------------------------------23 9.199 546 86 425 599 1 364 15 33 108 294 163 158 125 2.917 31,724 12.500 320 180 621 213 5 284 13 15 250 99 96 140 64 2.300 18,425 10.902 233 106 406 363 8 316 15 16 116 254 51 56 8 1.948 17,926 12.165 205 61 193 727 16 143 0 26 40 405 109 317 64 2.306 19,0
Statistik Pasar Modal
28Riset - Biro PIR Bapepam
Saham BUMN
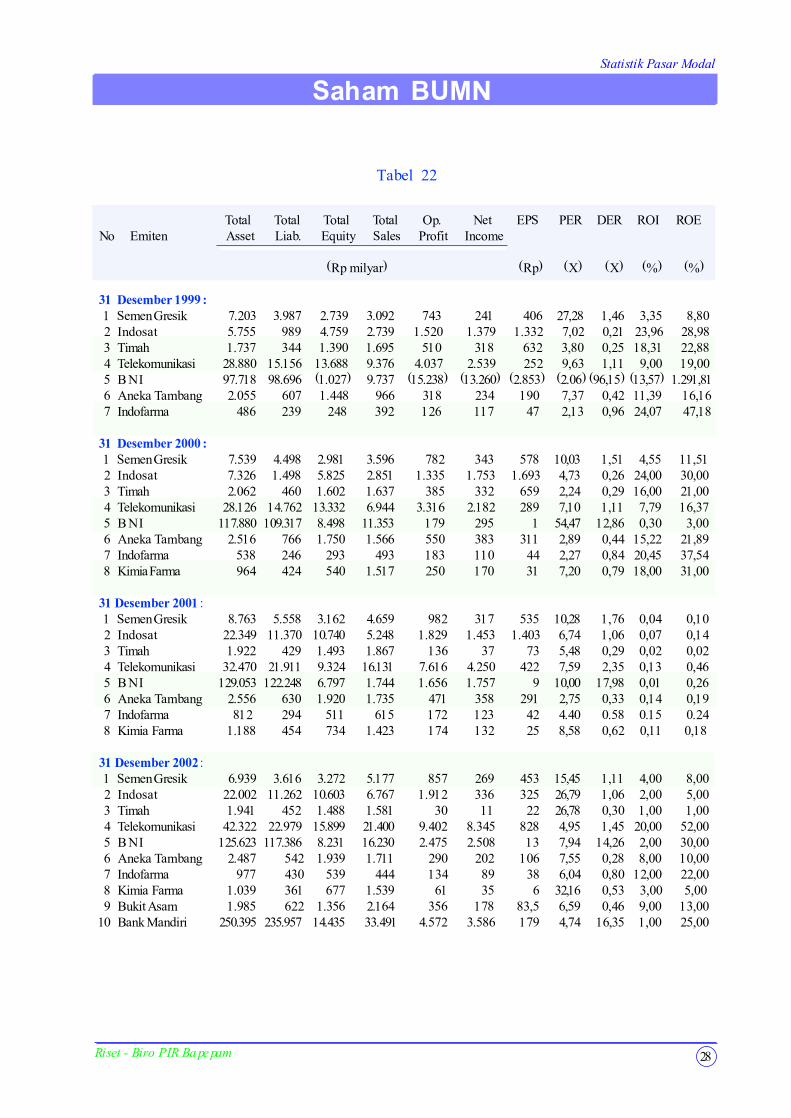
Tabel 22
Total Total Total Total Op. Net EPS PER DER ROI ROENo Emiten Asset Liab. Equity Sales Profit Income
(Rp milyar) (Rp) (X) (X) (%) (%)
31 Desember 1999 : 1 Semen Gresik 7.203 3.987 2.739 3.092 743 241 406 27,28 1,46 3,35 8,80 2 Indosat 5.755 989 4.759 2.739 1.520 1.379 1.332 7,02 0,21 23,96 28,98 3 Timah 1.737 344 1.390 1.695 510 318 632 3,80 0,25 18,31 22,88 4 Telekomunikasi 28.880 15.156 13.688 9.376 4.037 2.539 252 9,63 1,11 9,00 19,00 5 B N I 97.718 98.696 (1.027) 9.737 (15.238) (13.260) (2.853) (2.06) (96,15) (13,57) 1.291,81 6 Aneka Tambang 2.055 607 1.448 966 318 234 190 7,37 0,42 11,39 16,16 7 Indofarma 486 239 248 392 126 117 47 2,13 0,96 24,07 47,18
31 Desember 2000 : 1 Semen Gresik 7.539 4.498 2.981 3.596 782 343 578 10,03 1,51 4,55 11,51 2 Indosat 7.326 1.498 5.825 2.851 1.335 1.753 1.693 4,73 0,26 24,00 30,00 3 Timah 2.062 460 1.602 1.637 385 332 659 2,24 0,29 16,00 21,00 4 Telekomunikasi 28.126 14.762 13.332 6.944 3.316 2.182 289 7,10 1,11 7,79 16,37 5 B N I 117.880 109.317 8.498 11.353 179 295 1 54,47 12,86 0,30 3,00 6 Aneka Tambang 2.516 766 1.750 1.566 550 383 311 2,89 0,44 15,22 21,89 7 Indofarma 538 246 293 493 183 110 44 2,27 0,84 20,45 37,54 8 Kimia Farma 964 424 540 1.517 250 170 31 7,20 0,79 18,00 31,00
31 Desember 2001 : 1 Semen Gresik 8.763 5.558 3.162 4.659 982 317 535 10,28 1,76 0,04 0,10 2 Indosat 22.349 11.370 10.740 5.248 1.829 1.453 1.403 6,74 1,06 0,07 0,14 3 Timah 1.922 429 1.493 1.867 136 37 73 5,48 0,29 0,02 0,02 4 Telekomunikasi 32.470 21.911 9.324 16.131 7.616 4.250 422 7,59 2,35 0,13 0,46 5 B N I 129.053 122.248 6.797 1.744 1.656 1.757 9 10,00 17,98 0,01 0,26 6 Aneka Tambang 2.556 630 1.920 1.735 471 358 291 2,75 0,33 0,14 0,19 7 Indofarma 812 294 511 615 172 123 42 4.40 0.58 0.15 0.24 8 Kimia Farma 1.188 454 734 1.423 174 132 25 8,58 0,62 0,11 0,18
31 Desember 2002 : 1 Semen Gresik 6.939 3.616 3.272 5.177 857 269 453 15,45 1,11 4,00 8,00 2 Indosat 22.002 11.262 10.603 6.767 1.912 336 325 26,79 1,06 2,00 5,00 3 Timah 1.941 452 1.488 1.581 30 11 22 26,78 0,30 1,00 1,00 4 Telekomunikasi 42.322 22.979 15.899 21.400 9.402 8.345 828 4,95 1,45 20,00 52,00 5 B N I 125.623 117.386 8.231 16.230 2.475 2.508 13 7,94 14,26 2,00 30,00 6 Aneka Tambang 2.487 542 1.939 1.711 290 202 106 7,55 0,28 8,00 10,00 7 Indofarma 977 430 539 444 134 89 38 6,04 0,80 12,00 22,00 8 Kimia Farma 1.039 361 677 1.539 61 35 6 32,16 0,53 3,00 5,00 9 Bukit Asam 1.985 622 1.356 2.164 356 178 83,5 6,59 0,46 9,00 13,0010 Bank Mandiri 250.395 235.957 14.435 33.491 4.572 3.586 179 4,74 16,35 1,00 25,00
Statistik Pasar Modal
29 Riset - Biro PIR Bapepam
Reksa Dana
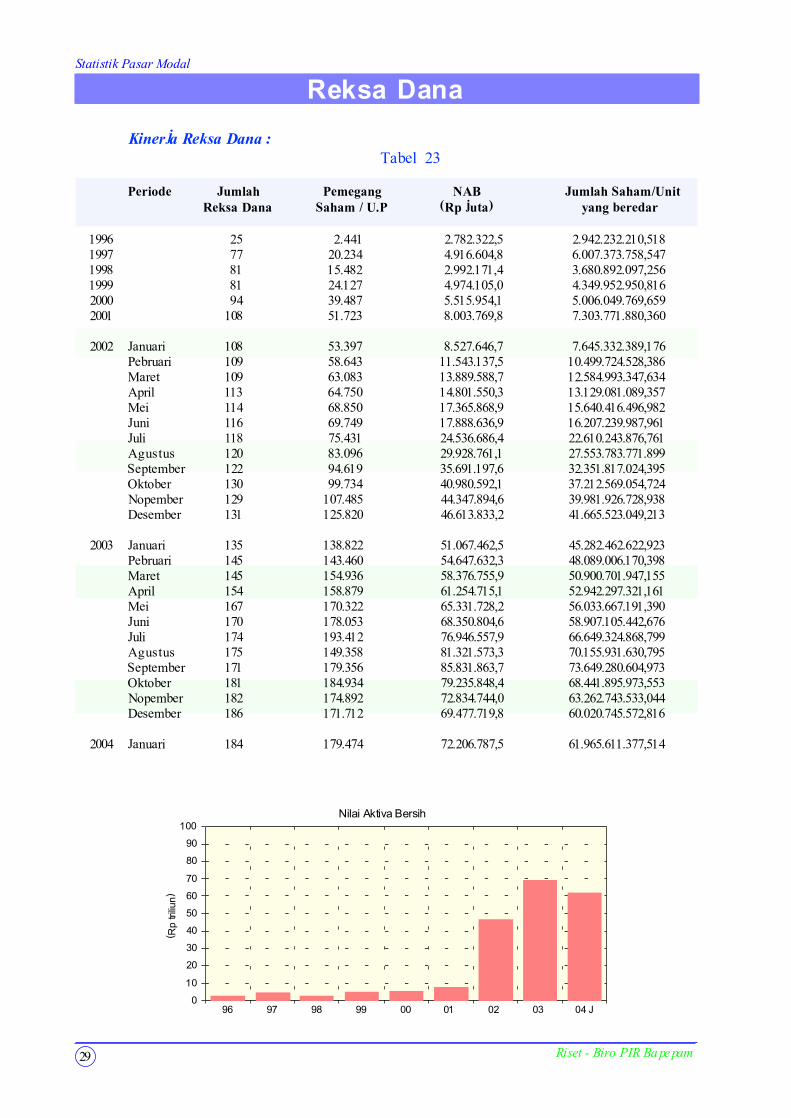
Kinerja Reksa Dana :Tabel 23
Periode Jumlah Pemegang NAB Jumlah Saham/UnitReksa Dana Saham / U.P (Rp juta) yang beredar
1996 25 2.441 2.782.322,5 2.942.232.210,5181997 77 20.234 4.916.604,8 6.007.373.758,5471998 81 15.482 2.992.171,4 3.680.892.097,2561999 81 24.127 4.974.105,0 4.349.952.950,8162000 94 39.487 5.515.954,1 5.006.049.769,6592001 108 51.723 8.003.769,8 7.303.771.880,360
2002 Januari 108 53.397 8.527.646,7 7.645.332.389,176Pebruari 109 58.643 11.543.137,5 10.499.724.528,386Maret 109 63.083 13.889.588,7 12.584.993.347,634April 113 64.750 14.801.550,3 13.129.081.089,357Mei 114 68.850 17.365.868,9 15.640.416.496,982Juni 116 69.749 17.888.636,9 16.207.239.987,961Juli 118 75.431 24.536.686,4 22.610.243.876,761Agustus 120 83.096 29.928.761,1 27.553.783.771.899September 122 94.619 35.691.197,6 32.351.817.024,395Oktober 130 99.734 40.980.592,1 37.212.569.054,724Nopember 129 107.485 44.347.894,6 39.981.926.728,938Desember 131 125.820 46.613.833,2 41.665.523.049,213
2003 Januari 135 138.822 51.067.462,5 45.282.462.622,923Pebruari 145 143.460 54.647.632,3 48.089.006.170,398Maret 145 154.936 58.376.755,9 50.900.701.947,155April 154 158.879 61.254.715,1 52.942.297.321,161Mei 167 170.322 65.331.728,2 56.033.667.191,390Juni 170 178.053 68.350.804,6 58.907.105.442,676Juli 174 193.412 76.946.557,9 66.649.324.868,799Agustus 175 149.358 81.321.573,3 70.155.931.630,795September 171 179.356 85.831.863,7 73.649.280.604,973Oktober 181 184.934 79.235.848,4 68.441.895.973,553Nopember 182 174.892 72.834.744,0 63.262.743.533,044Desember 186 171.712 69.477.719,8 60.020.745.572,816
2004 Januari 184 179.474 72.206.787,5 61.965.611.377,514
0
10
20
30
40
50
60
70
80
90
100
(Rp tr
iliun)
96 97 98 99 00 01 02 03 04 J
Nilai Aktiva Bersih
Statistik Pasar Modal
30Riset - Biro PIR Bapepam
0
1
2
3
4
5
Pem
od
al (
juta
)
94 95 96 97 98 99 00 01 02
Domestik
Asing
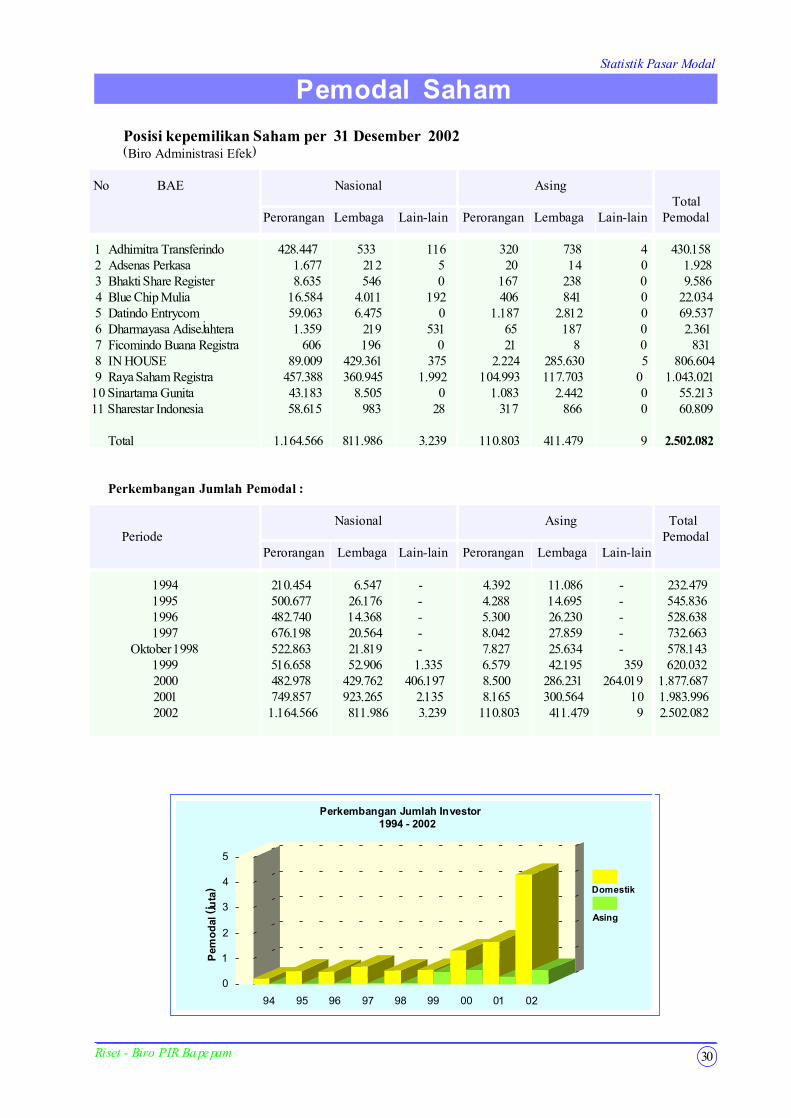
Perkembangan Jumlah Investor1994 - 2002
Posisi kepemilikan Saham per 31 Desember 2002(Biro Administrasi Efek)
No BAE Nasional Asing Total
Perorangan Lembaga Lain-lain Perorangan Lembaga Lain-lain Pemodal
1 Adhimitra Transferindo 428.447 533 116 320 738 4 430.158 2 Adsenas Perkasa 1.677 212 5 20 14 0 1.928 3 Bhakti Share Register 8.635 546 0 167 238 0 9.586 4 Blue Chip Mulia 16.584 4.011 192 406 841 0 22.034 5 Datindo Entrycom 59.063 6.475 0 1.187 2.812 0 69.537 6 Dharmayasa Adisejahtera 1.359 219 531 65 187 0 2.361 7 Ficomindo Buana Registra 606 196 0 21 8 0 831 8 IN HOUSE 89.009 429.361 375 2.224 285.630 5 806.604 9 Raya Saham Registra 457.388 360.945 1.992 104.993 117.703 0 1.043.021 10 Sinartama Gunita 43.183 8.505 0 1.083 2.442 0 55.213 11 Sharestar Indonesia 58.615 983 28 317 866 0 60.809
Total 1.164.566 811.986 3.239 110.803 411.479 9 2.502.082
Perkembangan Jumlah Pemodal :
Nasional Asing Total Periode Pemodal
Perorangan Lembaga Lain-lain Perorangan Lembaga Lain-lain
1994 210.454 6.547 - 4.392 11.086 - 232.4791995 500.677 26.176 - 4.288 14.695 - 545.8361996 482.740 14.368 - 5.300 26.230 - 528.6381997 676.198 20.564 - 8.042 27.859 - 732.663
Oktober 1998 522.863 21.819 - 7.827 25.634 - 578.1431999 516.658 52.906 1.335 6.579 42.195 359 620.0322000 482.978 429.762 406.197 8.500 286.231 264.019 1.877.6872001 749.857 923.265 2.135 8.165 300.564 10 1.983.9962002 1.164.566 811.986 3.239 110.803 411.479 9 2.502.082
Pemodal Saham
Statistik Pasar Modal
No Lembaga / Profesi Peb Mar Apr Mei Jun Jul Agt Sep Okt Nov Des Jan Peb
1 Bursa Efek 2 2 2 2 2 2 2 2 2 2 2 2 2 2 LKP : KPEI 1 1 1 1 1 1 1 1 1 1 1 1 1 3 LPP : KSEI 1 1 1 1 1 1 1 1 1 1 1 1 1 4 Kustodian 20 20 20 20 20 20 20 20 20 20 19 19 19 5 BAE 12 12 12 12 12 12 12 12 12 12 12 12 12
6 Perusahaan Efek 196 194 194 193 193 193 193 191 191 191 192 192 191* PPE (Nasional) 78 78 78 77 77 77 77 76 76 75 77 77 77* PPE (Patungan) 2 2 2 2 2 2 2 2 2 2 2 2 2* PEE (Nasional) 9 9 9 9 9 9 9 9 9 9 9 9 9* PEE (Patungan) 5 5 5 6 5 5 5 5 5 5 5 5 4* PPE/PEE (Nasional) 78 77 77 77 77 77 77 76 76 77 76 76 76* PPE/PEE (Patungan) 23 23 23 23 23 23 23 23 23 23 23 23 23* MI 90 91 91 91 91 93 94 95 97 96 98 98 101* MI (Nasional) 69 70 71 70 70 72 72 73 75 75 76 76 79* MI (Patungan) 21 21 21 21 23 21 22 22 22 21 22 22 22
7 Wakil OrangPerseorangan : 8.343 8.418 8.461 8.487 8.747 8.805 8.862 8.944 9.250 9.808 9.903 10.104 10.375
* WPPE 3.411 3.417 3.424 3.429 3.434 3.436 3.441 3.444 3.454 3.461 3.461 3.462 3.463* WPEE 1.370 1.376 1.378 1.381 1.386 1.390 1.392 1.394 1.396 1.401 1.403 1.410 1.410* WMI 1.107 1.157 1.167 1.171 1.183 1.209 1.225 1.229 1.231 1.232 1.241 1.250 1.253* WAPRD 2.455 2.468 2.492 2.506 2.744 2.770 2.804 2.877 3.169 3.614 3.798 3.982 4.249
8 Lembaga Rating /Penasehat 5 5 5 5 5 5 5 5 5 5 5 5 5* Pemeringkat 2 2 2 2 2 2 2 2 2 2 2 2 2* PI Perorangam 2 2 2 2 2 2 2 2 2 2 2 2 2* PI Perusahaan 1 1 1 1 1 1 1 1 1 1 1 1 1
9 Wali Amanat 13 13 13 13 14 13 13 13 13 13 13 13 1310 Penilai 102 105 105 105 106 106 106 106 106 107 107 107 10811 Notaris 592 594 594 594 612 631 644 660 660 662 679 679 67912 Konsultan Hukum
* Partner 476 477 488 493 501 511 511 511 511 511 511 511 511* Kantor 227 228 232 234 255 244 244 244 244 244 244 244 244
13 Akuntan Publik* Partner 292 300 301 302 302 307 315 323 327 330 330 325 331* Kantor 177 178 178 179 179 185 191 194 195 196 197 192 194
14 Lain-lain* LPPM 7 7 7 7 7 7 7 7 5 5 5 5 5* Standard Profesi 1 1 1 1 1 1 1 1 1 1 1 1 1
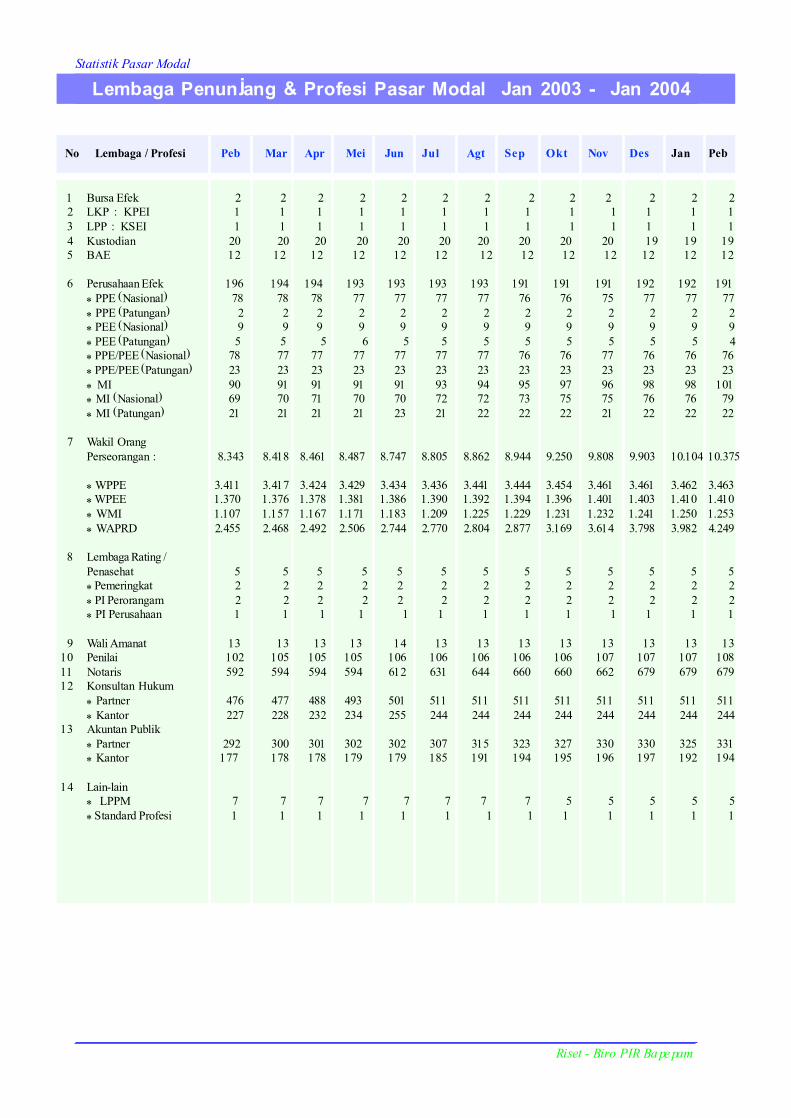
Lembaga Penunjang & Profesi Pasar Modal Jan 2003 - Jan 2004
Riset - Biro PIR Bapepam