sensor simulations
TRANSCRIPT
Innovative Systems Design and Engineering www.iiste.org
ISSN 2222-1727 (Paper) ISSN 2222-2871 (Online)
Vol.5, No.8, 2014
9
Air Pollution Monitoring System based on Wireless Networks -
Simulation
Godbless Swagarya1, Shubi Kaijage
2 , Ramadhani S. Sinde
3
Electronics and Telecommunication department, Nelson MandelaAfrican Institution of Science and Technology,
P.O Box 447, Arusha, Tanzania.
E-mail1: [email protected]
E-mail2: shubi.kaijage @nm-aist.ac.tz
E-mail3: ramadhani.sinde @nm-aist.ac.tz
Abstract
Air pollution is one of environmental issues that cannot be ignored. Industrial growth and urbanization results in
the air pollutants concentrations in many areas. These pollutants can cause damages in human health and other
living organisms. The available pollutant emission monitoring systems, such as Opsis, Codel, Urac and TAS-Air
metrics are typically expensive. In addition, these systems have limitations to be installed on chimney due to
their principle of operation. This causes other areas surrounding the factories being unmonitored and hence cause
healthy issues. This paper proposes an industrial air pollution monitoring system based on the technology of
wireless sensor networks (WSNs). This system is integrated with the global system for mobile communications
(GSM) and its communication protocol used is zigbee. The system consists of sensor nodes, a control center and
data base through which sensing data can be stored for history and future plans. The proposed system can be
deployed to the industries for monitoring carbon monoxide (CO), sulfur dioxide (SO2) and dust concentration
caused by industrial emissions due to process.
Keywords: Zigbee, wireless sensor network, air pollution, GSM, network topology.
1. INTRODUCTION
With the fast development of the industrialization and urbanization process in the world, environmental pollution
is now a common problem in most of the countries. Environmental pollution includes; air pollution, water
pollution and soil pollution. Air pollution can be defined as the presence of contaminants or pollutant substances
in the air that interfere with human health or welfare, or produce other harmful environmental effects [1]. These
pollutant substances usually result from vehicle emissions, Industrial emissions and volatile organic compounds
.The health issues caused by air pollutants are difficulty in breathing, coughing and aggravation of existing
respiratory and cardiac conditions. The World Health Organization states that 2.4 million people die each year
from causes directly attributable to air pollution, with 1.5 million of these deaths attributable to indoor air
pollution [2]. Based on the fact mentioned above, there is a need to focus on air pollution monitoring activities.
Due to the rapid development of communication technology, network technology and remote sensing technology,
there is a trend that air pollution monitoring system is often designed in wireless mode [3]. Wireless Sensor
Network (WSN) have been rapidly developed during recent years. Starting from military to industrial controls
and its advantages include the liability, simplicity, and low cost. The (WSNs) are a kind of self-configuring
networks which consist of large numbers of low-cost, low-power, multi-functional wireless sensors nodes. These
wireless sensor nodes, which are small in size, are capable of sensing and reacting to specific physical or
environmental conditions, such as temperature, sound, pressure, speed, humidity, and so on. These sensor nodes
have the wireless communication ability in short distances and pass their data through the network to their
desired locations. In a WSN, the position of wireless sensor nodes need not to be pre-determined, this is because,
a wireless sensor node may join in or leave the network very quickly and unpredictably [4]. WSN provides a
bridge between the real physical and virtual worlds. It has the ability to observe the places where it is difficult to
fix the wired system and at terrestrial environments at a fine resolution over large scales. Its characteristics give
the WSN a wide range of applications, such as industrial automation, agricultural monitoring, air pollution
monitoring, health care, security systems, etc.
2. RELATED WORK
A number of air quality monitoring systems have been developed by researchers. For instance, In 2008,
Innovative Systems Design and Engineering www.iiste.org
ISSN 2222-1727 (Paper) ISSN 2222-2871 (Online)
Vol.5, No.8, 2014
10
Völgyesi, P. et al introduced a Mobile Air Quality Monitoring Network (MAQUMON) that utilized moving
vehicles equipped with sensor nodes to monitor air quality in a large area [5]. Each sensor node consisted of a
microcontroller, an on-board Global Positioning System (GPS) unit, and a set of sensors to detect the
concentrations of ozone (O3), Carbon Monoxide (CO), and nitrogen dioxide (NO2). The node was able to send
the sensed data to the gateway in a car through the Bluetooth connection. When the car move, the sensor node
detects the concentrations every minute and store the data tagged with location information into a memory.
When the car moves to a Wi-Fi hotspot, the gateway in the car transmits the data to the server, and the data
would be processed and published on the sensor Map portal. MAQUMON provides a record regarding air
quality and pollutant dispersion within the area. But this monitoring system could not immediately send the
monitoring data back.
Kavi K. Khedo, at el [6] proposed an innovative system named Wireless Sensor Network Air Pollution
Monitoring System (WAPMS) to monitor air pollution in Mauritius through the use of wireless sensors deployed
in huge numbers around the island. In order to improve the efficiency of WAPMS, they designed and
implemented a data aggregation algorithm named Recursive Converging Quartiles (RCQ). The algorithm is used
to merge data to eliminate duplicates, filter out invalid readings and summarize them into a simpler form which
significantly reduce the amount of data to be transmitted to the sink and thus saving energy. For better power
management they used a hierarchical routing protocol which causes the nodes to sleep during idle time.
North, R., et al developed An integrated mobile environmental sensing system [7] to support the management of
transport and urban air quality. Sensor nodes are deployed on vehicles and infrastructure to monitor traffic,
weather and pollutant concentrations at far higher spatial and temporal resolutions and send data into a
dynamically configurable computing platform that supports both near real-time incident management and longer
term strategic planning decisions.
The work done by Jelicic et al. [8] introduces an Indoor Air Quality monitoring (IAQ) system using a sensor
network that integrates a power management approach to reduce sensors energy consumption by using an
adaptive duty cycling mechanism for metal oxide semiconductor (MOX) gas sensors.
The work done by Liu et al. [9] proposes a Wireless Sensor Network (WSN)-based urban air quality monitoring
system that is connected to a GSM system for centralized control by a LabVIEW program that stores sensed data
in a database. They implemented the monitoring systems in the city road of Taipei to monitor the carbon
monoxide (CO) concentration caused by vehicle emissions.
3. NETWORK TOPOLOGY
The network is composed of many nodes which are interacting with each other by transmitting and receiving
data over communication channels. In this paper, the network protocol which we are using for communication is
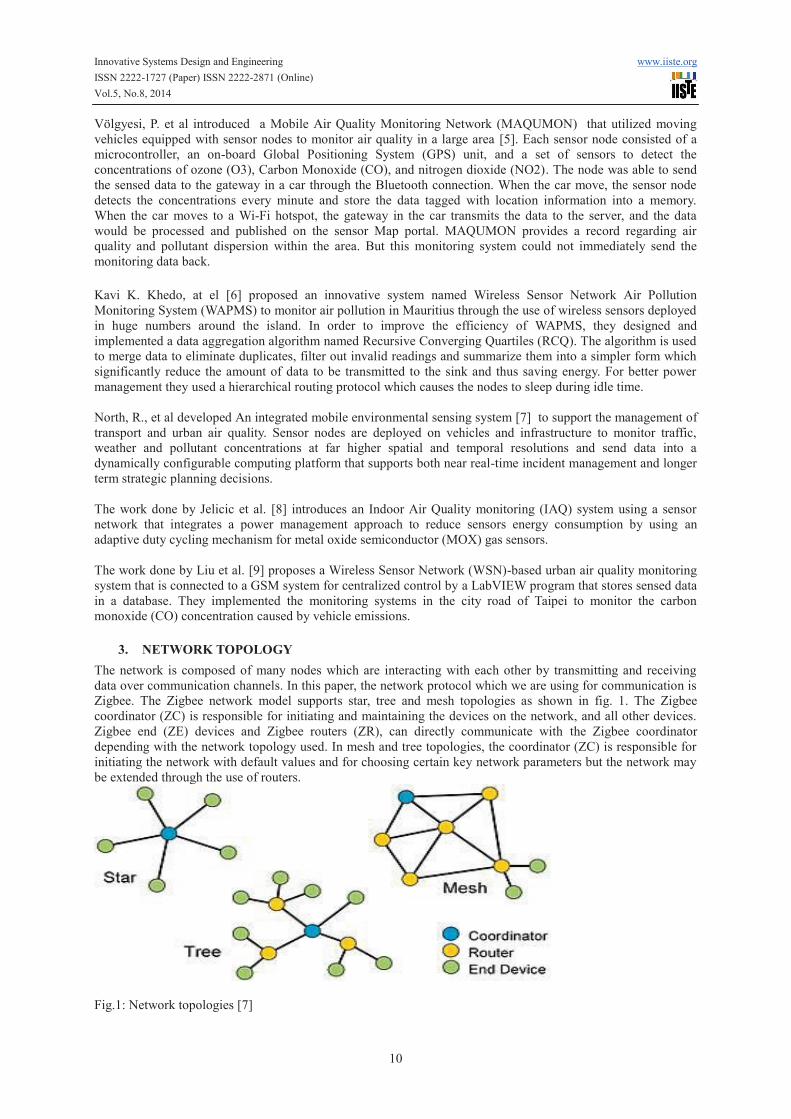
Zigbee. The Zigbee network model supports star, tree and mesh topologies as shown in fig. 1. The Zigbee
coordinator (ZC) is responsible for initiating and maintaining the devices on the network, and all other devices.
Zigbee end (ZE) devices and Zigbee routers (ZR), can directly communicate with the Zigbee coordinator
depending with the network topology used. In mesh and tree topologies, the coordinator (ZC) is responsible for
initiating the network with default values and for choosing certain key network parameters but the network may
be extended through the use of routers.
Fig.1: Network topologies [7]
Innovative Systems Design and Engineering www.iiste.org
ISSN 2222-1727 (Paper) ISSN 2222-2871 (Online)
Vol.5, No.8, 2014
11
In Star topology, all the devices of network are connected to the central device which may be a hub, a router or a
switch. All the workstations are connected to central device with a point-to-point connection. So it can be said
that every node is indirectly connected to every other node by the help of ‘hub’. All the data on the star topology
passes through the central device before reaching the intended destination. Hub acts as a junction to connect
different nodes present in Star Network, and at the same time it manages and controls the whole network.
Depending on which central device is used, hub can act as repeater or signal booster. Central device can also
communicate with other hubs of different network.
The Tree topology is a generalization of the Bus topology. A tree topology combines characteristics of linear bus
and star topologies. It consists of groups of star-configured workstations connected to a linear bus backbone
cable. Tree topologies allow for the expansion of an existing network.
In a mesh topology, any device is allowed to attempt to contact any other device either directly or by taking
advantage of routing-capable devices to relay the message on behalf of the message originator. In this topology,
the route from the source device to the destination is created on demand and can be modified if the environment
changes. The capability of a mesh network to create and modify routes dynamically increases the reliability of
the wireless connections. Incase, for any reason, the source device cannot communicate with the destination
device using a previously established route, the routing capable devices in the network can cooperate to find an
alternative path from the source device to the destination device [10]
4. ZIGBEE STANDARD
A Zigbee standard is a short range, low power, and low data rate wireless networking technology for many real
time application. It specifies the three bottom layers (Physical, Data Link, and Network), as well as an
Application Programming Interface (API) based on the 7-layer OSI (Open System Interconnection) model for
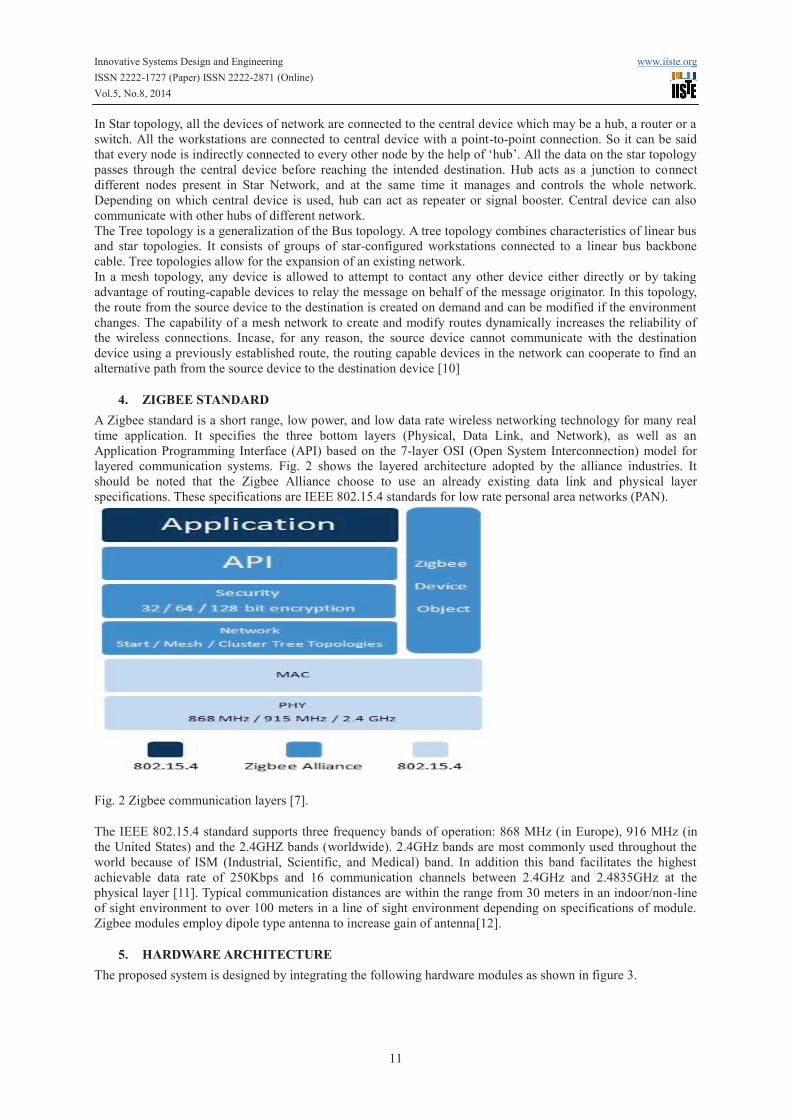
layered communication systems. Fig. 2 shows the layered architecture adopted by the alliance industries. It
should be noted that the Zigbee Alliance choose to use an already existing data link and physical layer
specifications. These specifications are IEEE 802.15.4 standards for low rate personal area networks (PAN).
Fig. 2 Zigbee communication layers [7].
The IEEE 802.15.4 standard supports three frequency bands of operation: 868 MHz (in Europe), 916 MHz (in
the United States) and the 2.4GHZ bands (worldwide). 2.4GHz bands are most commonly used throughout the
world because of ISM (Industrial, Scientific, and Medical) band. In addition this band facilitates the highest
achievable data rate of 250Kbps and 16 communication channels between 2.4GHz and 2.4835GHz at the
physical layer [11]. Typical communication distances are within the range from 30 meters in an indoor/non-line
of sight environment to over 100 meters in a line of sight environment depending on specifications of module.
Zigbee modules employ dipole type antenna to increase gain of antenna[12].
5. HARDWARE ARCHITECTURE
The proposed system is designed by integrating the following hardware modules as shown in figure 3.
Innovative Systems Design and Engineering www.iiste.org
ISSN 2222-1727 (Paper) ISSN 2222-2871 (Online)
Vol.5, No.8, 2014
12
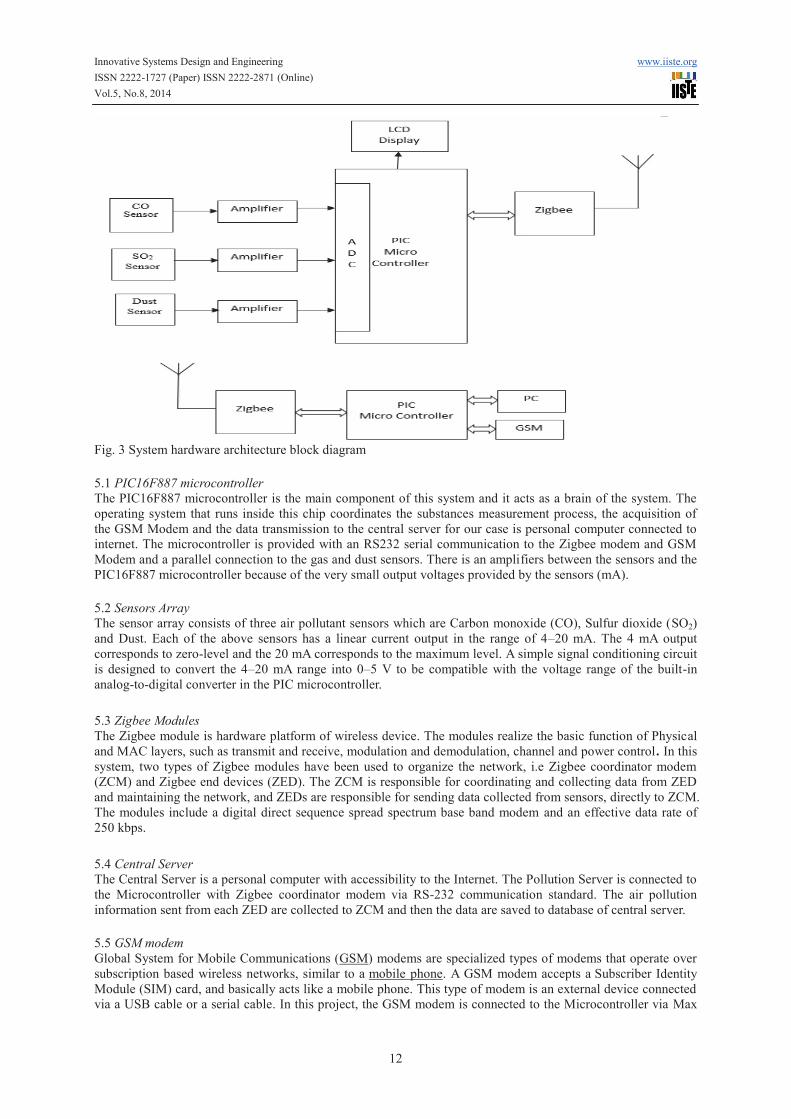
Fig. 3 System hardware architecture block diagram
5.1 PIC16F887 microcontroller
The PIC16F887 microcontroller is the main component of this system and it acts as a brain of the system. The
operating system that runs inside this chip coordinates the substances measurement process, the acquisition of
the GSM Modem and the data transmission to the central server for our case is personal computer connected to
internet. The microcontroller is provided with an RS232 serial communication to the Zigbee modem and GSM
Modem and a parallel connection to the gas and dust sensors. There is an amplifiers between the sensors and the
PIC16F887 microcontroller because of the very small output voltages provided by the sensors (mA).
5.2 Sensors Array
The sensor array consists of three air pollutant sensors which are Carbon monoxide (CO), Sulfur dioxide (SO2)
and Dust. Each of the above sensors has a linear current output in the range of 4–20 mA. The 4 mA output
corresponds to zero-level and the 20 mA corresponds to the maximum level. A simple signal conditioning circuit
is designed to convert the 4–20 mA range into 0–5 V to be compatible with the voltage range of the built-in
analog-to-digital converter in the PIC microcontroller.
5.3 Zigbee Modules
The Zigbee module is hardware platform of wireless device. The modules realize the basic function of Physical
and MAC layers, such as transmit and receive, modulation and demodulation, channel and power control. In this
system, two types of Zigbee modules have been used to organize the network, i.e Zigbee coordinator modem
(ZCM) and Zigbee end devices (ZED). The ZCM is responsible for coordinating and collecting data from ZED
and maintaining the network, and ZEDs are responsible for sending data collected from sensors, directly to ZCM.
The modules include a digital direct sequence spread spectrum base band modem and an effective data rate of
250 kbps.
5.4 Central Server
The Central Server is a personal computer with accessibility to the Internet. The Pollution Server is connected to
the Microcontroller with Zigbee coordinator modem via RS-232 communication standard. The air pollution
information sent from each ZED are collected to ZCM and then the data are saved to database of central server.
5.5 GSM modem
Global System for Mobile Communications (GSM) modems are specialized types of modems that operate over
subscription based wireless networks, similar to a mobile phone. A GSM modem accepts a Subscriber Identity
Module (SIM) card, and basically acts like a mobile phone. This type of modem is an external device connected
via a USB cable or a serial cable. In this project, the GSM modem is connected to the Microcontroller via Max

Innovative Systems Design and Engineering www.iiste.org
ISSN 2222-1727 (Paper) ISSN 2222-2871 (Online)
Vol.5, No.8, 2014
13
232(level converter). If the received data values exceeds the limit values, the modem will send the alerting
message with the current values to the responsible person and Authorities.
6. SIMULATION RESULTS
The simulations have been performed using the Proteus software and MicroC Pro. for PIC. The designed sensor
array consist of CO, SO2, and dust sensors. These sensors are connected to the PIC16F887 microcontroller, as
shown in Fig. 3 below. The sensor output voltages representing the level of each pollutant were converted to a
mg/m3 value and simultaneously these data are sent to the database to be displayed.
Fig. 3.1 Pollutant measurement at area 1
Fig. 3.2 Pollutant measurements at area 2
The microcontroller generates a frame consisting of the acquired air pollutant level from the sensors array and
then upload it to the Zigbee modem and transmit it to the Central-Server via Zigbee network. The Zigbee modem
connected to the central server via RS-232 interface receives the transmitted frame and the pollutant data
displayed on the central server as shown in fig. 4.

Innovative Systems Design and Engineering www.iiste.org
ISSN 2222-1727 (Paper) ISSN 2222-2871 (Online)
Vol.5, No.8, 2014
14
Figure 4 shows the live environmental monitoring in which the pollutant values are displayed showing date and
time received. It displays the data values (CO, SO2 and dust) of particular area after every 1 minute.
Fig 4. The live environmental monitoring faceplate
This system can be used for monitoring the concentration of air pollutants both at the indoor as well as at the
outdoor environment.
7. CONCLUSION & FUTURE WORK
In this paper we have designed an air pollution monitoring system based on wireless networks by using Proteus
software to provide live monitoring and measure harmful air pollutants. Our system has been designed
specifically in the context of cement factories, particularly for those in Sub-Saharan countries where there is a
lack of technologies in environmental monitoring because most of industries are using wired and traditional
systems. Since there is no seriousness concerning air pollution in many industries, we intend in the future to
deploy our developed system in many other production industries in Tanzania. We expect the results to give us
more information about the performance and efficiency of our system, and to provide data that could allow
decision-makers to put emphasize in regulations concerning air pollution.
References
1. Vallero, D., Fundamentals of air pollution. 2007: Academic press.
2. Smith, K.R., et al., Indoor air pollution in developing countries and acute lower respiratory
infections in children. Thorax, 2000. 55(6): p. 518-532.
3. Zhang, Q., et al., A wireless solution for greenhouse monitoring and control system based on
ZigBee technology. Journal of Zhejiang University Science A, 2007. 8(10): p. 1584-1587.
4. Akyildiz, I.F., et al., Wireless sensor networks: a survey. Computer networks, 2002. 38(4): p.
393-422.
5. Völgyesi, P., et al. Air quality monitoring with sensormap. in Proceedings of the 7th
international conference on Information processing in sensor networks. 2008. IEEE Computer
Society.
6. Khedo, K.K., R. Perseedoss, and A. Mungur, A wireless sensor network air pollution
monitoring system. arXiv preprint arXiv:1005.1737, 2010.
7. North, R., et al. A mobile environmental sensing system to manage transportation and urban
air quality. in Circuits and Systems, 2008. ISCAS 2008. IEEE International Symposium on.
2008. IEEE.
8. Jelicic, V., et al. Design, characterization and management of a wireless sensor network for
smart gas monitoring. in Advances in Sensors and Interfaces (IWASI), 2011 4th IEEE
International Workshop on. 2011. IEEE.
Innovative Systems Design and Engineering www.iiste.org
ISSN 2222-1727 (Paper) ISSN 2222-2871 (Online)
Vol.5, No.8, 2014
15
9. Liu, J.-H., et al. Developed urban air quality monitoring system based on wireless sensor
networks. in Sensing Technology (ICST), 2011 Fifth International Conference on. 2011. IEEE.
10. Farahani, S., ZigBee wireless networks and transceivers. 2011: Newnes.
11. Jung, Y.J., et al. Air pollution monitoring system based on geosensor network. in Geoscience
and Remote Sensing Symposium, 2008. IGARSS 2008. IEEE International. 2008. IEEE.
12. Ergen, S.C., ZigBee/IEEE 802.15. 4 Summary. UC Berkeley, September, 2004. 10.
Author Profile
Godbless Swagarya, Msc student, Nelson Mandela African Institution of Science and Technology, Arusha
Tanzania. Email; - [email protected].
Dr. Shubi Kaijage, Lecturer, Nelson Mandela African Institution of Science and Technology, Arusha Tanzania.
Email; - [email protected]
Ramadhani S. Sinde, Assistance Lecturer, Nelson Mandela African Institution of Science and Technology,
Arusha Tanzania. Email; - [email protected]

The IISTE is a pioneer in the Open-Access hosting service and academic event
management. The aim of the firm is Accelerating Global Knowledge Sharing.
More information about the firm can be found on the homepage:
http://www.iiste.org
CALL FOR JOURNAL PAPERS
There are more than 30 peer-reviewed academic journals hosted under the hosting
platform.
Prospective authors of journals can find the submission instruction on the
following page: http://www.iiste.org/journals/ All the journals articles are available
online to the readers all over the world without financial, legal, or technical barriers
other than those inseparable from gaining access to the internet itself. Paper version
of the journals is also available upon request of readers and authors.
MORE RESOURCES
Book publication information: http://www.iiste.org/book/
IISTE Knowledge Sharing Partners
EBSCO, Index Copernicus, Ulrich's Periodicals Directory, JournalTOCS, PKP Open
Archives Harvester, Bielefeld Academic Search Engine, Elektronische
Zeitschriftenbibliothek EZB, Open J-Gate, OCLC WorldCat, Universe Digtial
Library , NewJour, Google Scholar