pt. asuransi aviva indonesia · 5 klaim dari manfaat 2,613 - pt trimulia sarana pratama 25%...
TRANSCRIPT

Gedung Asuransi Wahana Tata
Jl. HR Rasuna Said Kav. C4
Jakarta 12920, Indonesia
Telepon +62 21 522 1851
Fax +62 21 520 6572 www.aviva.co.id
LAPORAN POSISI KEUANGAN (NERACA) LAPORAN LABA RUGI KOMPERHENSIF RASIO KESEHATAN KEUANGAN
Per 31 Desember 2013 dan 2012 UNTUK TAHUN YANG BERAKHIR PADA TANGGAL 31 DESEMBER 2013 dan 2012 PER 31 DESEMBER 2013 dan 2012
(dalam jutaan rupiah) (dalam jutaan rupiah) (dalam jutaan rupiah)
2013 2012 2013 2012 No. URAIAN 2013 2012 Keterangan 2013 2012
I. INVESTASI I. LIABILITAS 1 PENDAPATAN
A. Utang 2 Pendapatan Premi 568,569 693,032 A. Tingkat Solvabilitas
1 Deposito Berjangka & Sertifikat Deposito 323,045 268,183 1 Utang Klaim 6,980 5,449 3 Premi Reasuransi (208,683) (286,998) a. Kekayaan Yang Diperkenankan 514,122 502,243
2 Saham - - 2 Utang Reasuransi 10,236 24,237 4 Penurunan (Kenaikan) CAPYBMP 1)
b. Kewajiban 309,180 382,755
3 Obligasi dan Medium Term Notes 29,515 29,185 3 Utang Komisi 3,108 4,326 a. CAPYBMP tahun/triwulan lalu 94,497 82,749 Jumlah Tingkat Solvabilitas 204,942 119,488
4 Surat Berharga yang diterbitkan atau dijamin 4 Utang Pajak 2,115 2,636 b. CAPYBMP tahun/triwulan berjalan (59,814) (94,497) B. Modal Minimum Berbasis Risiko (MMBR) 4)
oleh Pemerintah 81,256 55,657 5 Biaya Yang Masih Harus Dibayar 66,375 46,489 5 Jumlah Pendapatan Premi Neto 394,569 394,286 a. Kegagalan Pengelolaan Aset (Schedule A) 8,993 8,961
5 Surat Berharga yang diterbitkan atau dijamin 6 Utang Lain 11,092 9,651 6 Hasil Investasi 29,860 22,729 b. Ketidakseimbangan antara Peroyeksi Arus Aset dan Liabilitas 687 2,440
oleh Bank Indonesia - - 7 Jumlah Utang (1 s.d. 6) 99,906 92,788 7 Imbalan Jasa DPLK/ (Schedule B)
6 Unit Pernyertaan Reksadana 25,121 18,240 Jasa Manajemen Lainnya 7,049 5,798 c. Ketidakseimbangan antara Nilai Aset dan Liabilitas dalam 340 495
7 Penyertaan Langsung - - 8 Pendapatan Lain 61,735 50,303 Setiap Jenis Mata Uang Asing (Schedule C)
8 Bangunan dengan Hak Strata atau Tanah - - B. Cadangan Teknis d. Beban Klaim yang Terjadi dan Beban Klaim yang Diperkirakan 10,516 28,460
dengan Bangunan untuk Investasi - - 8 Cadangan Premi ( Kewajiban Manfaat Polis Masa Depan) 115,132 102,735 9 Jumlah Pendapatan 493,213 473,116 (Schedule D)
9 Pinjaman Hipotik - - 9 Cadangan atas Premi Yang Belum Merupakan Pendapatan 97,195 180,363 e. Risiko Tingkat Bunga (Schedule E) - 68
10 Pinjaman Polis 62 104 10 Cadangan Klaim ( Estimasi Kewajiban Klaim) 60,940 80,491 10 BEBAN f. Risiko Reasuransi (Schedule F) 1,817 4,349 11 Investasi Lain - - 11 Jumlah Cadangan Teknis (8 s.d. 10) 273,267 363,589 11 Klaim dan Manfaat g. Risiko Operasional (Schedule G) 1,027 -
12 Jumlah Liabilitas (7 + 11) 373,173 456,377 a. Klaim dan Manfaat Dibayar 518,509 520,330 h. Risiko Operasional PAYDI (Schedule H) 49 -
12 Jumlah Investasi (1 s.d. 11) 458,999 371,369 b. Klaim Reasuransi (218,307) (217,214) Jumlah MMBR 23,429 44,772
c. Kenaikan (Penurunan) KMPMD 2)
- - C. Kelebihan (Kekurangan) BTS 181,513 74,717
13 Pinjaman Subordinasi - - c.1. KMPMD tahun/triwulan berjalan 115,646 102,735 D. Rasio Pencapaian (%) 875% 267% c.2. KMPMD tahun/triwulan lalu (102,735) (78,453)
II. Bukan Investasi II. EKUITAS d. Kenaikan (Penurunan) EKK 3)
d.1. EKK tahun / triwulan berjalan 33,813 47,372 a. Jumlah Dana Jaminan 26,000 25,200
d.2. EKK tahun/triwulan lalu (47,372) (26,309) b. Rasio Likuiditas (%) 166% 131%
13 Kas dan Bank 22,642 73,220 14 Modal Disetor 230,400 230,400 12 Jumlah Beban Klaim dan Manfaat 299,553 348,461 c. Rasio Kecukupan Investasi (%) 223% 152%
14 Piutang Premi Penutupan Langsung 19,273 40,658 15 Agio Saham - - d. Rasio Perimbangan Hasil Investasi dengan Pendapatan 8% 6%
15 Tagihan Reasuransi 13,043 14,099 16 Saldo Laba 7,950 (32,332) 13 Biaya Akuisisi Premi Neto
16 Tagihan Hasil Investasi 2,709 1,887 17 Pendapatan Komprehensif Lain Setelah Pajak - - Beban Biaya Akuisisi e. Rasio Beban (Klaim, Usaha dan Komisi) terhadap Pendapatan 114% 128%
17 Bangunan dengan Hak Strata atau Tanah 18 Komponen Ekuitas Lainnya 127 4,324 a. Beban Komisi - Tahun Pertama 7,936 17,505 Premi Neto
dengan Bangunan untuk Dipakai Sendiri - - - - b. Beban Komisi - Tahun Lanjutan 37,982 52,212
18 Aset Tetap Lain 10,921 10,568 19 Jumlah Ekuitas (14 s.d.18) 238,477 202,392 c. Beban Komisi - Overiding - 161 Keterangan :
19 Aset Lain 84,063 146,968 d. Beban Lainnya - 221 1) CAPYBMP = Cadangan Atas Premi Yang Belum Merupakan Pendapatan
20 Jumlah Bukan Investasi (13 s.d. 19) 152,651 287,400 14 Jumlah Biaya Akuisisi 45,918 70,099 2) KMPMD = Kewajiban Manfaat Polis Masa Depan (Cadangan Premi)
3) EKK = Estimasi Kewajiban Klaim (Cadangan Klaim)
21 Jumlah Aset (12 + 20) 611,650 658,769 20 Jumlah Liabilitas dan Ekuitas 15 Pemasaran 12,660 15,104 4) MMBR = Modal Minimum Berbasis Risiko adalah suatu jumlah minimum tingkat solvabilitas yang ditetapkan,
(12+13+19) 611,650 658,769 16 Umum dan Administrasi yaitu dana yang dibutuhkan untuk mengantisipasi risiko kerugian yang mungkin timbul
Produk Asuransi Yang Dikaitkan Dengan Investasi - Beban Pegawai dan Pengurus 64,467 51,640 sebagai akibat dari deviasi dalam pengelolaan aset dan liabilitas.
(dalam jutaan rupiah) - Beban Pendidikan dan Pelatihan 968 760 5) Penyajian Laporan Posisi Keuangan (Neraca) dan Laporan Laba Rugi Komprehensif disesuaikan dengan
- Lainnya 25,616 17,823 ketentuan Pernyataan Standar Akuntansi Keuangan yang berlaku umum.
No. URAIAN 2013 2012 Dewan Komisaris 17 Jumlah Beban 449,183 503,887 6) Tingkat kesehatan keuangan merupakan tingkat kesehatan keuangan dengan prinsip konvensional
Presiden Komisaris : Rudy Wanandi 7) Sesuai dengan Pasal 2 Peraturan Menteri Keuangan No. 53/PMK.010/2012 tentang 1 Aset Wakil Presiden Komisaris : Khor Hock Seng 18 LABA (RUGI) SEBELUM PAJAK 44,030 (30,771) Kesehatan Keuangan Perusahaan Asuransi dan Perusahaan Reasuransi,
a. Investasi 47,933 35,820 Komisaris : Adam Farley Hutchison target tingkat solvabilitas paling rendah 120% dari modal minimum berbasis risiko.b. Bukan Investasi 8,797 4,361 Komisaris : Christian Wirawan Wanandi 19 PAJAK PENGHASILAN (3,747) (4,581)
Komisaris Independen : Sujono SoepenoJumlah Aset 56,730 40,181 20 LABA (RUGI) SETELAH PAJAK 40,283 (35,352)
2 Liabilitas Direksi 22 PENDAPATAN KOMPREHENSIF LAIN a. Utang 7,582 3,945 Presiden Direktur : - SETELAH PAJAK (4,197) (952) Catatan :
b. Cadangan Teknis 49,147 36,236 Wakil Presiden Direktur : Albertus Haryono Wanandi a) Laporan Posisi Keuangan (Neraca) dan Laporan Laba Rugi Komprehensif pada dan untuk tahun-tahun Direktur : Pedro Amor Perez 23 TOTAL LABA (RUGI) KOMPREHENSIF 36,086 (36,304) yang berakhir pada tanggal 31 Desember 2013 dan 2012 di atas diambil dari Laporan Keuangan pada tanggal
Jumlah Liabilitas 56,729 40,181 dan untuk tahun yang berakhir 31 Desember 2013 dan 2012 yang telah diaudit oleh Kantor Akuntan Publik Tanudiredja, Wibisana dan Rekan (anggota jaringan global PwC)
3 Pendapatan Premi 16,062 15,185 Aviva International Holdings, Ltd 60% yang laporannya tertanggal 28 April 2014 menyatakan pendapat "Wajar Tanpa Pengecualian".
4 Hasil Investasi 37 92 PT Asuransi Wahana Tata 15% b) Cadangan Teknis 31 Desember 2013 dihitung oleh Anis Mirawati, FSAI Aktuaris Perusahaan dan 5 Klaim dari Manfaat 2,613 - PT Trimulia Sarana Pratama 25% Jakarta, 28 April 2014 Cadangan Teknis 31 Desember 2012 dihitung oleh Ponno Jonatan, FSAI Aktuaris Perusahaan
Direksi c) Angka (nilai) yang disajikan pada Laporan Posisi Keuangan (Neraca) dan PT.ASURANSI AVIVA INDONESIA Laporan Laba Rugi Komprehensif berdasarkan SAK (Audit Report).
d) Kurs pada tanggal 31 Desember 2013, 1 US $ : Rp. 12.189
Kurs pada tanggal 31 Desember 2012, 1 US $ : Rp. 9.670
Komisaris dan Direksi
Pemilik Perusahaan
Pemenuhan Tingkat Solvabilitas
ASET LIABILITAS DAN EKUITAS
Informasi Lain
PT. Asuransi Aviva Indonesia

CORPORATE TAX CALCULATION
PT ASURANSI AVIVA INDONESIA
As at 31 Desember 2013
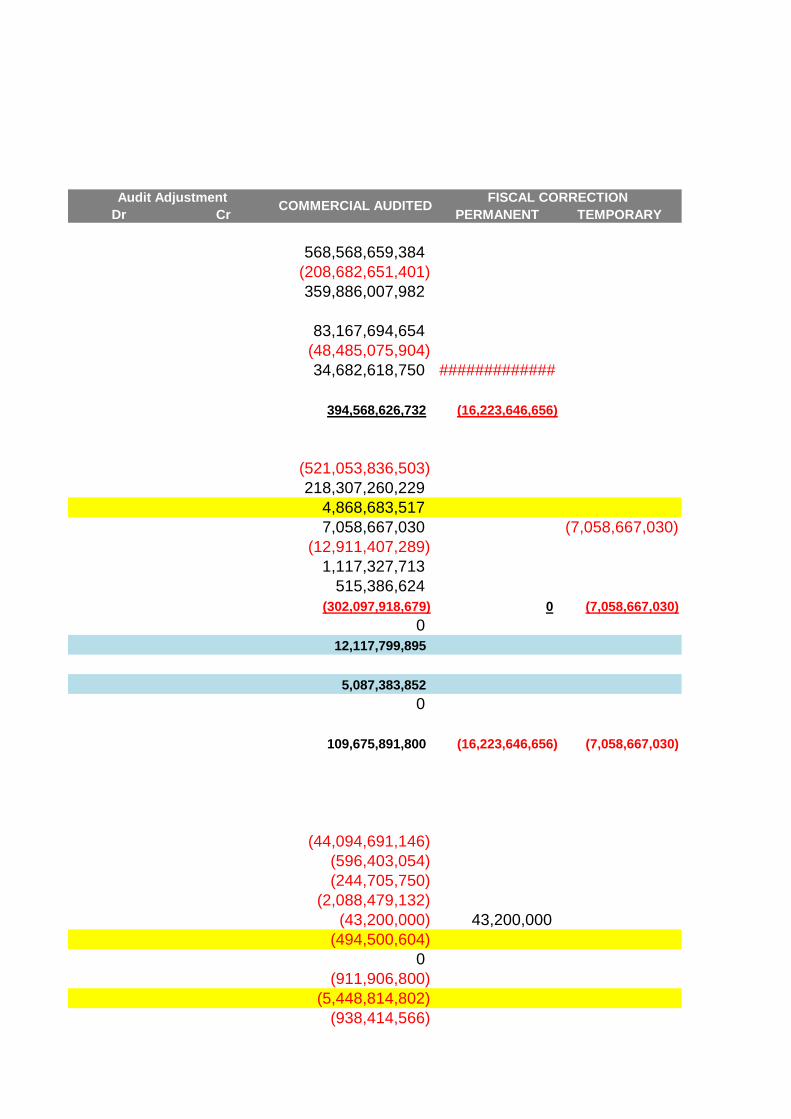
I PREMIUM INCOME
Gross Written Premium 568,568,659,384
Ceded Written Premium (208,682,651,401)
Net Written Premium 359,886,007,982
Gross Change in Unearned Premium Reserves 83,167,694,654
Ceded Change in Unearned Premium Reserves (48,485,075,904)
Net Change in UPR 34,682,618,750
Net Earned Premium Income 394,568,626,732
II CLAIMS
Gross Claims Paid (521,053,836,503)
Ceded Share of Claims Paid 218,307,260,229
Net Change in RNYA/ Case Reserves 4,868,683,517
Net Change in IBNR/ incurred estimated claim 7,058,667,030
Net Policy Holder Account Balance (12,911,407,289)
Net LTD Reserve 1,117,327,713
Net Unit Link Reserve 515,386,624
Total Claims (302,097,918,679)
III NET COMMISSION & BROKER INCURRED 12,117,799,895
IVa OTHER TECHNICAL INCOME & EXPENSES 5,087,383,852
IVb INTEREST ON CURRENT ACCOUNT
V NET INCOME 109,675,891,800
VI OPERATING EXPENSES
a Personal Costs
Salaries - Regular (44,094,691,146)
Salaries - Overtime (596,403,054)
Honorarium for commissionaire (244,705,750)
Salaries - Tunjangan Hari Raya (2,088,479,132)
Employee Tax Article 21 (43,200,000)
Severence Packages (494,500,604)
Med Exam Fees
Jamsostek Contribution (911,906,800)
Bonus - Performance (5,448,814,802)
Define Contribution Plan (DPLK Plan) (938,414,566)
NODESCRIPTION COMMERCIAL UN AUDITED
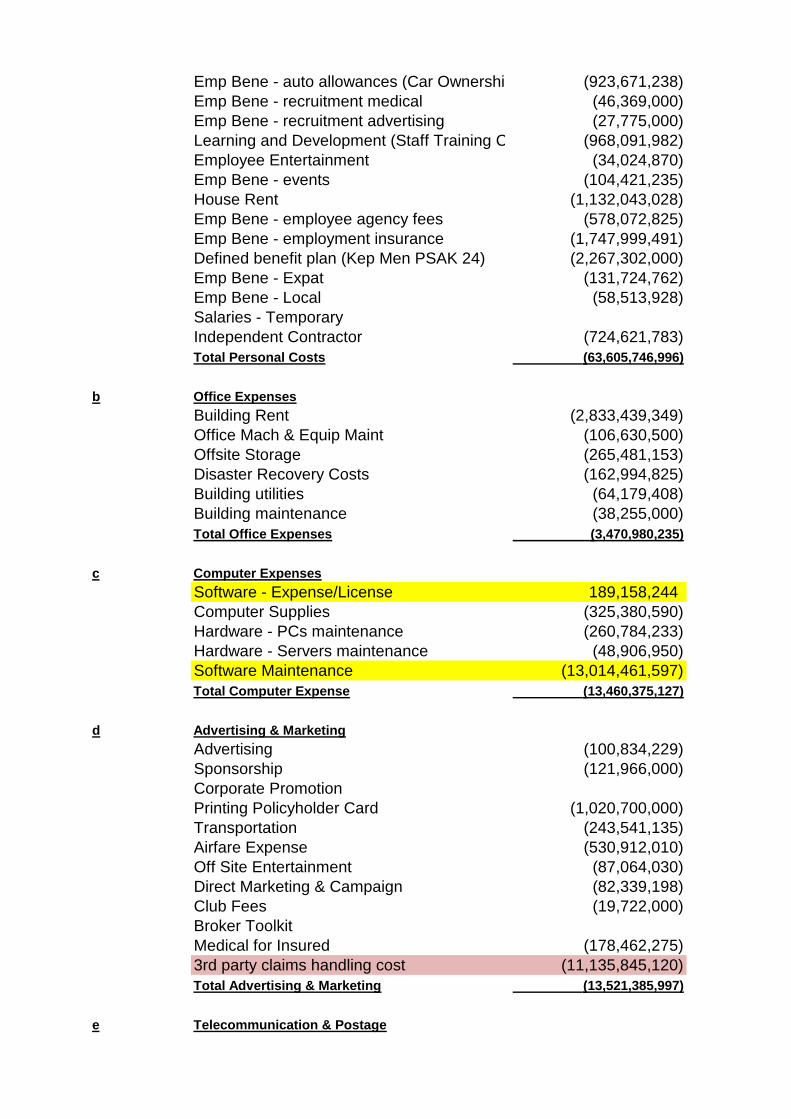
Emp Bene - auto allowances (Car Ownership Program)(923,671,238)
Emp Bene - recruitment medical (46,369,000)
Emp Bene - recruitment advertising (27,775,000)
Learning and Development (Staff Training Costs) (968,091,982)
Employee Entertainment (34,024,870)
Emp Bene - events (104,421,235)
House Rent (1,132,043,028)
Emp Bene - employee agency fees (578,072,825)
Emp Bene - employment insurance (1,747,999,491)
Defined benefit plan (Kep Men PSAK 24) (2,267,302,000)
Emp Bene - Expat (131,724,762)
Emp Bene - Local (58,513,928)
Salaries - Temporary
Independent Contractor (724,621,783)
Total Personal Costs (63,605,746,996)
b Office Expenses
Building Rent (2,833,439,349)
Office Mach & Equip Maint (106,630,500)
Offsite Storage (265,481,153)
Disaster Recovery Costs (162,994,825)
Building utilities (64,179,408)
Building maintenance (38,255,000)
Total Office Expenses (3,470,980,235)
c Computer Expenses
Software - Expense/License 189,158,244
Computer Supplies (325,380,590)
Hardware - PCs maintenance (260,784,233)
Hardware - Servers maintenance (48,906,950)
Software Maintenance (13,014,461,597)
Total Computer Expense (13,460,375,127)
d Advertising & Marketing
Advertising (100,834,229)
Sponsorship (121,966,000)
Corporate Promotion
Printing Policyholder Card (1,020,700,000)
Transportation (243,541,135)
Airfare Expense (530,912,010)
Off Site Entertainment (87,064,030)
Direct Marketing & Campaign (82,339,198)
Club Fees (19,722,000)
Broker Toolkit
Medical for Insured (178,462,275)
3rd party claims handling cost (11,135,845,120)
Total Advertising & Marketing (13,521,385,997)
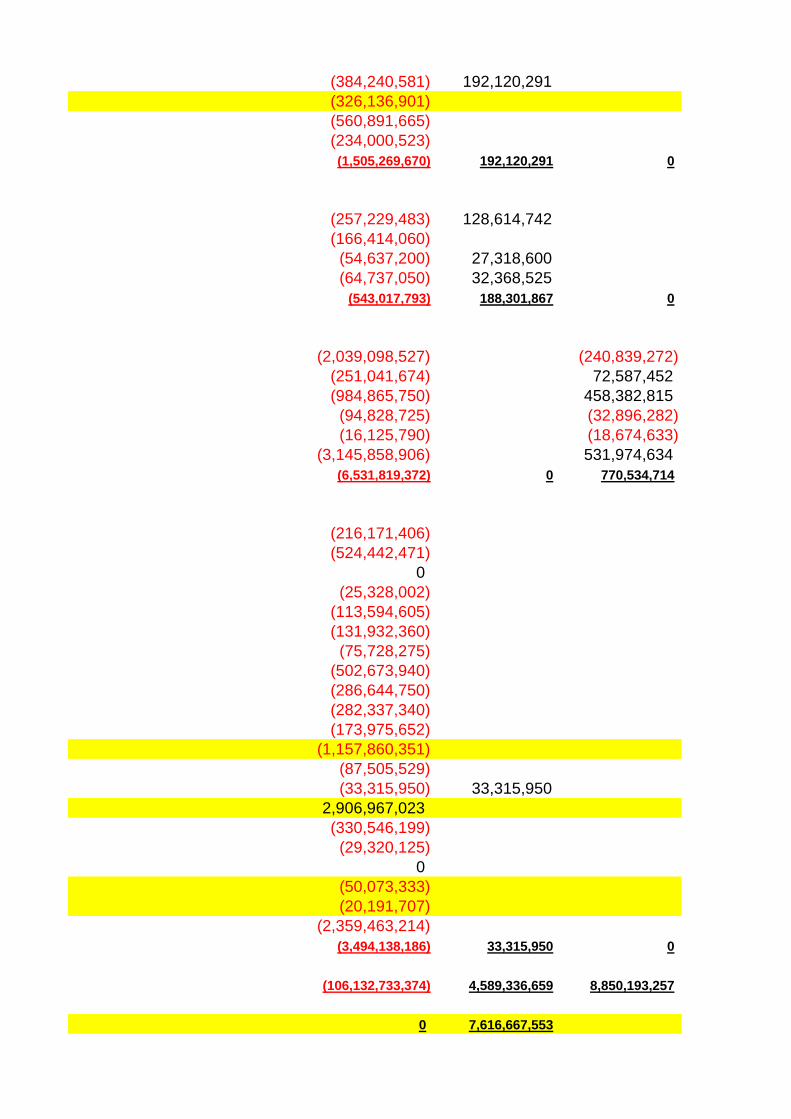
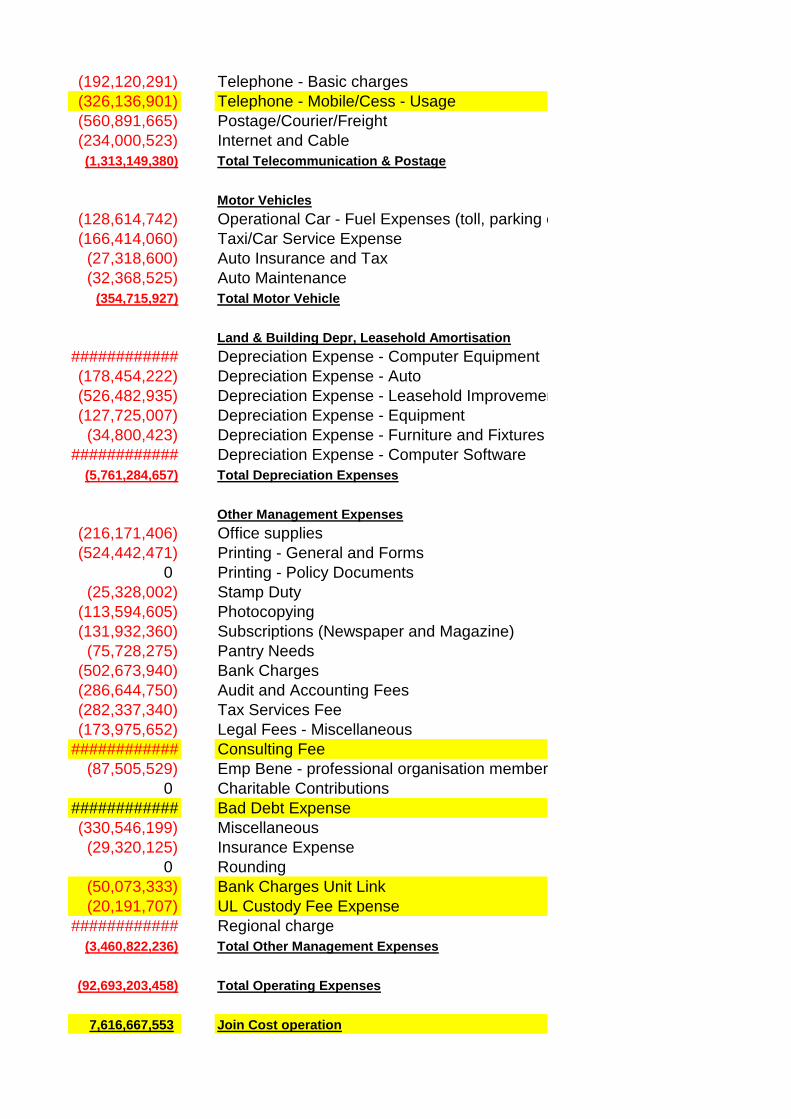
e Telecommunication & Postage
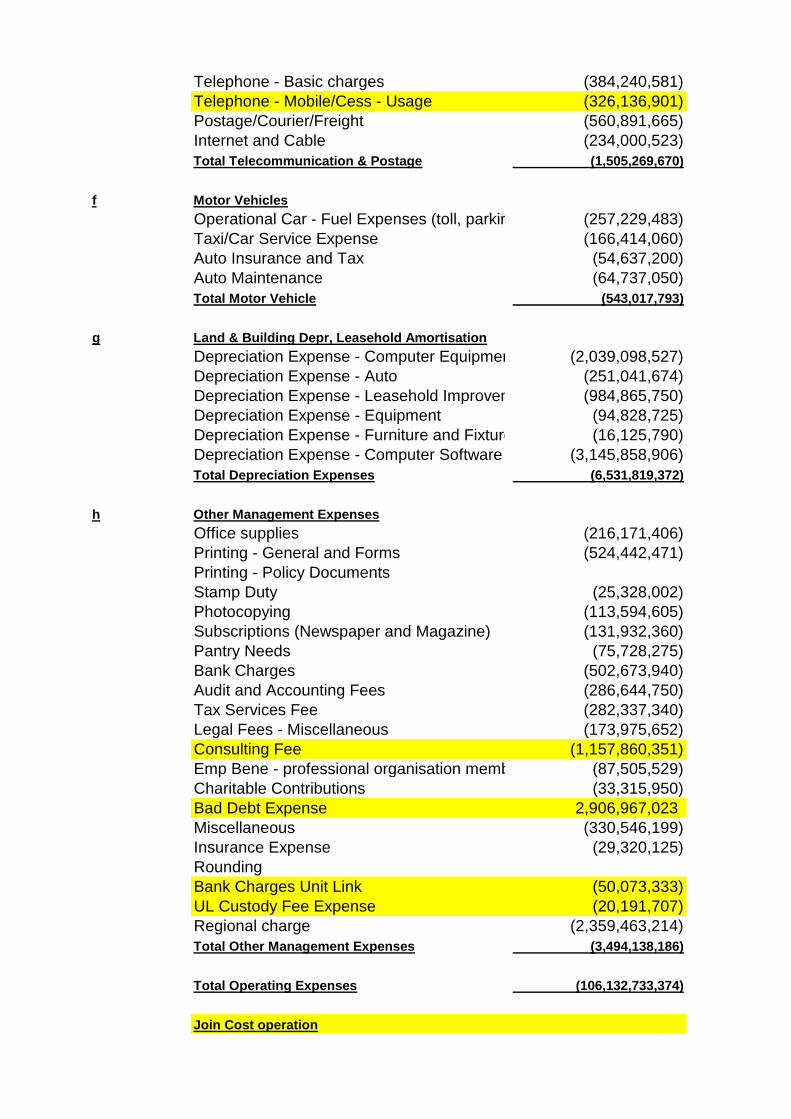
Telephone - Basic charges (384,240,581)
Telephone - Mobile/Cess - Usage (326,136,901)
Postage/Courier/Freight (560,891,665)
Internet and Cable (234,000,523)
Total Telecommunication & Postage (1,505,269,670)
f Motor Vehicles
Operational Car - Fuel Expenses (toll, parking etc) (257,229,483)
Taxi/Car Service Expense (166,414,060)
Auto Insurance and Tax (54,637,200)
Auto Maintenance (64,737,050)
Total Motor Vehicle (543,017,793)
g Land & Building Depr, Leasehold Amortisation
Depreciation Expense - Computer Equipment (2,039,098,527)
Depreciation Expense - Auto (251,041,674)
Depreciation Expense - Leasehold Improvement (984,865,750)
Depreciation Expense - Equipment (94,828,725)
Depreciation Expense - Furniture and Fixtures (16,125,790)
Depreciation Expense - Computer Software (3,145,858,906)
Total Depreciation Expenses (6,531,819,372)
h Other Management Expenses
Office supplies (216,171,406)
Printing - General and Forms (524,442,471)
Printing - Policy Documents
Stamp Duty (25,328,002)
Photocopying (113,594,605)
Subscriptions (Newspaper and Magazine) (131,932,360)
Pantry Needs (75,728,275)
Bank Charges (502,673,940)
Audit and Accounting Fees (286,644,750)
Tax Services Fee (282,337,340)
Legal Fees - Miscellaneous (173,975,652)
Consulting Fee (1,157,860,351)
Emp Bene - professional organisation membership fees (87,505,529)
Charitable Contributions (33,315,950)
Bad Debt Expense 2,906,967,023
Miscellaneous (330,546,199)
Insurance Expense (29,320,125)
Rounding
Bank Charges Unit Link (50,073,333)
UL Custody Fee Expense (20,191,707)
Regional charge (2,359,463,214)
Total Other Management Expenses (3,494,138,186)
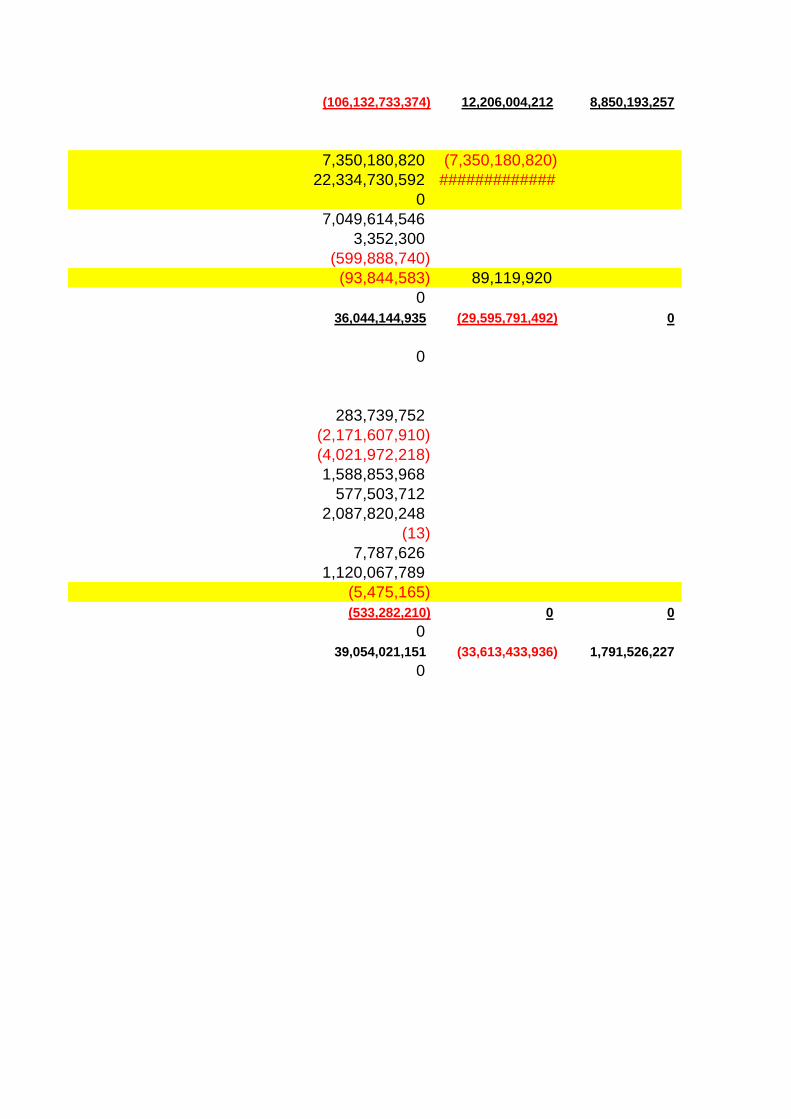
Total Operating Expenses (106,132,733,374)
Join Cost operation
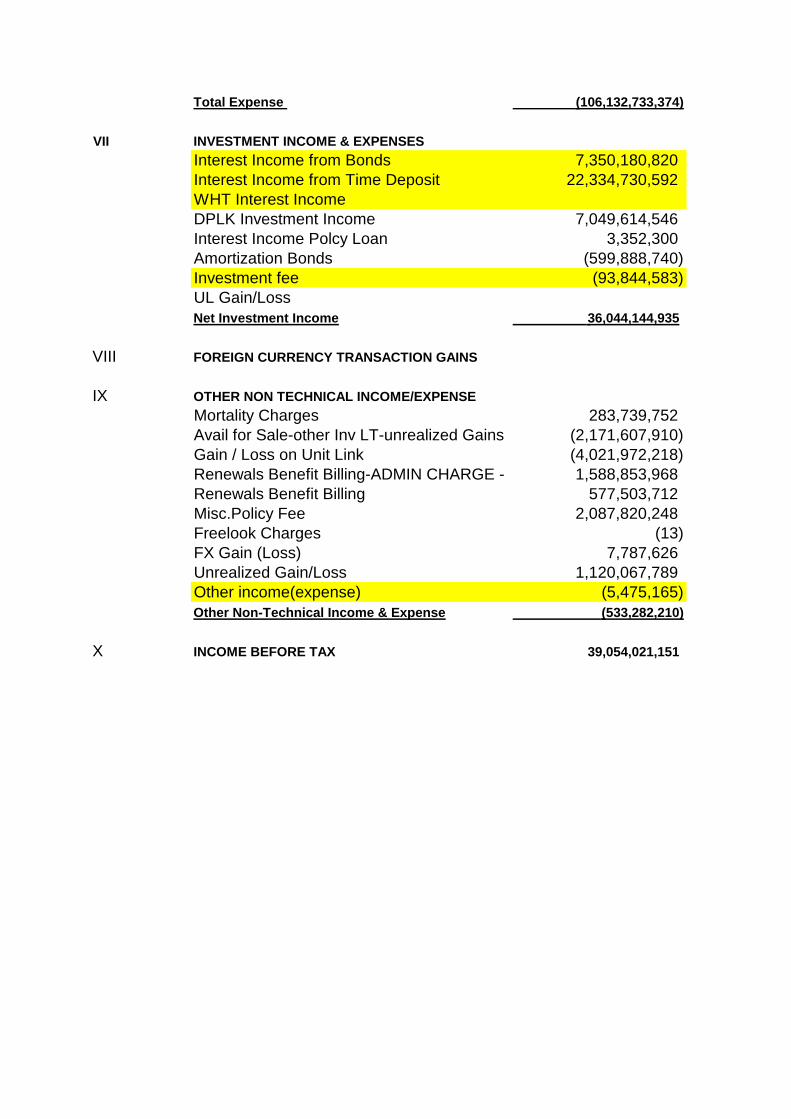
Total Expense (106,132,733,374)
VII INVESTMENT INCOME & EXPENSES
Interest Income from Bonds 7,350,180,820
Interest Income from Time Deposit 22,334,730,592
WHT Interest Income
DPLK Investment Income 7,049,614,546
Interest Income Polcy Loan 3,352,300
Amortization Bonds (599,888,740)
Investment fee (93,844,583)
UL Gain/Loss
Net Investment Income 36,044,144,935
VIII FOREIGN CURRENCY TRANSACTION GAINS
IX OTHER NON TECHNICAL INCOME/EXPENSE
Mortality Charges 283,739,752
Avail for Sale-other Inv LT-unrealized Gains (2,171,607,910)
Gain / Loss on Unit Link (4,021,972,218)
Renewals Benefit Billing-ADMIN CHARGE - RYP 1,588,853,968
Renewals Benefit Billing 577,503,712
Misc.Policy Fee 2,087,820,248
Freelook Charges (13)
FX Gain (Loss) 7,787,626
Unrealized Gain/Loss 1,120,067,789
Other income(expense) (5,475,165)
Other Non-Technical Income & Expense (533,282,210)
X INCOME BEFORE TAX 39,054,021,151
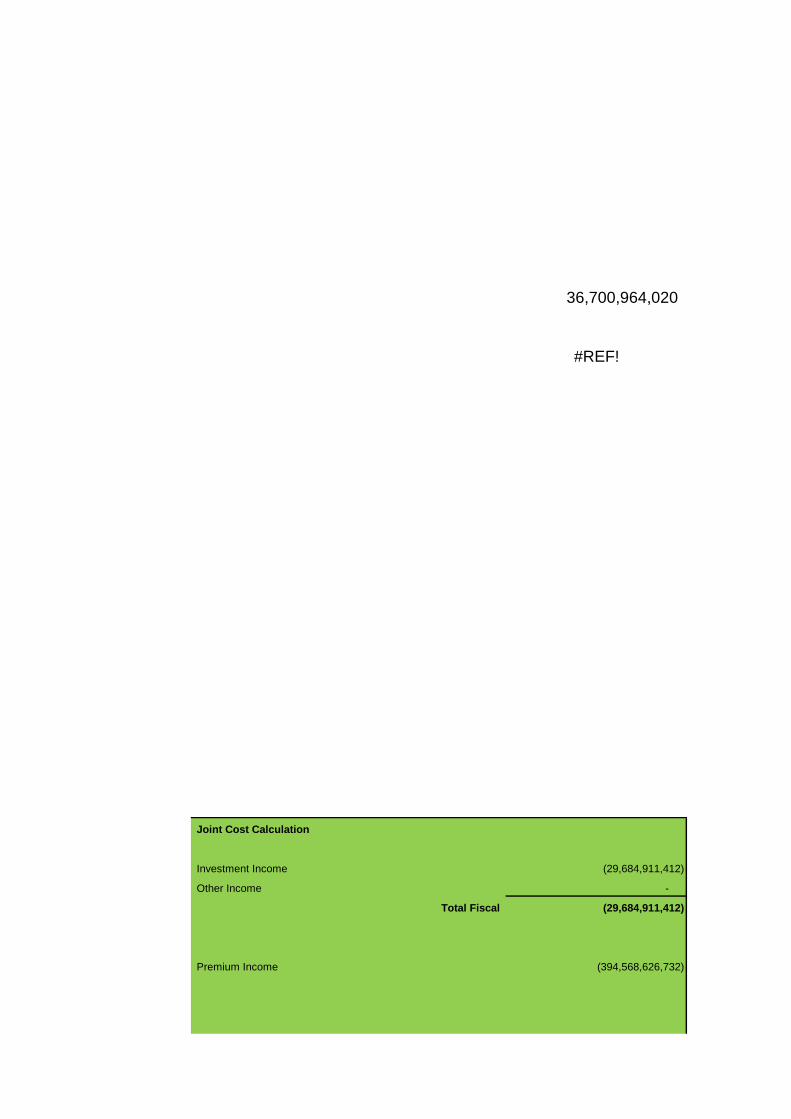
36,700,964,020
#REF!
Joint Cost Calculation
Investment Income (29,684,911,412)
Other Income -
Total Fiscal (29,684,911,412)
Premium Income (394,568,626,732)

Investment Income
AFS income - policy loans - direct -
Other Income 6,516,332,336
Total (388,052,294,397)
7%
Total Operating Expense (103,700,358,337)
Fiscal Correction 3,484,243,867
Net Fiscal Correction (107,184,602,204)
NDE Calculated (7,616,667,553)
Realisasi project sunrise
Bonus adjustment
Permanent differences
Expenses subjected to final tax
Taxes and others
Benefits in kind and others
Technical reserve
Temporary differences
IBNR
Bonus and accruals
Depreciation of fixed assets
Employee benefits expense
Dr Cr PERMANENT TEMPORARY
568,568,659,384
(208,682,651,401)
359,886,007,982
83,167,694,654
(48,485,075,904)
34,682,618,750 #############
394,568,626,732 (16,223,646,656)
(521,053,836,503)
218,307,260,229
4,868,683,517
7,058,667,030 (7,058,667,030)
(12,911,407,289)
1,117,327,713
515,386,624
(302,097,918,679) 0 (7,058,667,030)
0
12,117,799,895
5,087,383,852
0
109,675,891,800 (16,223,646,656) (7,058,667,030)
(44,094,691,146)
(596,403,054)
(244,705,750)
(2,088,479,132)
(43,200,000) 43,200,000
(494,500,604)
0
(911,906,800)
(5,448,814,802)
(938,414,566)
FISCAL CORRECTIONCOMMERCIAL AUDITED
Audit Adjustment

(923,671,238) 923,671,238
(46,369,000)
(27,775,000)
(968,091,982)
(34,024,870) 34,024,870
(104,421,235) 104,421,235
(1,132,043,028) 1,132,043,028
(578,072,825)
(1,747,999,491) 1,747,999,491
(2,267,302,000) 1,563,311,536
(131,724,762) 131,724,762
(58,513,928) 58,513,928
0
(724,621,783)
(63,605,746,996) 4,175,598,552 1,563,311,536
0
0
(2,833,439,349)
(106,630,500)
(265,481,153)
(162,994,825)
(64,179,408)
(38,255,000)
(3,470,980,235) 0 0
189,158,244
(325,380,590)
(260,784,233)
(48,906,950)
(13,014,461,597) 6,516,347,007
(13,460,375,127) 0 6,516,347,007
(100,834,229)
(121,966,000)
0
(1,020,700,000)
(243,541,135)
(530,912,010)
(87,064,030)
(82,339,198)
(19,722,000)
0
(178,462,275)
(11,135,845,120)
(13,521,385,997) 0 0
(384,240,581) 192,120,291
(326,136,901)
(560,891,665)
(234,000,523)
(1,505,269,670) 192,120,291 0
(257,229,483) 128,614,742
(166,414,060)
(54,637,200) 27,318,600
(64,737,050) 32,368,525
(543,017,793) 188,301,867 0
(2,039,098,527) (240,839,272)
(251,041,674) 72,587,452
(984,865,750) 458,382,815
(94,828,725) (32,896,282)
(16,125,790) (18,674,633)
(3,145,858,906) 531,974,634
(6,531,819,372) 0 770,534,714
(216,171,406)
(524,442,471)
0
(25,328,002)
(113,594,605)
(131,932,360)
(75,728,275)
(502,673,940)
(286,644,750)
(282,337,340)
(173,975,652)
(1,157,860,351)
(87,505,529)
(33,315,950) 33,315,950
2,906,967,023
(330,546,199)
(29,320,125)
0
(50,073,333)
(20,191,707)
(2,359,463,214)
(3,494,138,186) 33,315,950 0
(106,132,733,374) 4,589,336,659 8,850,193,257
0 7,616,667,553
(106,132,733,374) 12,206,004,212 8,850,193,257
7,350,180,820 (7,350,180,820)
22,334,730,592 #############
0
7,049,614,546
3,352,300
(599,888,740)
(93,844,583) 89,119,920
0
36,044,144,935 (29,595,791,492) 0
0
283,739,752
(2,171,607,910)
(4,021,972,218)
1,588,853,968
577,503,712
2,087,820,248
(13)
7,787,626
1,120,067,789
(5,475,165)
(533,282,210) 0 0
0
39,054,021,151 (33,613,433,936) 1,791,526,227
0

PL in TB figure

Realisasi project sunrise
Bonus adjustment
Permanent differences
Expenses subjected to final tax
Taxes and others
Benefits in kind and others
Technical reserve
Temporary differences
IBNR
Bonus and accruals
Depreciation of fixed assets
Employee benefits expense
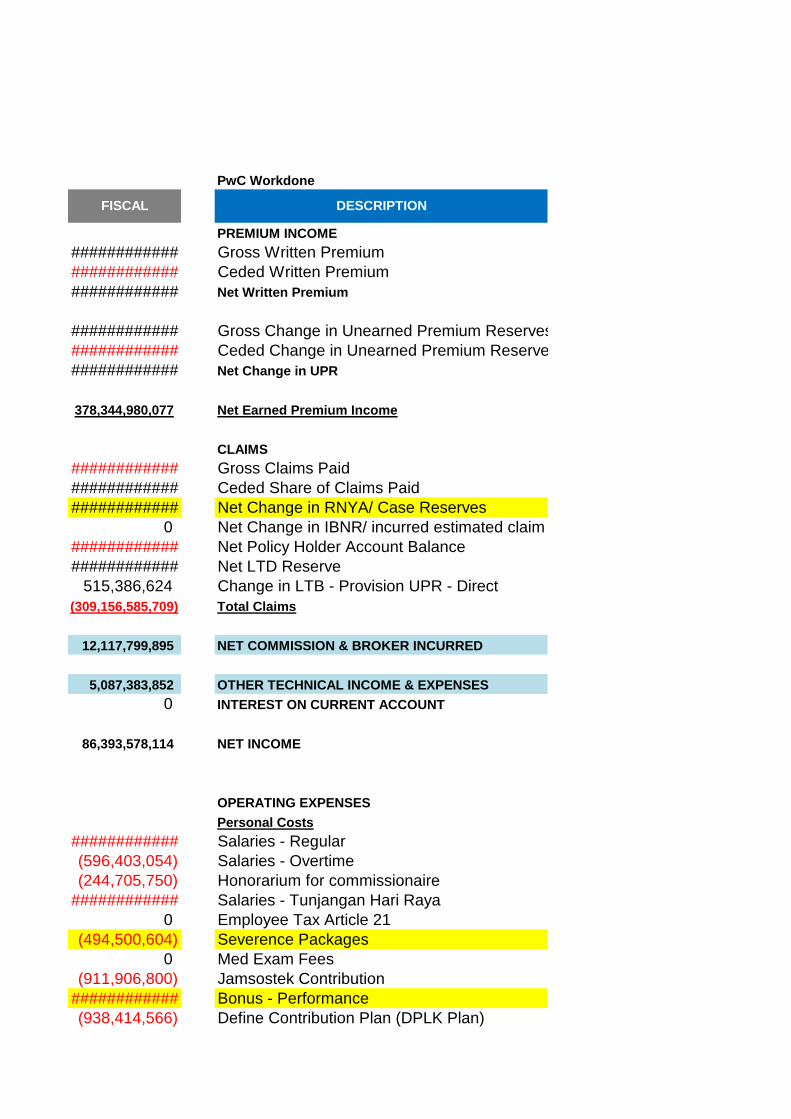
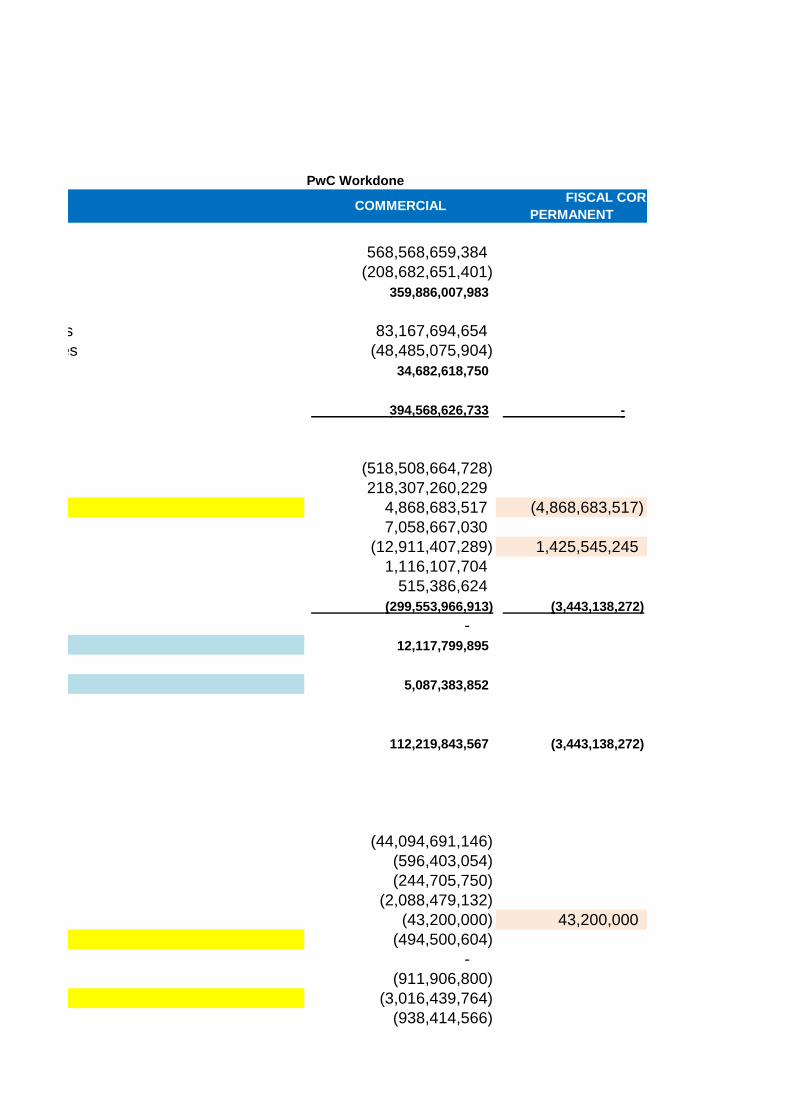
PwC Workdone
PREMIUM INCOME
############ Gross Written Premium
############ Ceded Written Premium
############ Net Written Premium
############ Gross Change in Unearned Premium Reserves
############ Ceded Change in Unearned Premium Reserves
############ Net Change in UPR
378,344,980,077 Net Earned Premium Income
CLAIMS
############ Gross Claims Paid
############ Ceded Share of Claims Paid
############ Net Change in RNYA/ Case Reserves
0 Net Change in IBNR/ incurred estimated claim
############ Net Policy Holder Account Balance
############ Net LTD Reserve
515,386,624 Change in LTB - Provision UPR - Direct
(309,156,585,709) Total Claims
12,117,799,895 NET COMMISSION & BROKER INCURRED
5,087,383,852 OTHER TECHNICAL INCOME & EXPENSES
0 INTEREST ON CURRENT ACCOUNT
86,393,578,114 NET INCOME
OPERATING EXPENSES
Personal Costs
############ Salaries - Regular
(596,403,054) Salaries - Overtime
(244,705,750) Honorarium for commissionaire
############ Salaries - Tunjangan Hari Raya
0 Employee Tax Article 21
(494,500,604) Severence Packages
0 Med Exam Fees
(911,906,800) Jamsostek Contribution
############ Bonus - Performance
(938,414,566) Define Contribution Plan (DPLK Plan)
FISCAL DESCRIPTION

0 Emp Bene - auto allowances (Car Ownership Program)
(46,369,000) Emp Bene - recruitment medical
(27,775,000) Emp Bene - recruitment advertising
(968,091,982) Learning and Development (Staff Training Costs)
0 Employee Entertainment
(0) Emp Bene - events
(0) House Rent
(578,072,825) Emp Bene - employee agency fees
1 Emp Bene - employment insurance
(703,990,464) Defined benefit plan (Kep Men PSAK 24)
(0) Emp Bene - Expat
0 Emp Bene - Local
0 Salaries - Temporary
(724,621,783) Independent Contractor
(57,866,836,908) Total Personal Costs
Office Expenses
############ Building Rent
(106,630,500) Office Mach & Equip Maint
(265,481,153) Offsite Storage
(162,994,825) Disaster Recovery Costs
(64,179,408) Building utilities
(38,255,000) Building maintenance
(3,470,980,235) Total Office Expenses
Computer Expenses
189,158,244 Software - Expense/License
(325,380,590) Computer Supplies
(260,784,233) Hardware - PCs maintenance
(48,906,950) Hardware - Servers maintenance
############ Software Maintenance
(6,944,028,120) Total Computer Expense
Advertising & Marketing
(100,834,229) Advertising
(121,966,000) Sponsorship
0 Corporate Promotion
############ Printing Policyholder Card
(243,541,135) Transportation
(530,912,010) Airfare Expense
(87,064,030) Off Site Entertainment
(82,339,198) Direct Marketing & Campaign
(19,722,000) Club Fees
0 Broker Toolkit
(178,462,275) Medical for Insured
############ 3rd party claims handling cost
(13,521,385,997) Total Advertising & Marketing
Telecommunication & Postage
(192,120,291) Telephone - Basic charges
(326,136,901) Telephone - Mobile/Cess - Usage
(560,891,665) Postage/Courier/Freight
(234,000,523) Internet and Cable
(1,313,149,380) Total Telecommunication & Postage
Motor Vehicles
(128,614,742) Operational Car - Fuel Expenses (toll, parking etc)
(166,414,060) Taxi/Car Service Expense
(27,318,600) Auto Insurance and Tax
(32,368,525) Auto Maintenance
(354,715,927) Total Motor Vehicle
Land & Building Depr, Leasehold Amortisation
############ Depreciation Expense - Computer Equipment
(178,454,222) Depreciation Expense - Auto
(526,482,935) Depreciation Expense - Leasehold Improvement
(127,725,007) Depreciation Expense - Equipment
(34,800,423) Depreciation Expense - Furniture and Fixtures
############ Depreciation Expense - Computer Software
(5,761,284,657) Total Depreciation Expenses
Other Management Expenses
(216,171,406) Office supplies
(524,442,471) Printing - General and Forms
0 Printing - Policy Documents
(25,328,002) Stamp Duty
(113,594,605) Photocopying
(131,932,360) Subscriptions (Newspaper and Magazine)
(75,728,275) Pantry Needs
(502,673,940) Bank Charges
(286,644,750) Audit and Accounting Fees
(282,337,340) Tax Services Fee
(173,975,652) Legal Fees - Miscellaneous
############ Consulting Fee
(87,505,529) Emp Bene - professional organisation membership fees
0 Charitable Contributions
############ Bad Debt Expense
(330,546,199) Miscellaneous
(29,320,125) Insurance Expense
0 Rounding
(50,073,333) Bank Charges Unit Link
(20,191,707) UL Custody Fee Expense
############ Regional charge
(3,460,822,236) Total Other Management Expenses
(92,693,203,458) Total Operating Expenses
7,616,667,553 Join Cost operation

(85,076,535,905) Total Expense
INVESTMENT INCOME & EXPENSES
0 Interest Income from Bonds
0 Interest Income from Time Deposit
0 WHT Interest Income
############ DPLK Investment Income
3,352,300 Interest Income Polcy Loan
(599,888,740) Amortization Bonds
(4,724,663) Investment fee
0 UL Gain/Loss
6,448,353,443 Net Investment Income
0 FOREIGN CURRENCY TRANSACTION GAINS
OTHER NON TECHNICAL INCOME/EXPENSE
283,739,752 Mortality Charges
############ Avail for Sale-other Inv LT-unrealized Gains
############ Gain / Loss on Unit Link
############ Renewals Benefit Billing-ADMIN CHARGE - RYP
577,503,712 Renewals Benefit Billing
############ Misc.Policy Fee
(13) Freelook Charges
7,787,626 FX Gain (Loss)
############ Unrealized Gain/Loss
(5,475,165) Other income(expense)
(533,282,210) Other Non-Technical Income & Expense
0
7,232,113,442 INCOME BEFORE TAX
0
############

1)

Realisasi project sunrise
Bonus adjustment
Permanent differences
Expenses subjected to final tax
Taxes and others
Benefits in kind and others
Technical reserve
Temporary differences
IBNR
Bonus and accruals
Depreciation of fixed assets
Employee benefits expense
PwC Workdone
PERMANENT
568,568,659,384
(208,682,651,401)
359,886,007,983
Gross Change in Unearned Premium Reserves 83,167,694,654
Ceded Change in Unearned Premium Reserves (48,485,075,904)
34,682,618,750
394,568,626,733 -
(518,508,664,728)
218,307,260,229
4,868,683,517 (4,868,683,517)
7,058,667,030
(12,911,407,289) 1,425,545,245
1,116,107,704
515,386,624
(299,553,966,913) (3,443,138,272)
-
12,117,799,895
5,087,383,852
112,219,843,567 (3,443,138,272)
(44,094,691,146)
(596,403,054)
(244,705,750)
(2,088,479,132)
(43,200,000) 43,200,000
(494,500,604)
-
(911,906,800)
(3,016,439,764)
(938,414,566)
COMMERCIALFISCAL CORRECTION

Emp Bene - auto allowances (Car Ownership Program) (923,671,238) 923,671,238
(46,369,000)
(27,775,000)
Learning and Development (Staff Training Costs) (968,091,982)
(34,024,870) 34,024,870
(104,421,235) 104,421,235
(1,132,043,028) 1,132,043,028
(578,072,825)
(1,747,999,491) 1,747,999,491
(2,267,302,000)
(131,724,762) 131,724,762
(58,513,928) 58,513,928
-
(724,621,783)
(61,173,371,958) 4,175,598,552
(2,833,439,349)
(106,630,500)
(265,481,153)
(162,994,825)
(64,179,408)
(38,255,000)
(3,470,980,235) -
189,158,244
(325,380,590)
(260,784,233)
(48,906,950)
(13,014,461,597)
(13,460,375,126) -
(100,834,229)
(121,966,000)
-
(1,020,700,000)
(243,541,135)
(530,912,010)
(87,064,030)
(82,339,198)
(19,722,000)
-
(178,462,275)
(11,135,845,120)
(13,521,385,997) -
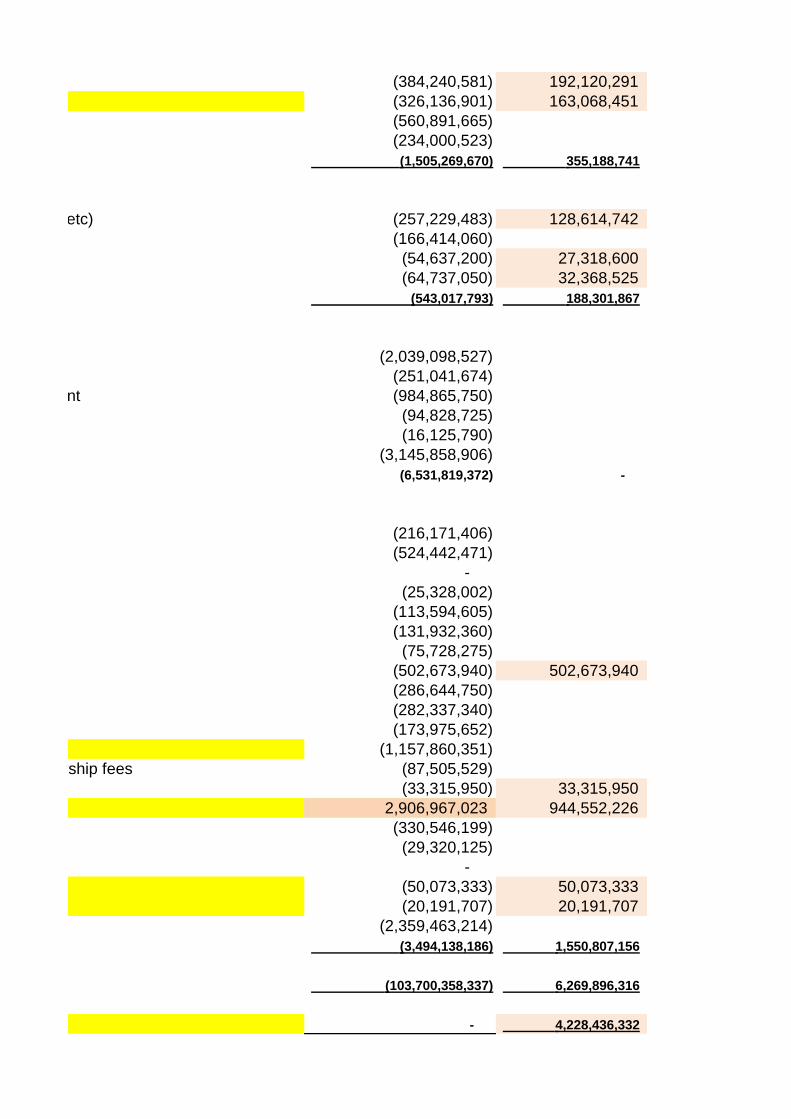
(384,240,581) 192,120,291
(326,136,901) 163,068,451
(560,891,665)
(234,000,523)
(1,505,269,670) 355,188,741
Operational Car - Fuel Expenses (toll, parking etc) (257,229,483) 128,614,742
(166,414,060)
(54,637,200) 27,318,600
(64,737,050) 32,368,525
(543,017,793) 188,301,867
(2,039,098,527)
(251,041,674)
Depreciation Expense - Leasehold Improvement (984,865,750)
(94,828,725)
(16,125,790)
(3,145,858,906)
(6,531,819,372) -
(216,171,406)
(524,442,471)
-
(25,328,002)
(113,594,605)
(131,932,360)
(75,728,275)
(502,673,940) 502,673,940
(286,644,750)
(282,337,340)
(173,975,652)
(1,157,860,351)
Emp Bene - professional organisation membership fees (87,505,529)
(33,315,950) 33,315,950
2,906,967,023 944,552,226
(330,546,199)
(29,320,125)
-
(50,073,333) 50,073,333
(20,191,707) 20,191,707
(2,359,463,214)
(3,494,138,186) 1,550,807,156
(103,700,358,337) 6,269,896,316
- 4,228,436,332

(103,700,358,337) 10,498,332,647
7,350,180,820 (7,350,180,820)
22,334,730,592 (22,334,730,592)
-
7,049,614,546
3,352,300
(599,888,740)
(93,844,583) 93,844,583
- 1,425,545,245
36,044,144,935 (28,165,521,584)
-
283,739,752
(2,171,607,910)
(4,021,972,218)
Renewals Benefit Billing-ADMIN CHARGE - RYP 1,588,853,968
577,503,712
2,087,820,248
(13)
7,787,626
1,120,067,789
(5,475,165)
(533,282,211) -
-
44,030,347,954 (21,110,327,210)
Corporate income tax (CIT) Calculation
Income Before Tax 13,075,701,266
CIT (25% x Taxable Income) 3,268,925,316
Reconciliation
Prepaid tax -
Tax payable per TB -
Corporate income tax payable 3,268,925,316
Tax Benefit (Expense) - Deferred per TB 1,066,655,714
Tax Benefit (Expense) - Final per TB 1,286,401,422
Total income tax expense per PwC 3,268,925,316
Tax loss carry forward 84,483,596,429
Tax loss carry forward after utilized 81,214,671,113
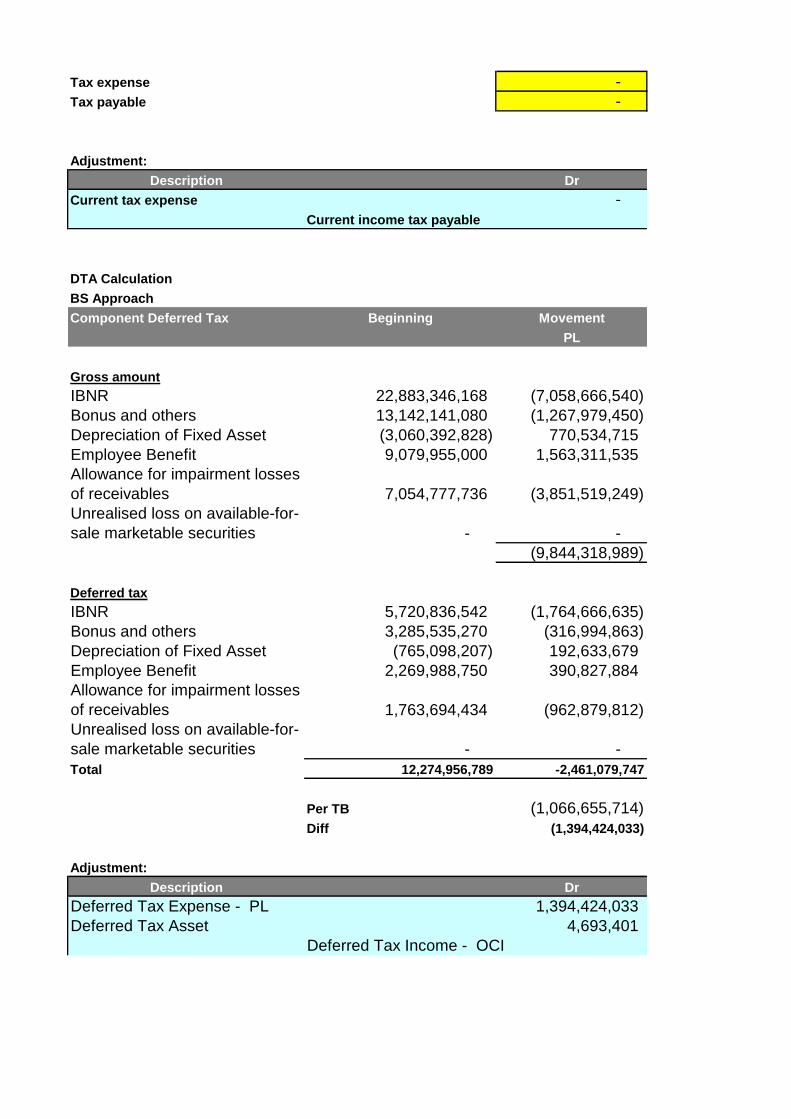
Tax expense -
Tax payable -
Adjustment:
Description Dr
Current tax expense -
Current income tax payable
DTA Calculation
BS Approach
Component Deferred Tax Beginning Movement
PL
Gross amount
IBNR 22,883,346,168 (7,058,666,540)
Bonus and others 13,142,141,080 (1,267,979,450)
Depreciation of Fixed Asset (3,060,392,828) 770,534,715
Employee Benefit 9,079,955,000 1,563,311,535
Allowance for impairment losses
of receivables 7,054,777,736 (3,851,519,249)
Unrealised loss on available-for-
sale marketable securities - -
(9,844,318,989)
Deferred tax
IBNR 5,720,836,542 (1,764,666,635)
Bonus and others 3,285,535,270 (316,994,863)
Depreciation of Fixed Asset (765,098,207) 192,633,679
Employee Benefit 2,269,988,750 390,827,884
Allowance for impairment losses
of receivables 1,763,694,434 (962,879,812)
Unrealised loss on available-for-
sale marketable securities - -
Total 12,274,956,789 -2,461,079,747
Per TB (1,066,655,714)
Diff (1,394,424,033)
Adjustment:
Description Dr
Deferred Tax Expense - PL 1,394,424,033
Deferred Tax Asset 4,693,401
Deferred Tax Income - OCI
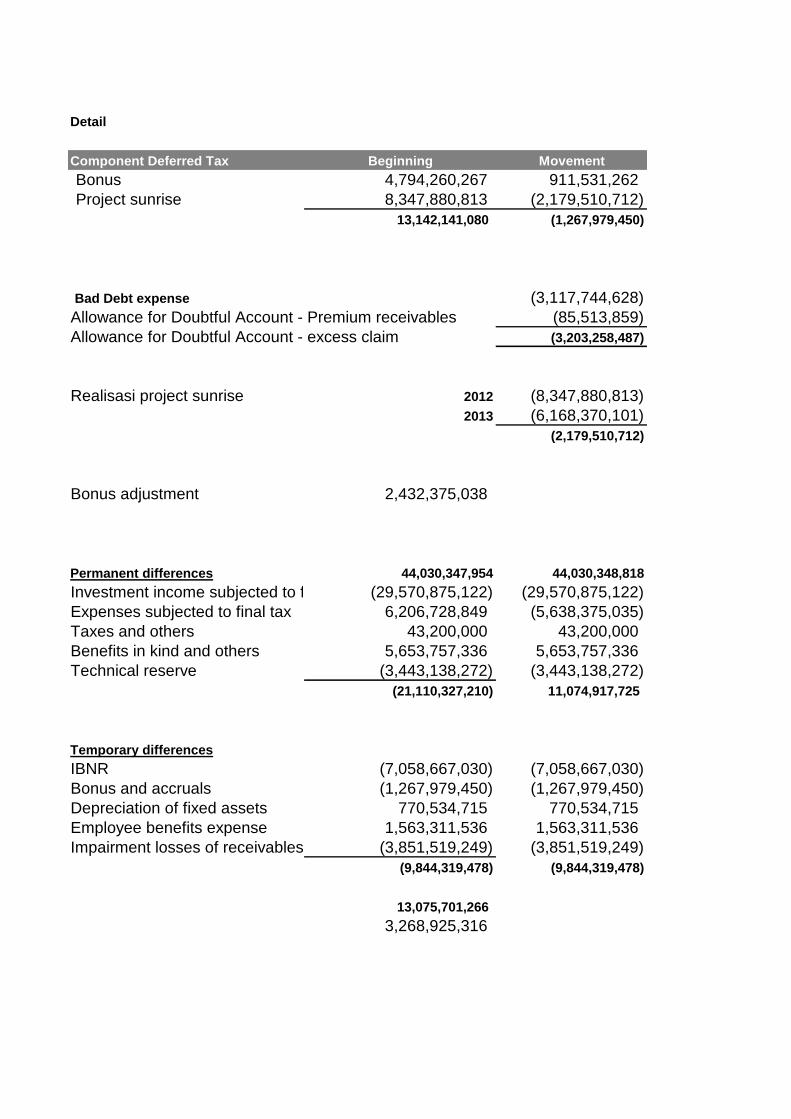
Detail
Component Deferred Tax Beginning Movement
Bonus 4,794,260,267 911,531,262
Project sunrise 8,347,880,813 (2,179,510,712)
13,142,141,080 (1,267,979,450)
Bad Debt expense (3,117,744,628)
Allowance for Doubtful Account - Premium receivables (85,513,859)
Allowance for Doubtful Account - excess claim (3,203,258,487)
Realisasi project sunrise 2012 (8,347,880,813)
2013 (6,168,370,101)
(2,179,510,712)
Bonus adjustment 2,432,375,038
Permanent differences 44,030,347,954 44,030,348,818
Investment income subjected to final tax (29,570,875,122) (29,570,875,122)
Expenses subjected to final tax 6,206,728,849 (5,638,375,035)
Taxes and others 43,200,000 43,200,000
Benefits in kind and others 5,653,757,336 5,653,757,336
Technical reserve (3,443,138,272) (3,443,138,272)
(21,110,327,210) 11,074,917,725
Temporary differences
IBNR (7,058,667,030) (7,058,667,030)
Bonus and accruals (1,267,979,450) (1,267,979,450)
Depreciation of fixed assets 770,534,715 770,534,715
Employee benefits expense 1,563,311,536 1,563,311,536
Impairment losses of receivables (3,851,519,249) (3,851,519,249)
(9,844,319,478) (9,844,319,478)
13,075,701,266
3,268,925,316

Notes for fiscal correction
TEMPORARY
############# ok
############# ok
############# ok
83,167,694,654 ok >> 40% was used for general insurance
(48,485,075,904) ok
34,682,618,750 ok
- 394,568,626,733 ok
############# ok
############# ok
- Technical reserve Fully corrected due to un-approved by OJK for claim reserve ( RNYA and IBNR)
(7,058,667,030) - IBNR Fully corrected due to un-approved by OJK for claim reserve ( RNYA and IBNR)
(11,485,862,044) Technical reserve Corrected due to investment income from UL
1,116,107,704 ok
515,386,624 4017002
(7,058,667,030) (310,055,772,216)
12,117,799,895 ok
5,087,383,852 ok
(7,058,667,030) 101,718,038,264
(44,094,691,146) ok
(596,403,054) ok
(244,705,750) ok
(2,088,479,132) ok
- Taxes and others NDE due to tax payment for employee
(494,500,604) ok
- ok
(911,906,800) ok
911,531,262 (2,104,908,502) Bonus and accruals ok
(938,414,566) ok
FISCAL CORRECTIONFISCAL
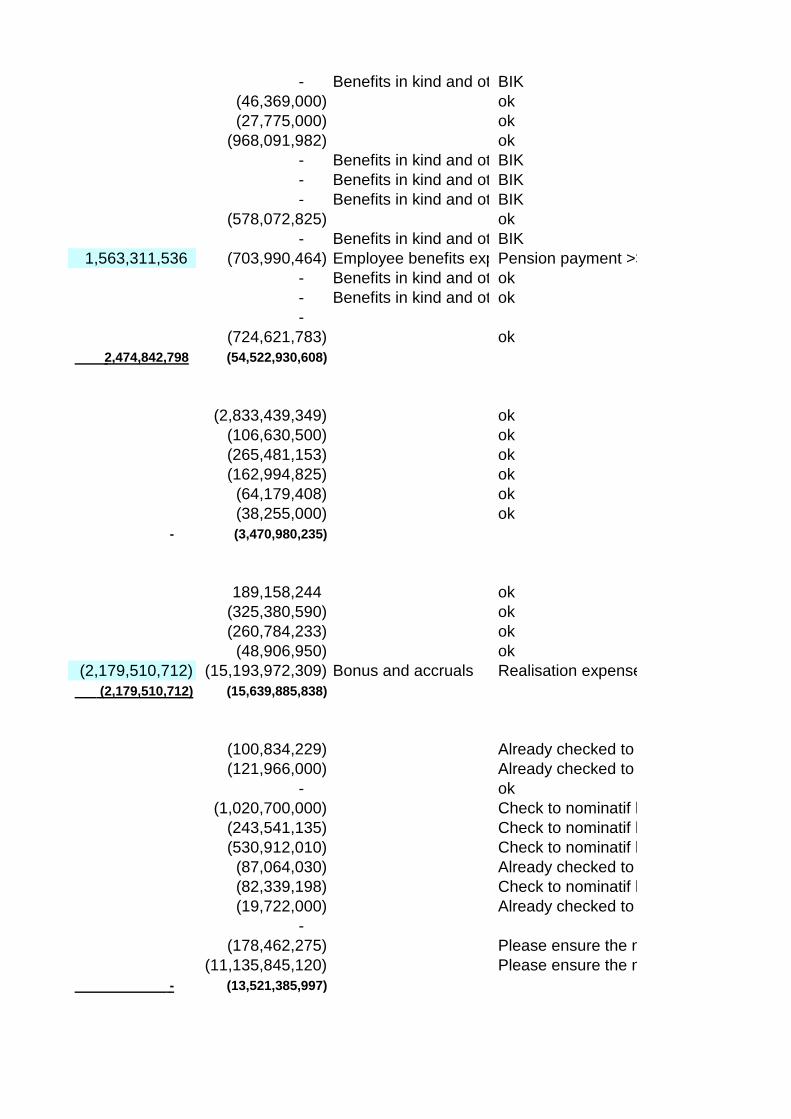
- Benefits in kind and othersBIK
(46,369,000) ok
(27,775,000) ok
(968,091,982) ok
- Benefits in kind and othersBIK
- Benefits in kind and othersBIK
- Benefits in kind and othersBIK
(578,072,825) ok
- Benefits in kind and othersBIK
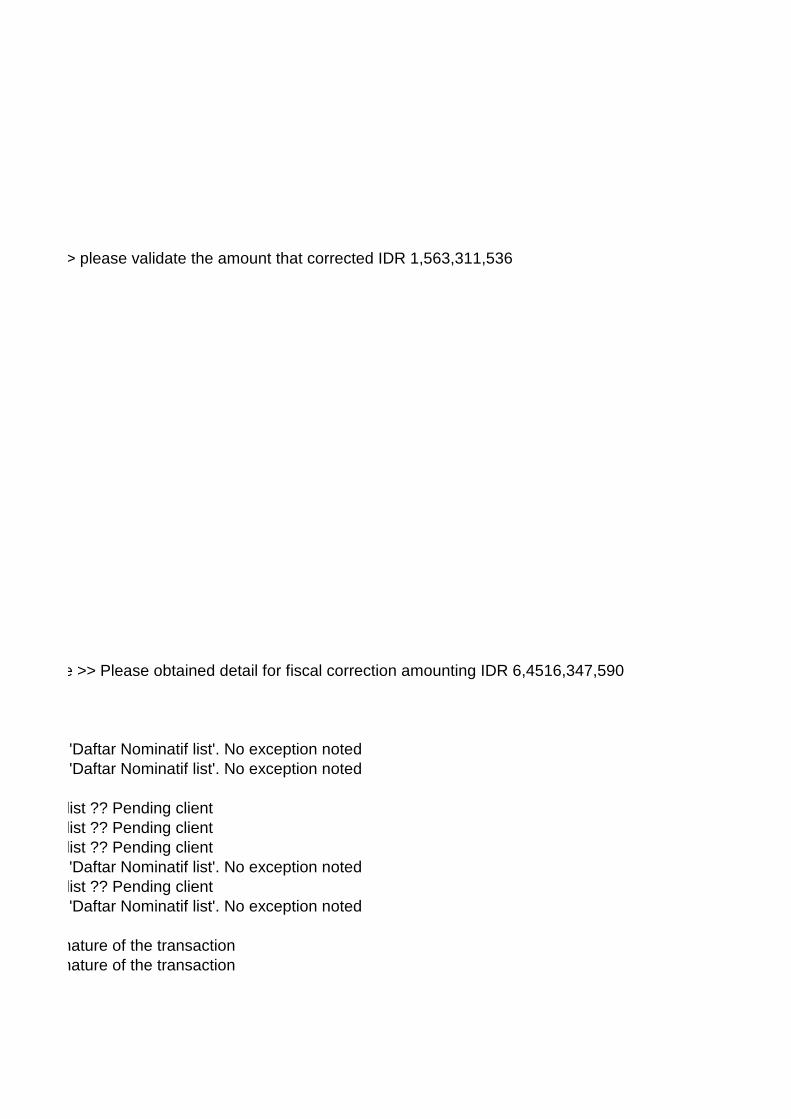
1,563,311,536 (703,990,464) Employee benefits expensePension payment >> please validate the amount that corrected IDR 1,563,311,536
- Benefits in kind and othersok
- Benefits in kind and othersok
-
(724,621,783) ok
2,474,842,798 (54,522,930,608)
(2,833,439,349) ok
(106,630,500) ok
(265,481,153) ok
(162,994,825) ok
(64,179,408) ok
(38,255,000) ok
- (3,470,980,235)
189,158,244 ok
(325,380,590) ok
(260,784,233) ok
(48,906,950) ok
(2,179,510,712) (15,193,972,309) Bonus and accruals Realisation expense >> Please obtained detail for fiscal correction amounting IDR 6,4516,347,590 (Sunrise project?)
(2,179,510,712) (15,639,885,838)
(100,834,229) Already checked to 'Daftar Nominatif list'. No exception noted
(121,966,000) Already checked to 'Daftar Nominatif list'. No exception noted
- ok
(1,020,700,000) Check to nominatif list ?? Pending client
(243,541,135) Check to nominatif list ?? Pending client
(530,912,010) Check to nominatif list ?? Pending client
(87,064,030) Already checked to 'Daftar Nominatif list'. No exception noted
(82,339,198) Check to nominatif list ?? Pending client
(19,722,000) Already checked to 'Daftar Nominatif list'. No exception noted
-
(178,462,275) Please ensure the nature of the transaction
(11,135,845,120) Please ensure the nature of the transaction
- (13,521,385,997)
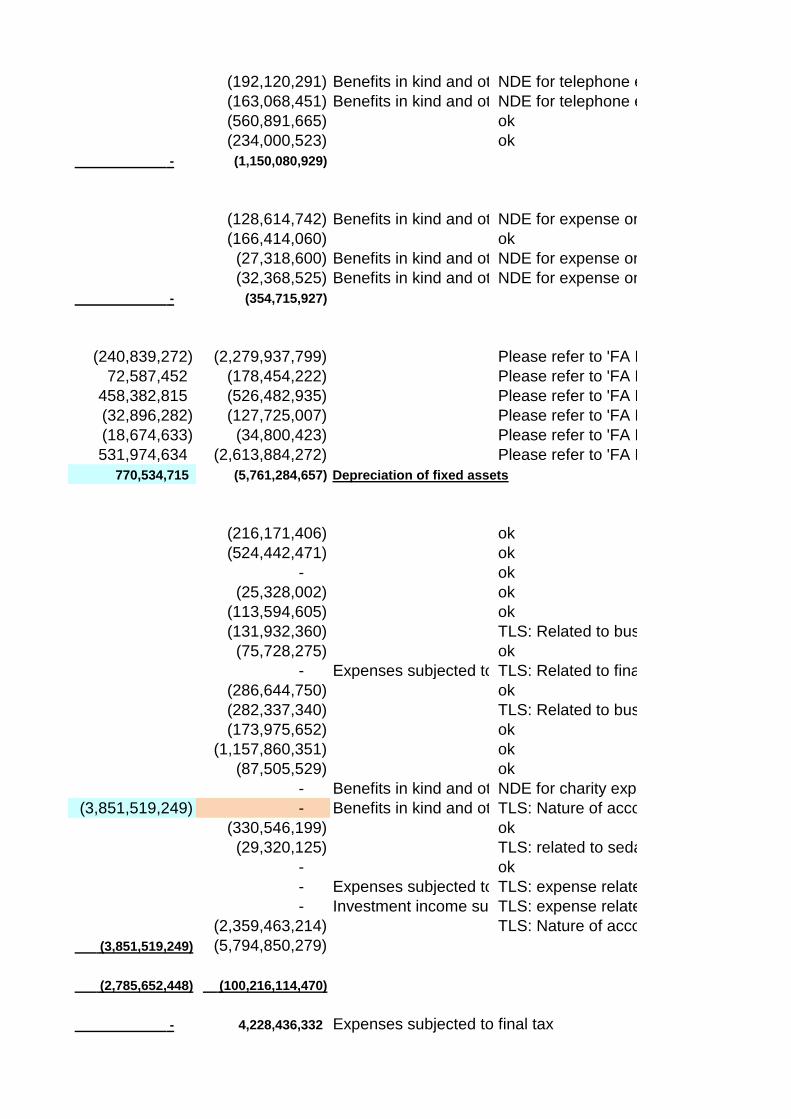
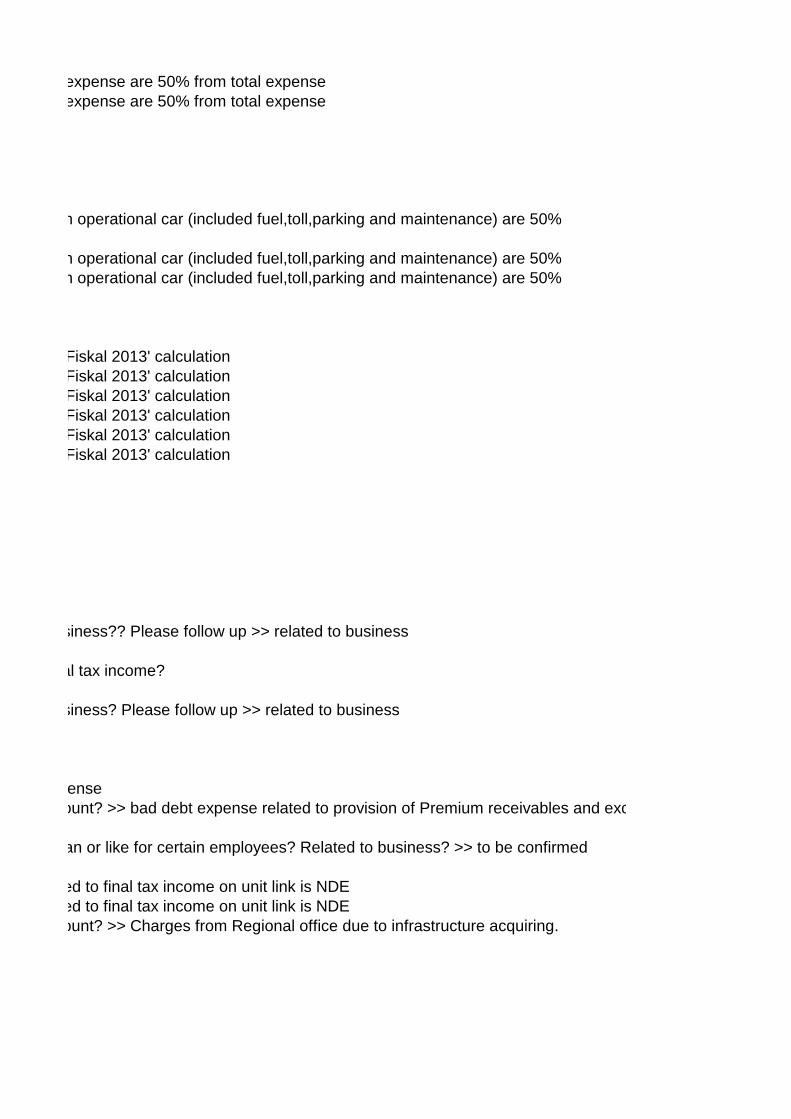
(192,120,291) Benefits in kind and othersNDE for telephone expense are 50% from total expense
(163,068,451) Benefits in kind and othersNDE for telephone expense are 50% from total expense
(560,891,665) ok
(234,000,523) ok
- (1,150,080,929)
(128,614,742) Benefits in kind and othersNDE for expense on operational car (included fuel,toll,parking and maintenance) are 50%
(166,414,060) ok
(27,318,600) Benefits in kind and othersNDE for expense on operational car (included fuel,toll,parking and maintenance) are 50%
(32,368,525) Benefits in kind and othersNDE for expense on operational car (included fuel,toll,parking and maintenance) are 50%
- (354,715,927)
(240,839,272) (2,279,937,799) Please refer to 'FA Fiskal 2013' calculation
72,587,452 (178,454,222) Please refer to 'FA Fiskal 2013' calculation
458,382,815 (526,482,935) Please refer to 'FA Fiskal 2013' calculation
(32,896,282) (127,725,007) Please refer to 'FA Fiskal 2013' calculation
(18,674,633) (34,800,423) Please refer to 'FA Fiskal 2013' calculation
531,974,634 (2,613,884,272) Please refer to 'FA Fiskal 2013' calculation
770,534,715 (5,761,284,657) Depreciation of fixed assets
(216,171,406) ok
(524,442,471) ok
- ok
(25,328,002) ok
(113,594,605) ok
(131,932,360) TLS: Related to business?? Please follow up >> related to business
(75,728,275) ok
- Expenses subjected to final taxTLS: Related to final tax income?
(286,644,750) ok
(282,337,340) TLS: Related to business? Please follow up >> related to business
(173,975,652) ok
(1,157,860,351) ok
(87,505,529) ok
- Benefits in kind and othersNDE for charity expense
(3,851,519,249) - Benefits in kind and othersTLS: Nature of account? >> bad debt expense related to provision of Premium receivables and excess claim balance
(330,546,199) ok
(29,320,125) TLS: related to sedan or like for certain employees? Related to business? >> to be confirmed
- ok
- Expenses subjected to final taxTLS: expense related to final tax income on unit link is NDE
- Investment income subjected to final taxTLS: expense related to final tax income on unit link is NDE
(2,359,463,214) TLS: Nature of account? >> Charges from Regional office due to infrastructure acquiring.
(3,851,519,249) (5,794,850,279)
(2,785,652,448) (100,216,114,470)
- 4,228,436,332 Expenses subjected to final tax

(2,785,652,448) (95,987,678,138)
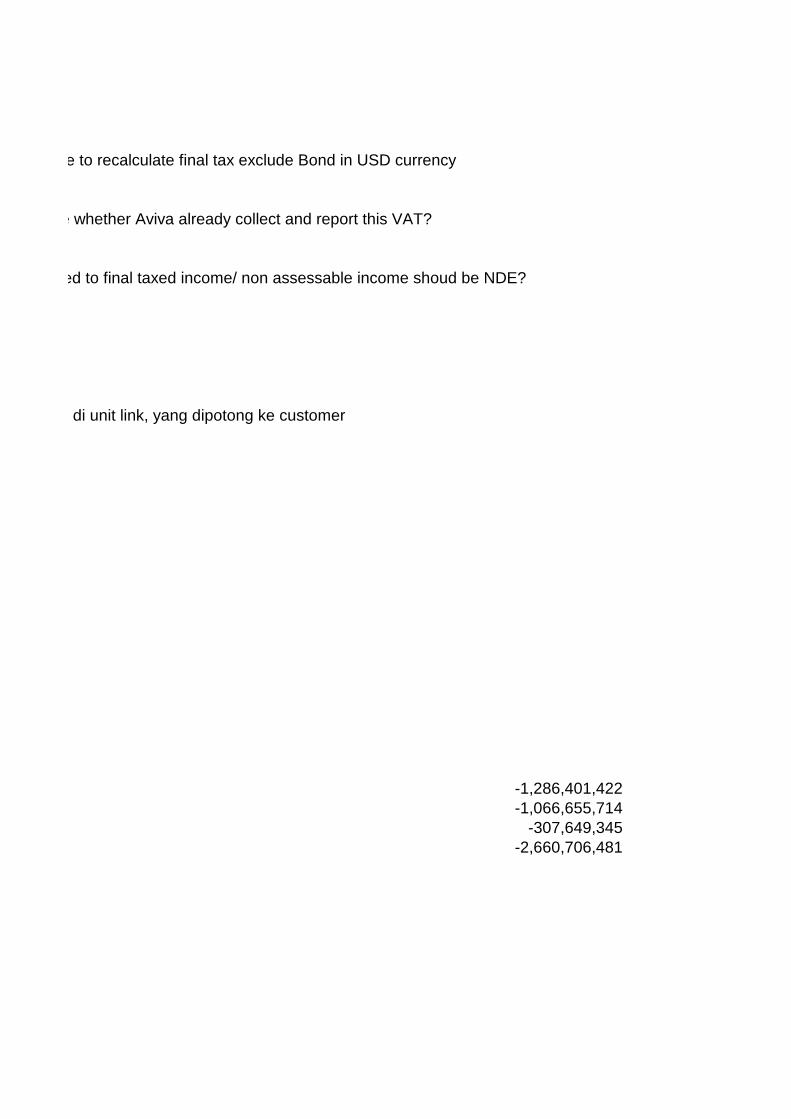
- Investment income subjected to final taxPlease gross up due to recalculate final tax exclude Bond in USD currency
- Investment income subjected to final taxok
- ok
7,049,614,546 TLS: Please ensure whether Aviva already collect and report this VAT?
3,352,300 ok
(599,888,740) ok
- Investment income subjected to final taxTLS: expense related to final taxed income/ non assessable income shoud be NDE?
1,425,545,245 Expenses subjected to final tax
- 7,878,623,350
283,739,752 TLS: ?? Biaya yang di unit link, yang dipotong ke customer
(2,171,607,910) TLS: ??
(4,021,972,218) TLS: ??
1,588,853,968 TLS: ??
577,503,712
2,087,820,248 TLS: ??
(13)
7,787,626
1,120,067,789
(5,475,165)
- (533,282,211)
(9,844,319,478) 13,075,701,266 13,075,701,266 (0)
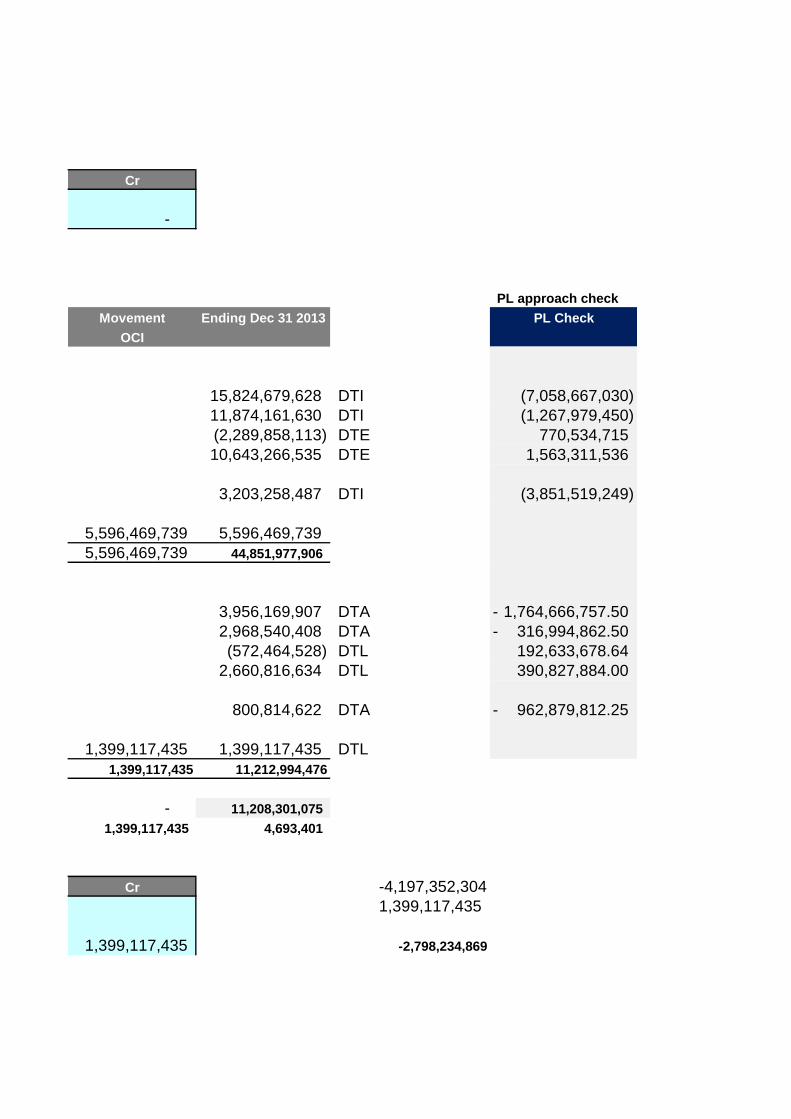
Cr
-
PL approach check
Movement Ending Dec 31 2013 PL Check
OCI
15,824,679,628 DTI (7,058,667,030)
11,874,161,630 DTI (1,267,979,450)
(2,289,858,113) DTE 770,534,715
10,643,266,535 DTE 1,563,311,536
3,203,258,487 DTI (3,851,519,249)
5,596,469,739 5,596,469,739
5,596,469,739 44,851,977,906
3,956,169,907 DTA 1,764,666,757.50-
2,968,540,408 DTA 316,994,862.50-
(572,464,528) DTL 192,633,678.64
2,660,816,634 DTL 390,827,884.00
800,814,622 DTA 962,879,812.25-
1,399,117,435 1,399,117,435 DTL
1,399,117,435 11,212,994,476
- 11,208,301,075
1,399,117,435 4,693,401
Cr -4,197,352,304
1,399,117,435
1,399,117,435 -2,798,234,869

Ending Dec 31 2013
5,705,791,529
6,168,370,101
11,874,161,630

Notes for fiscal correction Notes:
40% untuk UPR >> from PwC
SF consulting >> 40% untuk UPR
ok >> 40% was used for general insurance
Fully corrected due to un-approved by OJK for claim reserve ( RNYA and IBNR)
Fully corrected due to un-approved by OJK for claim reserve ( RNYA and IBNR)
Corrected due to investment income from UL
Change in LTB - Provision UPR - Direct
NDE due to tax payment for employee
Pension payment >> please validate the amount that corrected IDR 1,563,311,536
Realisation expense >> Please obtained detail for fiscal correction amounting IDR 6,4516,347,590 (Sunrise project?)
Already checked to 'Daftar Nominatif list'. No exception noted
Already checked to 'Daftar Nominatif list'. No exception noted
Check to nominatif list ?? Pending client
Check to nominatif list ?? Pending client
Check to nominatif list ?? Pending client
Already checked to 'Daftar Nominatif list'. No exception noted
Check to nominatif list ?? Pending client
Already checked to 'Daftar Nominatif list'. No exception noted
Please ensure the nature of the transaction
Please ensure the nature of the transaction
NDE for telephone expense are 50% from total expense
NDE for telephone expense are 50% from total expense
NDE for expense on operational car (included fuel,toll,parking and maintenance) are 50%
NDE for expense on operational car (included fuel,toll,parking and maintenance) are 50%
NDE for expense on operational car (included fuel,toll,parking and maintenance) are 50%
Please refer to 'FA Fiskal 2013' calculation
Please refer to 'FA Fiskal 2013' calculation
Please refer to 'FA Fiskal 2013' calculation
Please refer to 'FA Fiskal 2013' calculation
Please refer to 'FA Fiskal 2013' calculation
Please refer to 'FA Fiskal 2013' calculation
TLS: Related to business?? Please follow up >> related to business
TLS: Related to final tax income?
TLS: Related to business? Please follow up >> related to business
NDE for charity expense
TLS: Nature of account? >> bad debt expense related to provision of Premium receivables and excess claim balance
TLS: related to sedan or like for certain employees? Related to business? >> to be confirmed
TLS: expense related to final tax income on unit link is NDE
TLS: expense related to final tax income on unit link is NDE
TLS: Nature of account? >> Charges from Regional office due to infrastructure acquiring.
Please gross up due to recalculate final tax exclude Bond in USD currency
TLS: Please ensure whether Aviva already collect and report this VAT?
TLS: expense related to final taxed income/ non assessable income shoud be NDE?
TLS: ?? Biaya yang di unit link, yang dipotong ke customer
-1,286,401,422
-1,066,655,714
-307,649,345
-2,660,706,481
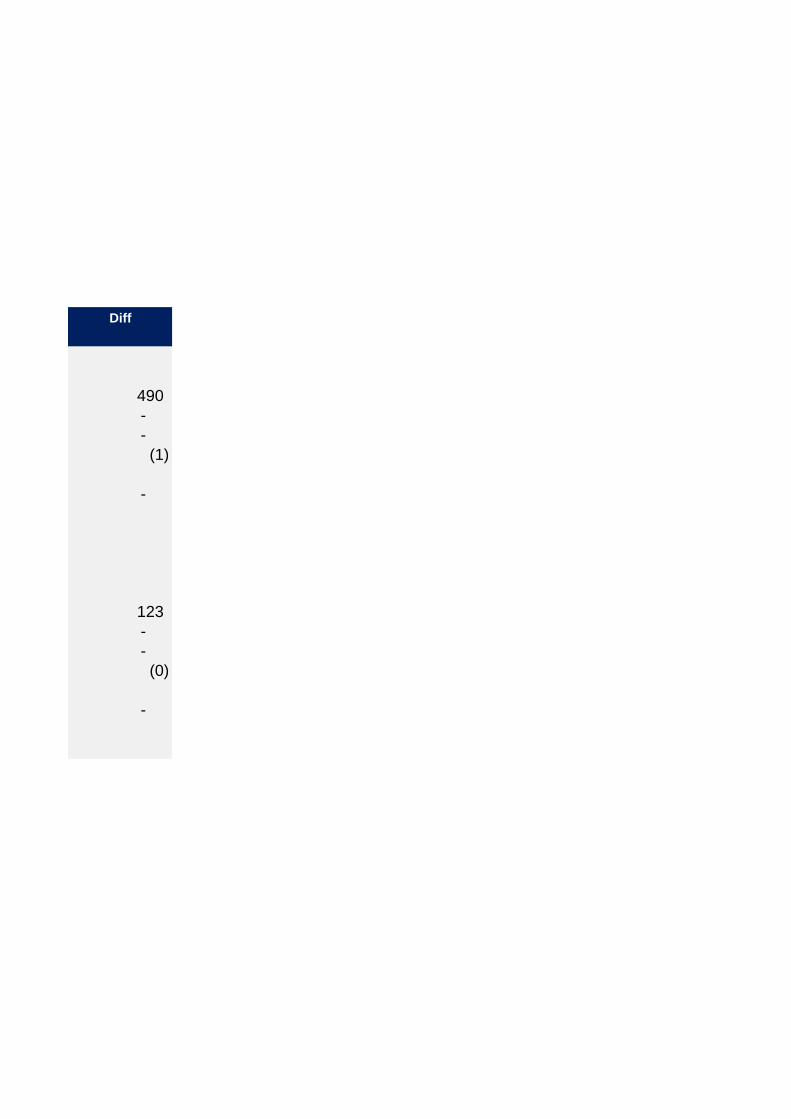
Diff
490
-
-
(1)
-
123
-
-
(0)
-


SF consulting >> 40% untuk UPR

Realisation expense >> Please obtained detail for fiscal correction amounting IDR 6,4516,347,590 (Sunrise project?)

TLS: Nature of account? >> bad debt expense related to provision of Premium receivables and excess claim balance