pengantar riset pemasaran - diib.ui.ac.id · pengantar riset pemasaran. ... analisis bisnis...
TRANSCRIPT
PengantarRiset Pemasaran

Definisi Pemasaran
Pemasaran adalah suatu proses sosial dimana ada kelompok masyarakat ataupun individu
ingin memenuhi kebutuhan dan keinginannya melalui suatu kegiatan menciptakan,
menawarkan dan mempertukarkan secara bebas produk ataupun jasa yang bernilai
dengan pihak lain- Philip Kotler (p. 7)
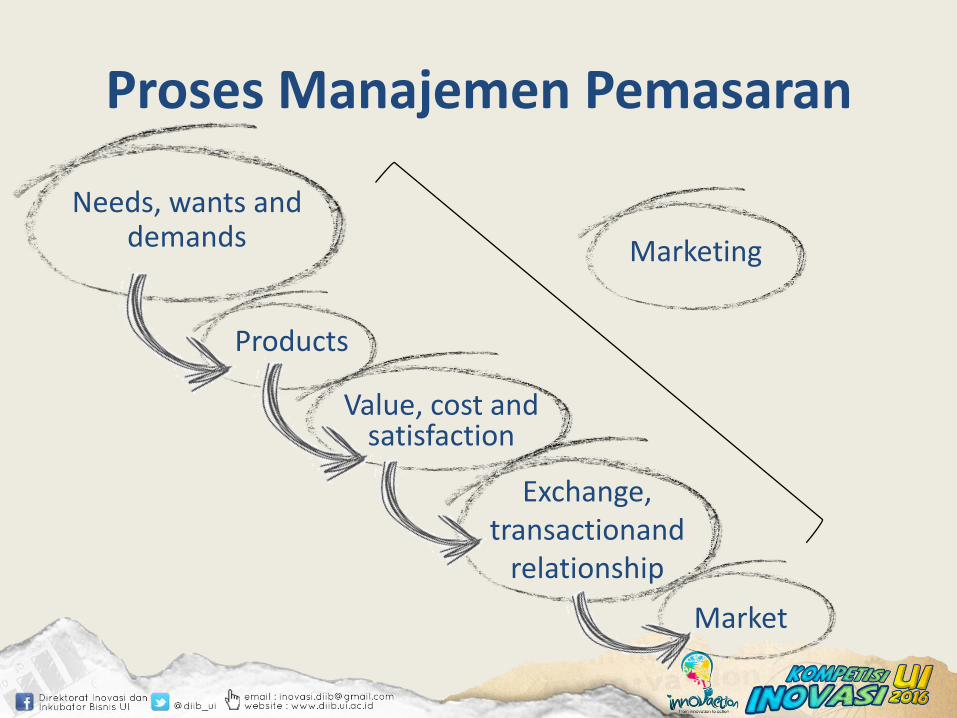
Proses Manajemen Pemasaran
Needs, wants and demands
Products
Value, cost and satisfaction
Exchange, transactionand
relationship
Market
Marketing
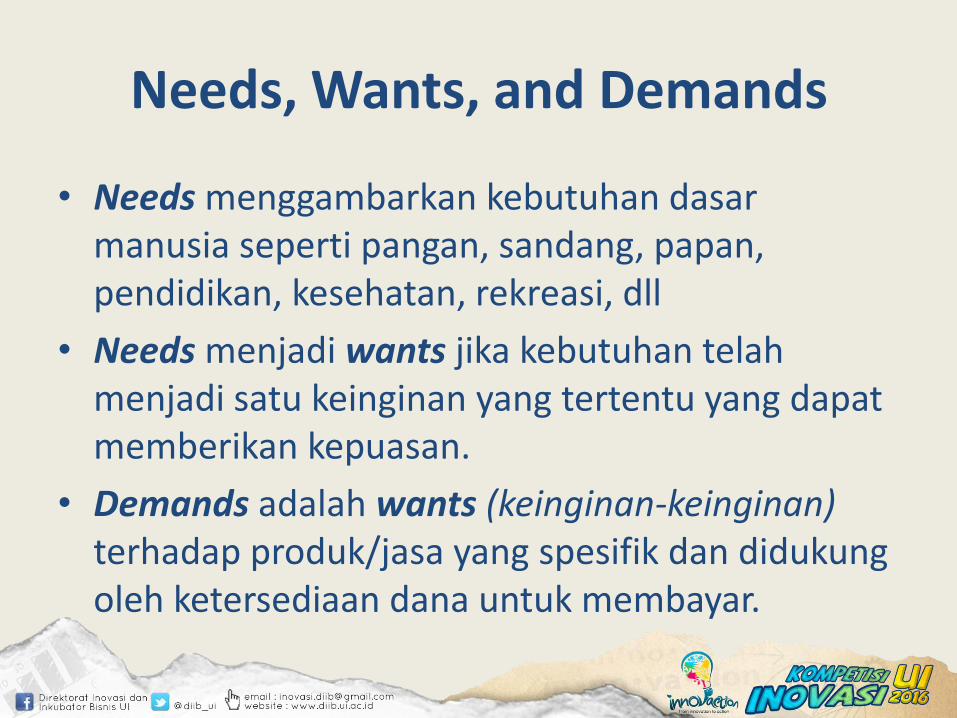
Needs, Wants, and Demands
• Needs menggambarkan kebutuhan dasarmanusia seperti pangan, sandang, papan, pendidikan, kesehatan, rekreasi, dll
• Needs menjadi wants jika kebutuhan telahmenjadi satu keinginan yang tertentu yang dapatmemberikan kepuasan.
• Demands adalah wants (keinginan-keinginan)terhadap produk/jasa yang spesifik dan didukungoleh ketersediaan dana untuk membayar.
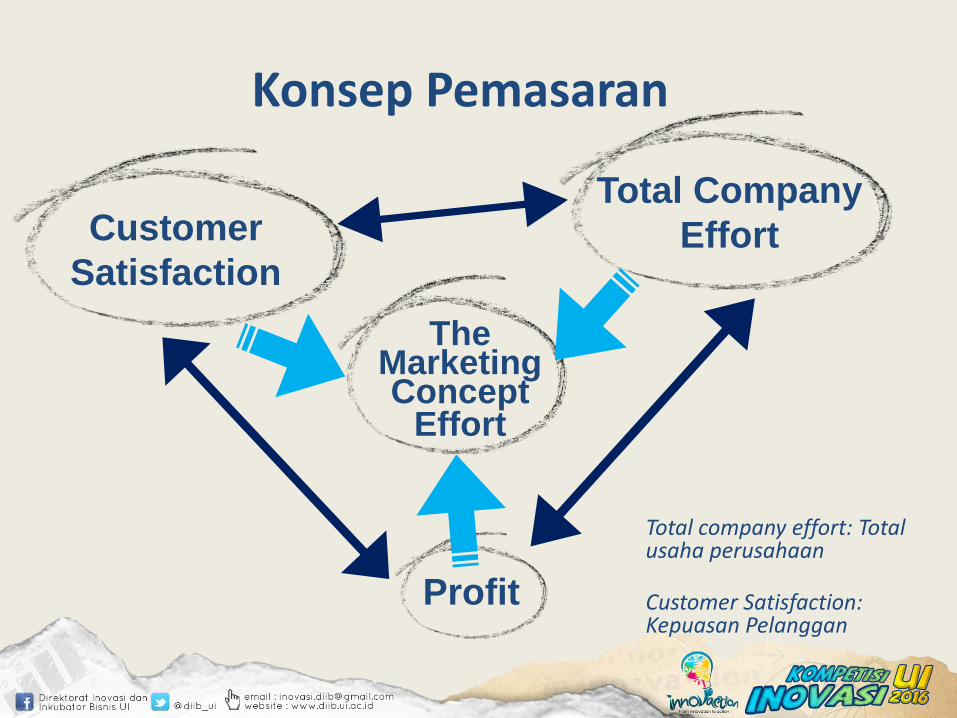
Konsep Pemasaran
Profit
Total company effort: Total usaha perusahaan
Customer Satisfaction: Kepuasan Pelanggan
Total Company
Effort
TheMarketing Concept
Effort
Customer
Satisfaction
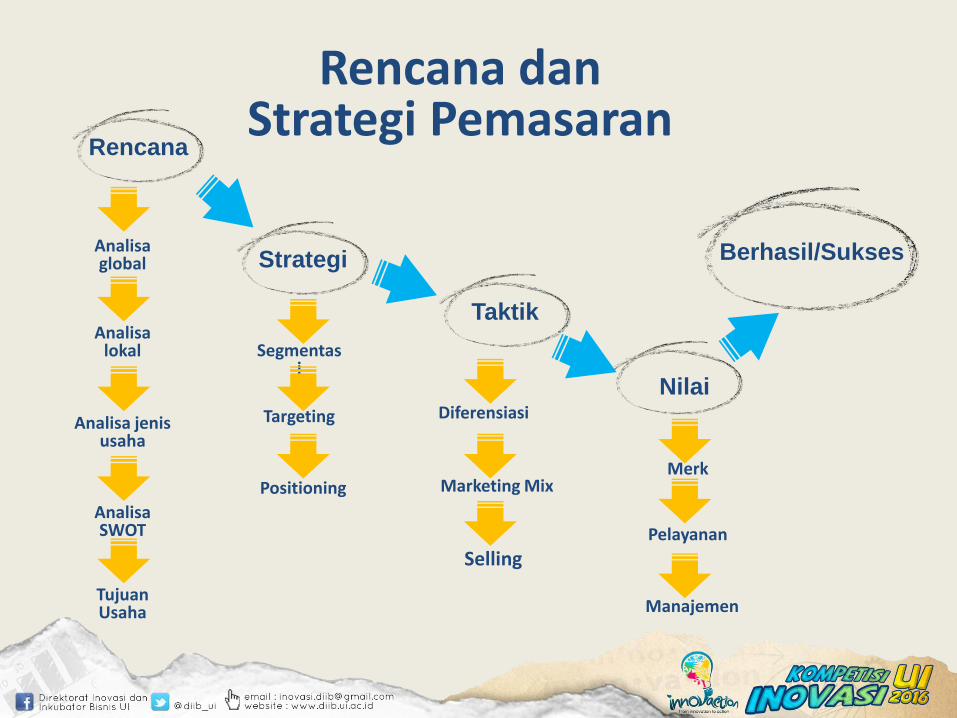
Rencana danStrategi Pemasaran
Rencana
Strategi
Taktik
Nilai
Berhasil/SuksesAnalisa global
Analisa lokal
Analisa jenis usaha
Analisa SWOT
Tujuan Usaha
Segmentasi
Targeting
Positioning
Diferensiasi
Marketing Mix
Selling
Merk
Pelayanan
Manajemen
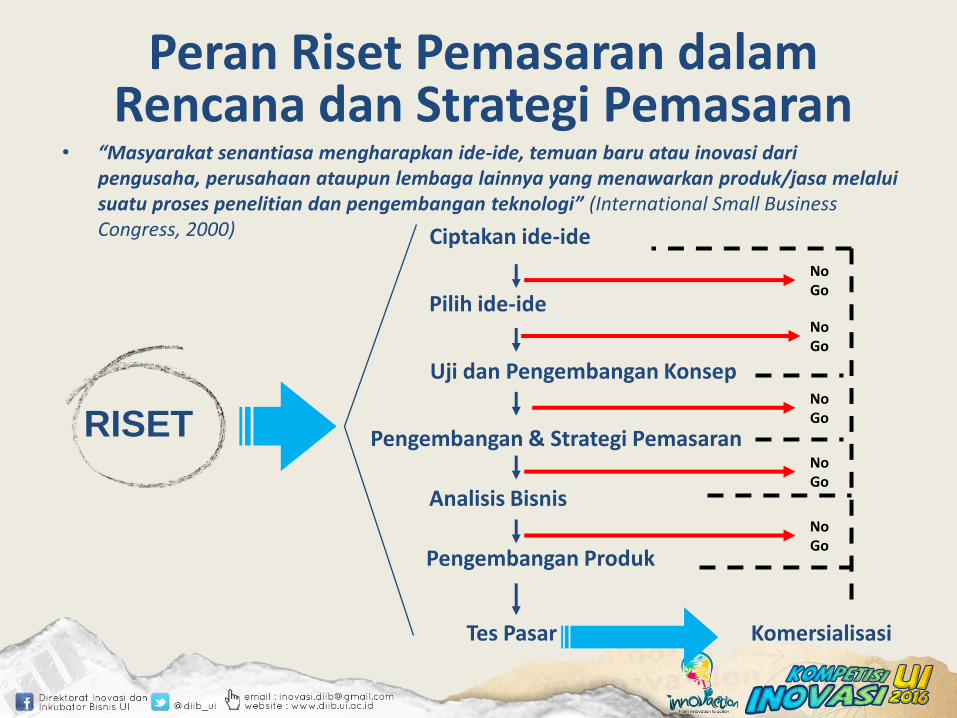
• “Masyarakat senantiasa mengharapkan ide-ide, temuan baru atau inovasi dari pengusaha, perusahaan ataupun lembaga lainnya yang menawarkan produk/jasa melalui suatu proses penelitian dan pengembangan teknologi” (International Small Business Congress, 2000)
Peran Riset Pemasaran dalamRencana dan Strategi Pemasaran
RISET
No Go
No Go
No Go
No Go
No Go
Ciptakan ide-ide
Pilih ide-ide
Uji dan Pengembangan Konsep
Pengembangan & Strategi Pemasaran
Analisis Bisnis
Pengembangan Produk
Tes Pasar Komersialisasi
• Menurut Maholtra dalam American Marketing Association (AMA) mengatakan bahwa riset pemasaran adalah identifikasi, pengumpulan, analisis, dan penyebaran (pembagian) informasiyang sistematis dan objektif untuk meningkatkan pengambilankeputusan yang berhubungan dengan identifikasi dan solusimasalah-masalah dan kesempatan-kesempatan dalam pemasaran.
• Hasil dari riset pasar akan menghubungkan antara pemasar dengankonsumen dengan cara menyediakan informasi penting yang dapatdigunakan untuk menyelesaikan masalah terkait pemasaran sertamembantu dalam pengambilan keputusan pemasaran.
• Riset pasar dapat membantu perusahaan untuk menciptakan sertamengembangkan produk yang mutakhir serta sesuai dengankebutuhan konsumen.
Riset Pasar
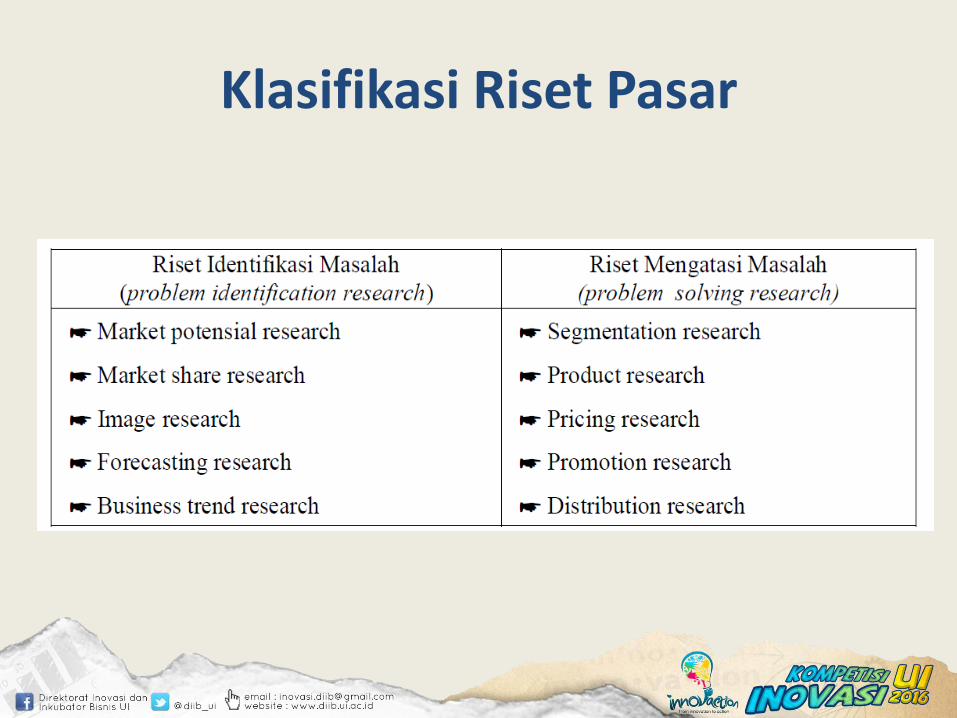
Klasifikasi Riset Pasar
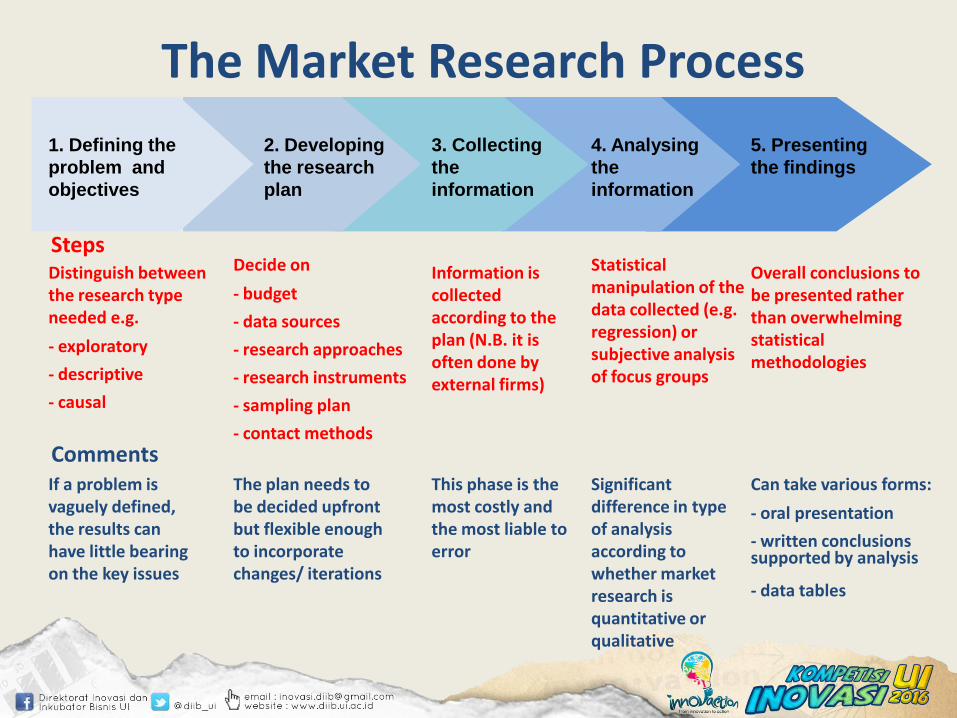
The Market Research Process
Significant difference in type of analysis according to whether market research is quantitative or qualitative
Comments
Distinguish between the research type needed e.g.
- exploratory
- descriptive
- causal
Decide on
- budget
- data sources
- research approaches
- research instruments
- sampling plan
- contact methods
Information is collected according to the plan (N.B. it is often done by external firms)
Statistical manipulation of the data collected (e.g. regression) or subjective analysis of focus groups
Overall conclusions to be presented rather than overwhelming statistical methodologies
If a problem is vaguely defined, the results can have little bearing on the key issues
The plan needs to be decided upfront but flexible enough to incorporate changes/ iterations
This phase is the most costly and the most liable to error
Can take various forms:
- oral presentation
- written conclusions supported by analysis
- data tables
Steps
1. Defining the
problem and
objectives
2. Developing
the research
plan
3. Collecting
the
information
4. Analysing
the
information
5. Presenting
the findings
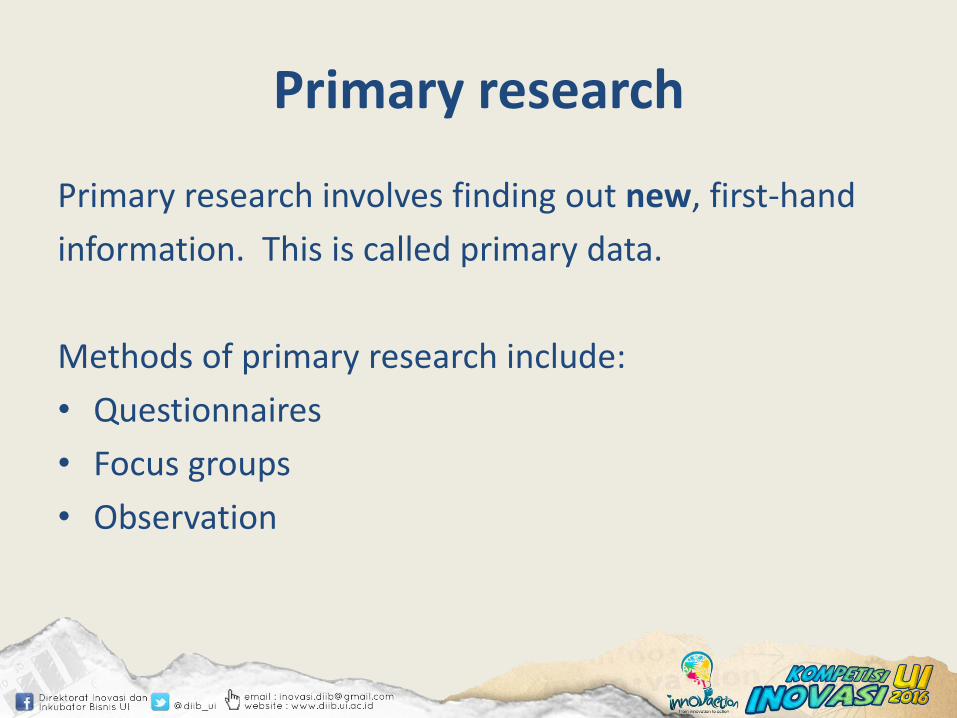
Primary research
Primary research involves finding out new, first-hand
information. This is called primary data.
Methods of primary research include:
• Questionnaires
• Focus groups
• Observation
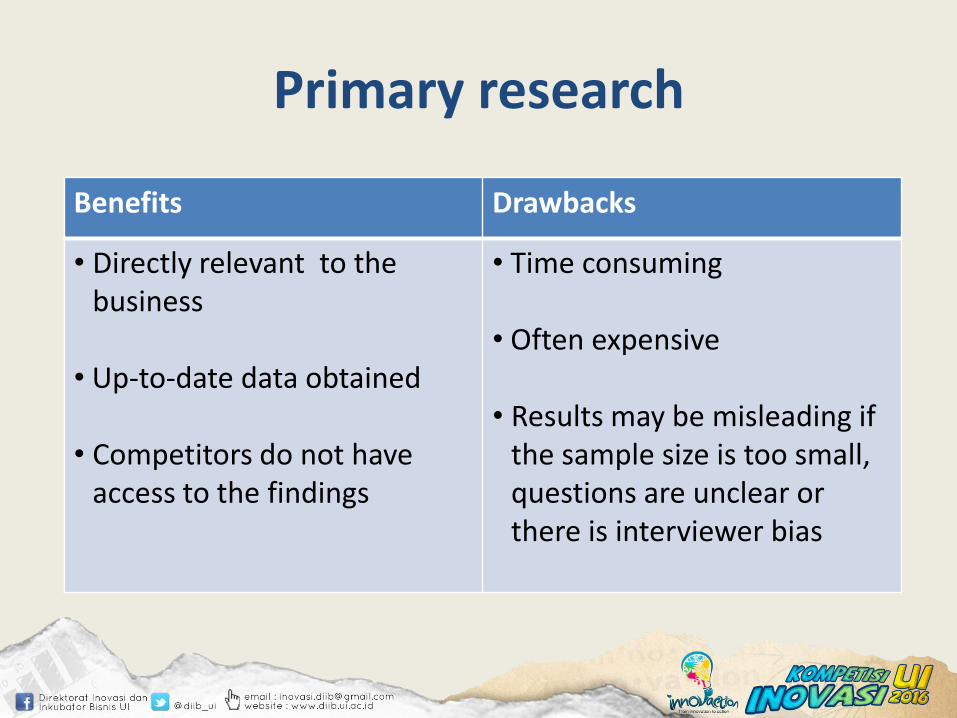
Primary research
Benefits Drawbacks
• Directly relevant to the business
• Up-to-date data obtained
• Competitors do not have access to the findings
• Time consuming
• Often expensive
• Results may be misleading if the sample size is too small, questions are unclear or there is interviewer bias
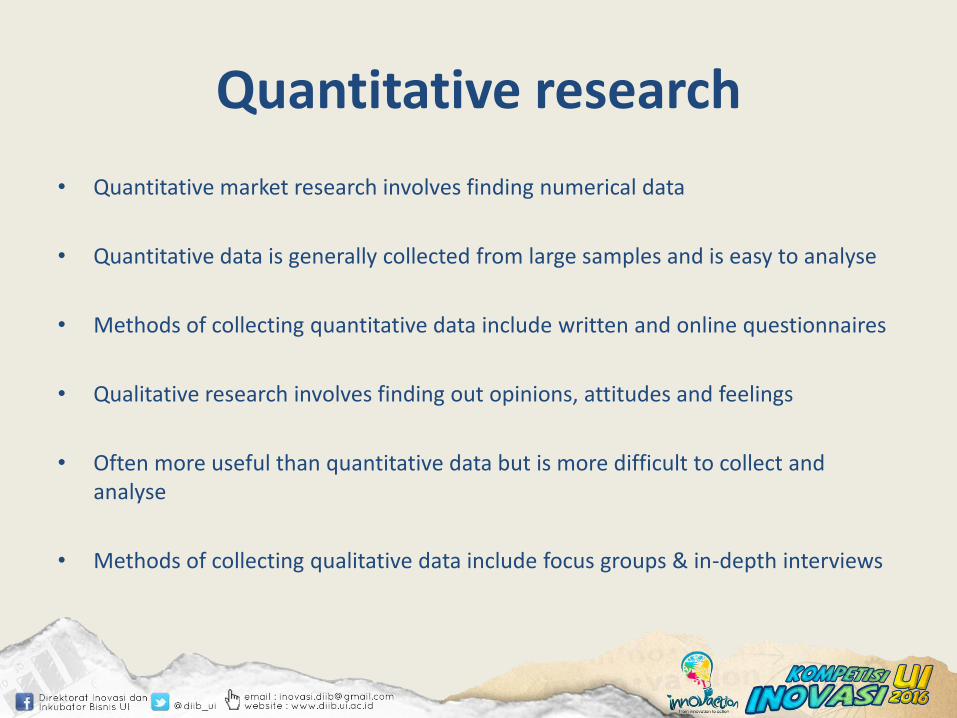
Quantitative research
• Quantitative market research involves finding numerical data
• Quantitative data is generally collected from large samples and is easy to analyse
• Methods of collecting quantitative data include written and online questionnaires
• Qualitative research involves finding out opinions, attitudes and feelings
• Often more useful than quantitative data but is more difficult to collect and analyse
• Methods of collecting qualitative data include focus groups & in-depth interviews
Sampling
Sampling is the method of choosing a smaller, representative group of respondents with which to conduct research instead of the whole population.
Sampling reduces the cost and time to carry out research. Careful sampling can provide reliable data about the population.
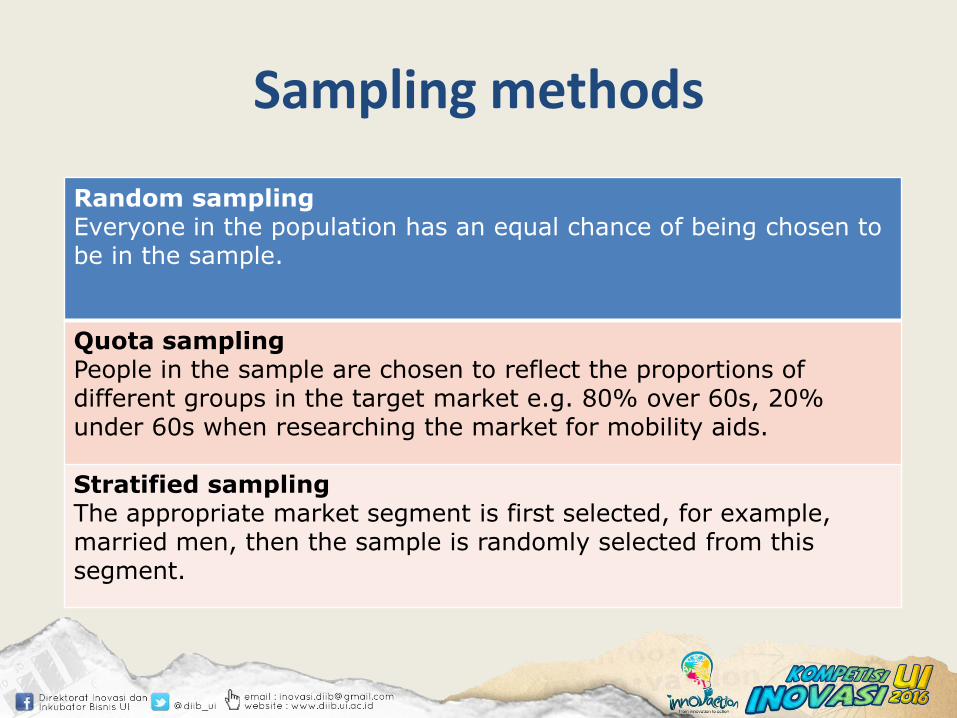
Sampling methods
Random samplingEveryone in the population has an equal chance of being chosen to be in the sample.
Quota samplingPeople in the sample are chosen to reflect the proportions of different groups in the target market e.g. 80% over 60s, 20% under 60s when researching the market for mobility aids.
Stratified samplingThe appropriate market segment is first selected, for example, married men, then the sample is randomly selected from this segment.
Reliability of sampling
The larger the sample size, the more reliable it is likely to be. However, larger samples incur greater costs.
A 95% confidence level is usually expected when conducting research. This means that findings are likely to be correct 19 times out of 20.
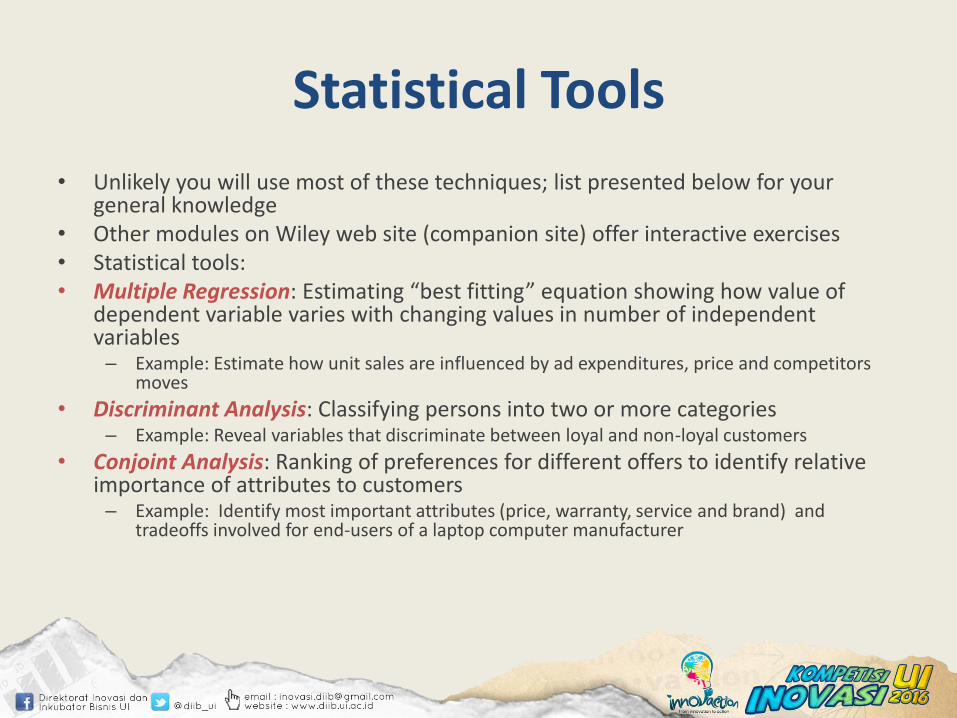
Statistical Tools
• Unlikely you will use most of these techniques; list presented below for your general knowledge
• Other modules on Wiley web site (companion site) offer interactive exercises• Statistical tools:• Multiple Regression: Estimating “best fitting” equation showing how value of
dependent variable varies with changing values in number of independent variables– Example: Estimate how unit sales are influenced by ad expenditures, price and competitors
moves
• Discriminant Analysis: Classifying persons into two or more categories– Example: Reveal variables that discriminate between loyal and non-loyal customers
• Conjoint Analysis: Ranking of preferences for different offers to identify relative importance of attributes to customers– Example: Identify most important attributes (price, warranty, service and brand) and
tradeoffs involved for end-users of a laptop computer manufacturer
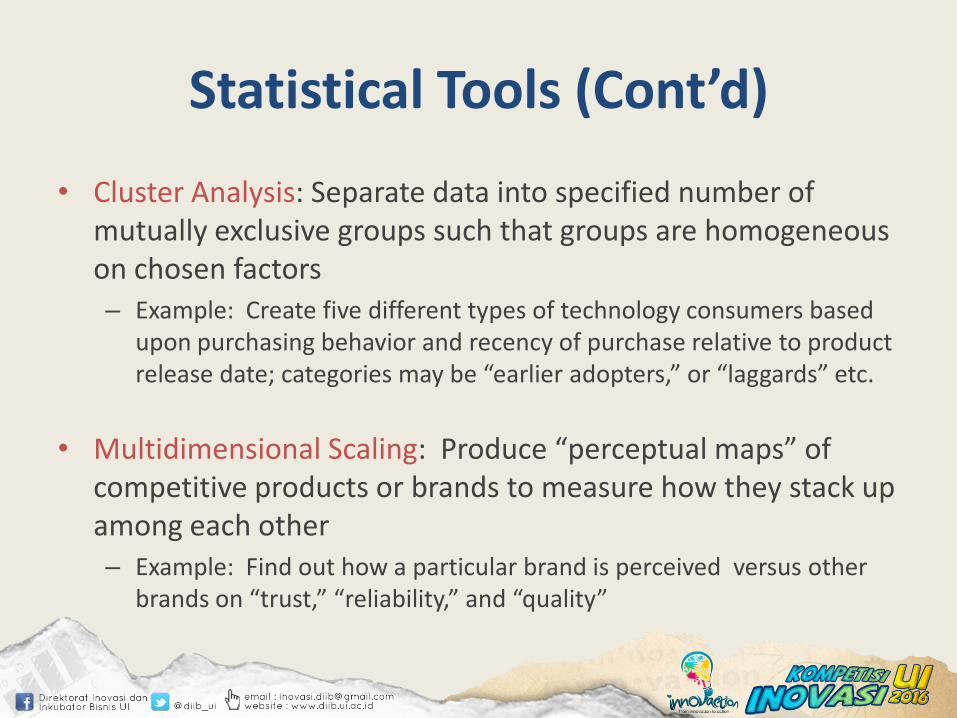
Statistical Tools (Cont’d)
• Cluster Analysis: Separate data into specified number of mutually exclusive groups such that groups are homogeneous on chosen factors– Example: Create five different types of technology consumers based
upon purchasing behavior and recency of purchase relative to product release date; categories may be “earlier adopters,” or “laggards” etc.
• Multidimensional Scaling: Produce “perceptual maps” of competitive products or brands to measure how they stack up among each other– Example: Find out how a particular brand is perceived versus other
brands on “trust,” “reliability,” and “quality”

Defining Market Opportunity, Market
Segment And Target Market
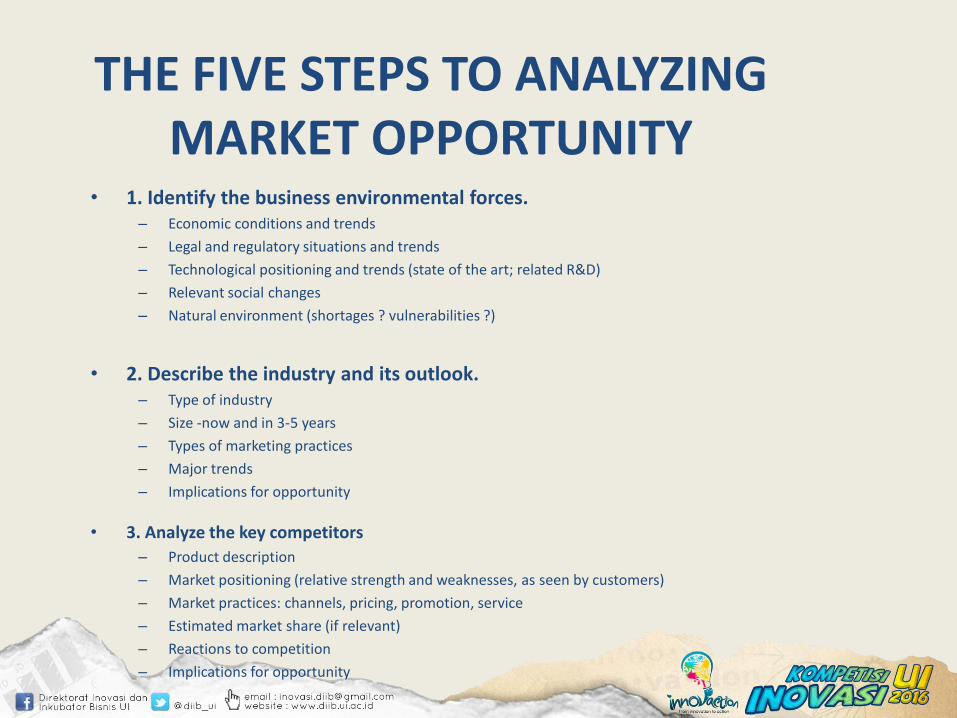
THE FIVE STEPS TO ANALYZING MARKET OPPORTUNITY
• 1. Identify the business environmental forces.– Economic conditions and trends
– Legal and regulatory situations and trends
– Technological positioning and trends (state of the art; related R&D)
– Relevant social changes
– Natural environment (shortages ? vulnerabilities ?)
• 2. Describe the industry and its outlook.– Type of industry
– Size -now and in 3-5 years
– Types of marketing practices
– Major trends
– Implications for opportunity
• 3. Analyze the key competitors
– Product description
– Market positioning (relative strength and weaknesses, as seen by customers)
– Market practices: channels, pricing, promotion, service
– Estimated market share (if relevant)
– Reactions to competition
– Implications for opportunity
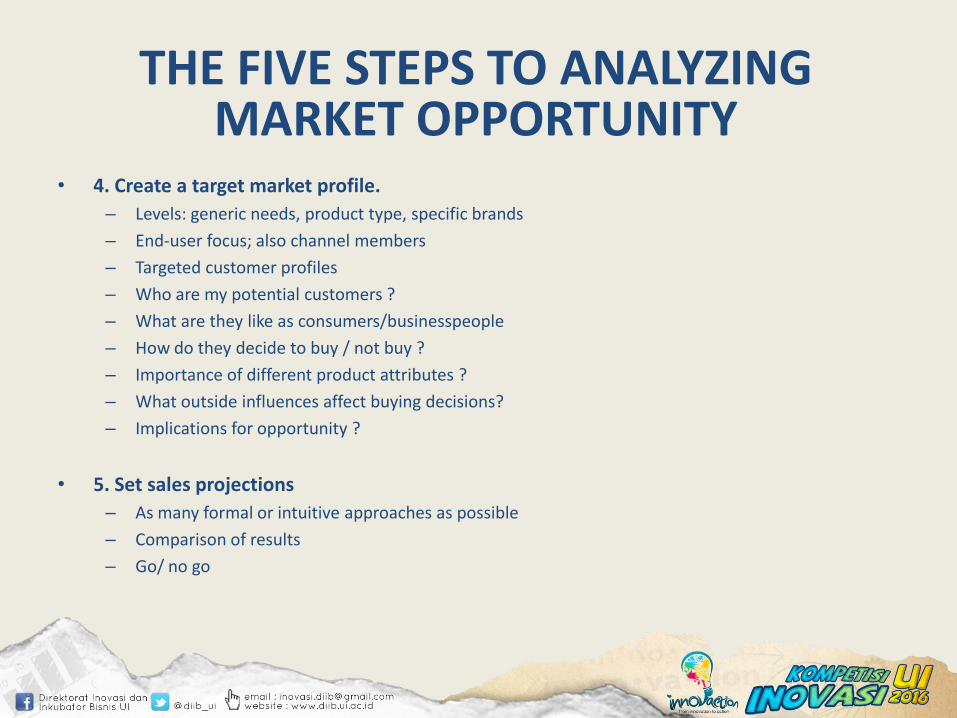
• 4. Create a target market profile.
– Levels: generic needs, product type, specific brands
– End-user focus; also channel members
– Targeted customer profiles
– Who are my potential customers ?
– What are they like as consumers/businesspeople
– How do they decide to buy / not buy ?
– Importance of different product attributes ?
– What outside influences affect buying decisions?
– Implications for opportunity ?
• 5. Set sales projections
– As many formal or intuitive approaches as possible
– Comparison of results
– Go/ no go
THE FIVE STEPS TO ANALYZING MARKET OPPORTUNITY
Segmentasi Pasar
Suatu proses membagi pasar ke dalam sekelompokpelangan yang memiliki perilaku yang sama atau
memiliki kebutuhan yang serupa.
Dasar segmentasi yaitu faktor-faktor yang mempengaruhi tuntutan atau respon pelanggan yang
berbeda
Monitor Environmental Forces
• Demographic
• Economic
• Natural
• Technological
• Political/Legal
• Sociocultural
Why We Segment
Segmentation offers 3 principal benefits:
1. IDs opportunities for new product development.
2. Assists in development of effective marketing programs.
3. Improves allocation of limited marketing resources.
Market Segmentation
• Identify distinct groups of buyers who might require separate products and/or marketing mixes.
• Profile these buyers:– Who are they?
– What do they want to buy?
– How do they want to buy?
– When do they want to buy?
– Where do they want to buy?
– Why do they want to buy?
Market Targeting
Sellers• distinguish major market segments, • target 1 or more, and • develop products & • marketing programs tailored to each
segment.
Levels of Market Segmentation
Mass Marketing
Seller engages in mass production, mass distribution, and mass promotion of one product for all buyers.
• Creates largest potential market
• Leads to lowest costs
• Leads to lower prices or higher margins
• Proliferation of advertising media and distribution channels make it difficult
Levels of Market Segmentation
Multi-Segment Marketing
Seller recognizes that buyers differ in their wants, purchasing power, geographic locations, buying attitudes & buying habits. Major segments are identified & products and marketing mixes developed for each.
• Product offer & prices can be fine-tuned
• Choice of Dist./Promo. channels easier

Levels of Market Segmentation
Sequential Segmentation
Businesses may lack sufficient resources to pursue several attractive market segments.
• Tackle most attractive segment first.
• Using profits earned from this segment, then target the next most attractive segment.
• Runs the risk of allowing potential competitors into a market.
Levels of Market Segmentation
Niche Marketing• Niche customers have a distinct and complete set of needs.
• They will pay a price premium to have their special needs met.
• The niche is not likely to attract very many competitors.
• Should have sufficient size, profit, and growth potential.
Levels of Market Segmentation
Local Marketing
Marketing programs tailored to needs & wants of local customer groups.
• Pronounced regional differences often exist in communities’ demographics and lifestyles.
• Local marketing can drive up manufacturing & marketing costs by reducing economies of scale.
Levels of Market Segmentation
Individual Marketing
The ultimate level of segmentation. Each customer is a “segment of one.”
Self-Marketing
Form of individual marketing.
Customer takes more responsibility in determining which products/brands to buy
Much less reliance upon sales people.
Useful Market Segments Are:
Measurable
Size, purchasing power, & characteristics
Substantial
Large & profitable enough to serve
Accessible
Can reach w/ distribution & promotion channels
Differentiable
Managerially-significant from other segments
Actionable
Can effectively attract & serve segment
Common Bases for Segmentation
Consumer Markets
• Geographic
• Demographic
• Psychographic
• Behavioral
Business Markets•Demographic•Operating variables•Purchasing approaches
•Situational factors•Personal characteristics
Needs-Based Market Segmentation
• First, group customers with like needs, and
• Then discover which demographics, lifestyle forces, and usage behaviors make them distinct from customers with different needs.
• Primary Benefit
– Segments are created around specific customer needs.
• Primary Disadvantage
– Do not know (initially) who these customers are.
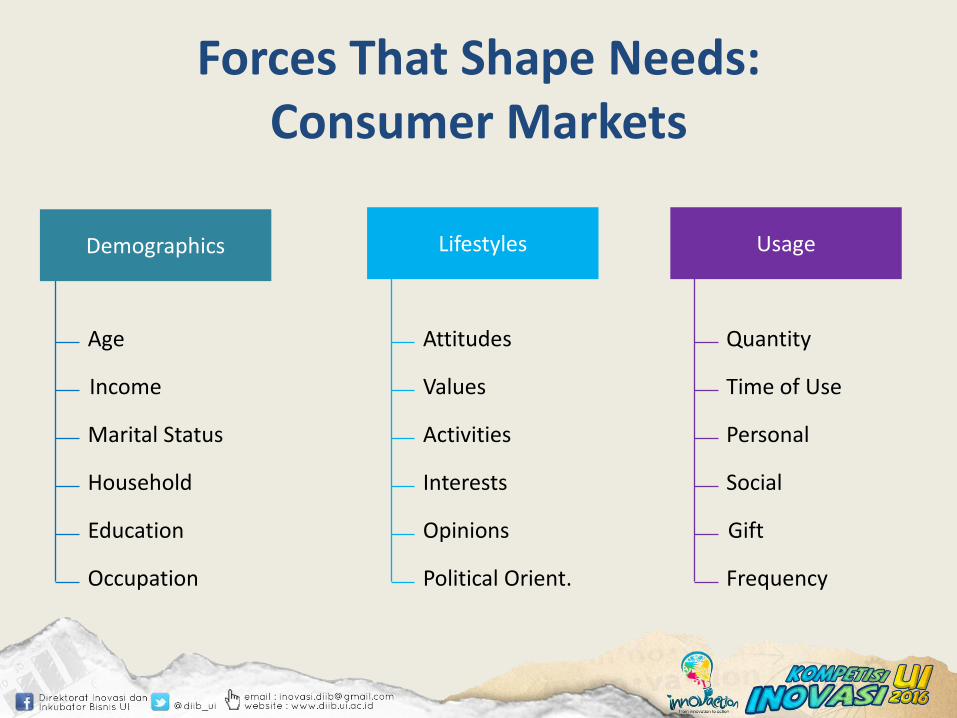
Forces That Shape Needs:Consumer Markets
UsageLifestyles
Age
Income
Marital Status
Household
Education
Occupation
Attitudes
Values
Activities
Interests
Opinions
Political Orient.
Quantity
Time of Use
Personal
Social
Gift
Frequency
Demographics
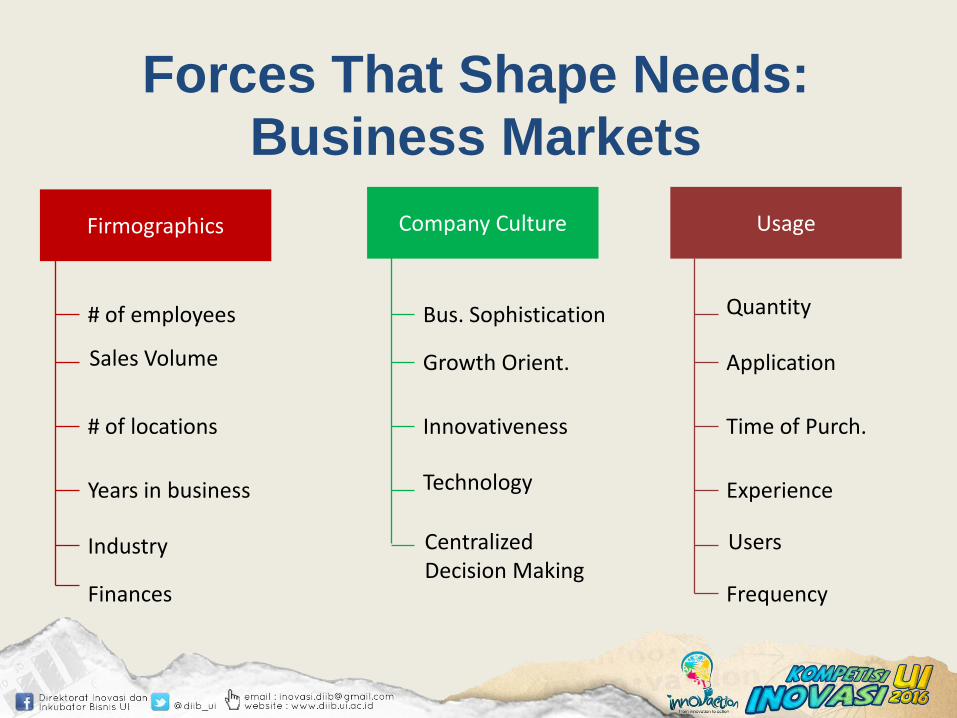
Forces That Shape Needs:
Business Markets
UsageCompany Culture
# of employees
Sales Volume
# of locations
Years in business
Industry
Finances
Bus. Sophistication
Growth Orient.
Innovativeness
Technology
CentralizedDecision Making
Quantity
Application
Time of Purch.
Experience
Users
Frequency
Firmographics
Positioning
Designing an offering & image in order to occupy a meaningful &
distinct competitive position in the target customers’ minds.
Positioning & Differentiation
• The main focus of positioning is differentiation.
• Differentiation involves designing a set of meaningful differences to distinguish the company’s offering from competitors’ offerings.
The 5 Differentiation Dimensions
• Product
• Services
• Personnel
• Channel
• Image
Product Differentiation Variables
• Features
– Characteristics that supplement the product’s basic function.
• Performance Quality
– The level at which the product’s primary characteristics operate.
• Conformance Quality
– Degree to which all the produced units are identical and meet the promised target specifications
Product Differentiation Variables
• Durability– Measure of the product’s expected operating life
under natural and/or stressful conditions.
• Reliability– Measure of the probability that a product will not
malfunction or fail within a specified time period.
• Repairability– Ease of fixing a product that malfunctions or fails
• Style– Product’s looks and feel to the buyer
Services Differentiation Variables
• Ordering Ease– how easy it is for the customer to place an order
• Delivery– how well the product is delivered to the customer
• Installation– work done to make the product operational in its planned location
• Customer Training– training the customer to properly & efficiently use the product
• Customer Consulting– data, information, systems, & advising services offered to buyers (at a
price or free)
• Maintenance & Repair– helping customers keep purchased products in good working order
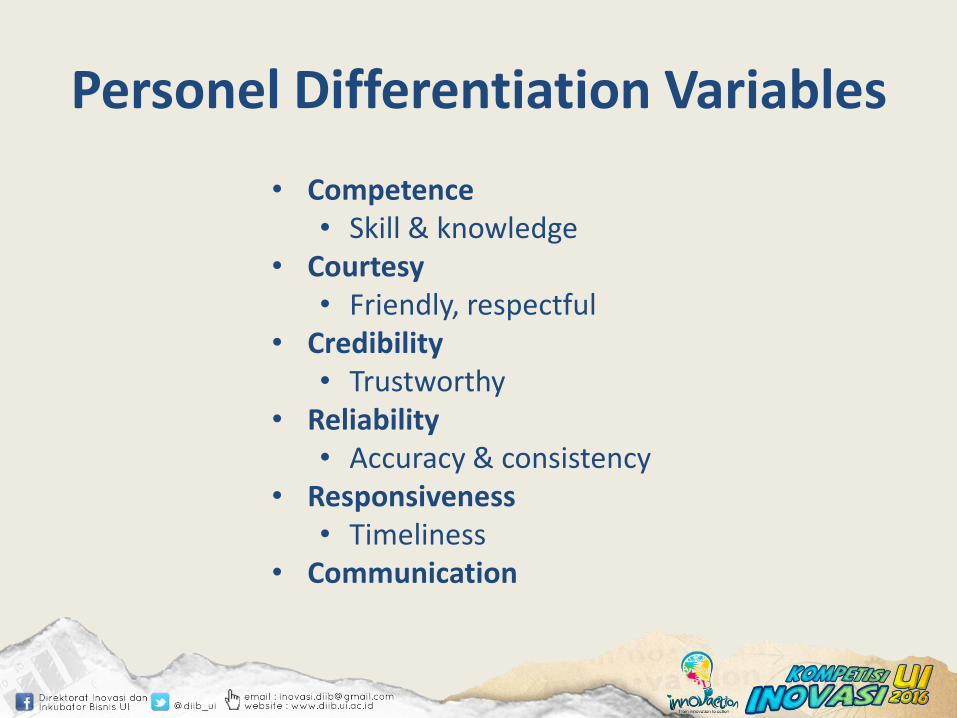
Personel Differentiation Variables
• Competence• Skill & knowledge
• Courtesy• Friendly, respectful
• Credibility• Trustworthy
• Reliability• Accuracy & consistency
• Responsiveness• Timeliness
• Communication
Channel Differentiation Variables
• Coverage
• Expertise
• Performance
Image Differentiation Variables
• Symbols
• Written & Audiovisual Media
• Atmosphere
• Events
A Difference is Worthwhile as a Differentiation Variable if it is:
Important
Distinctive
Superior
Communicable
Preemptive
Affordable
Profitable
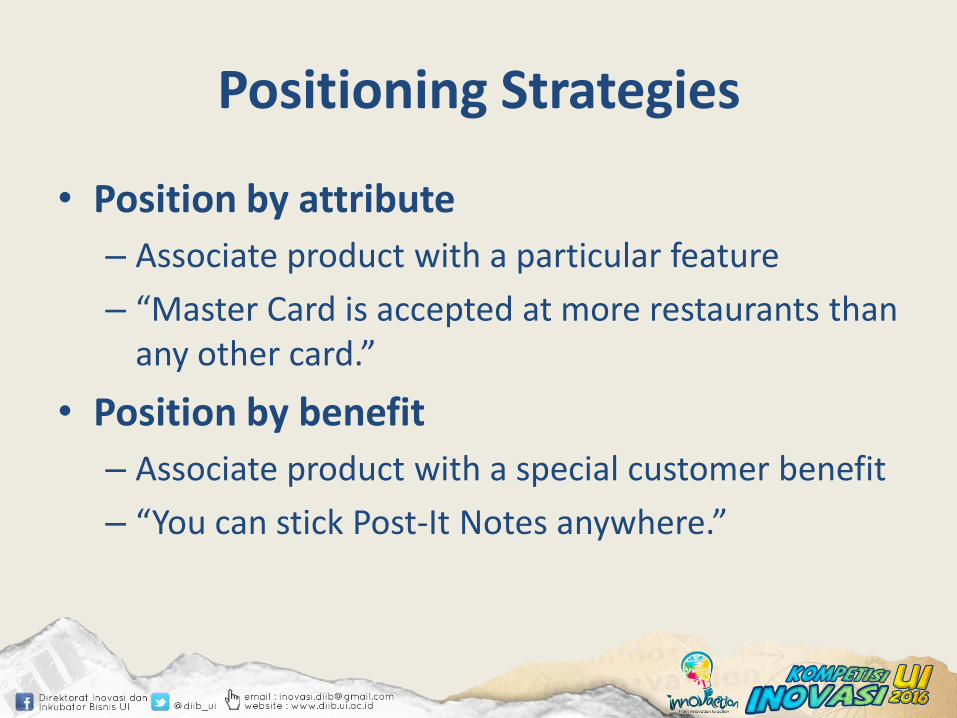
Positioning Strategies
• Position by attribute
– Associate product with a particular feature
– “Master Card is accepted at more restaurants than any other card.”
• Position by benefit
– Associate product with a special customer benefit
– “You can stick Post-It Notes anywhere.”
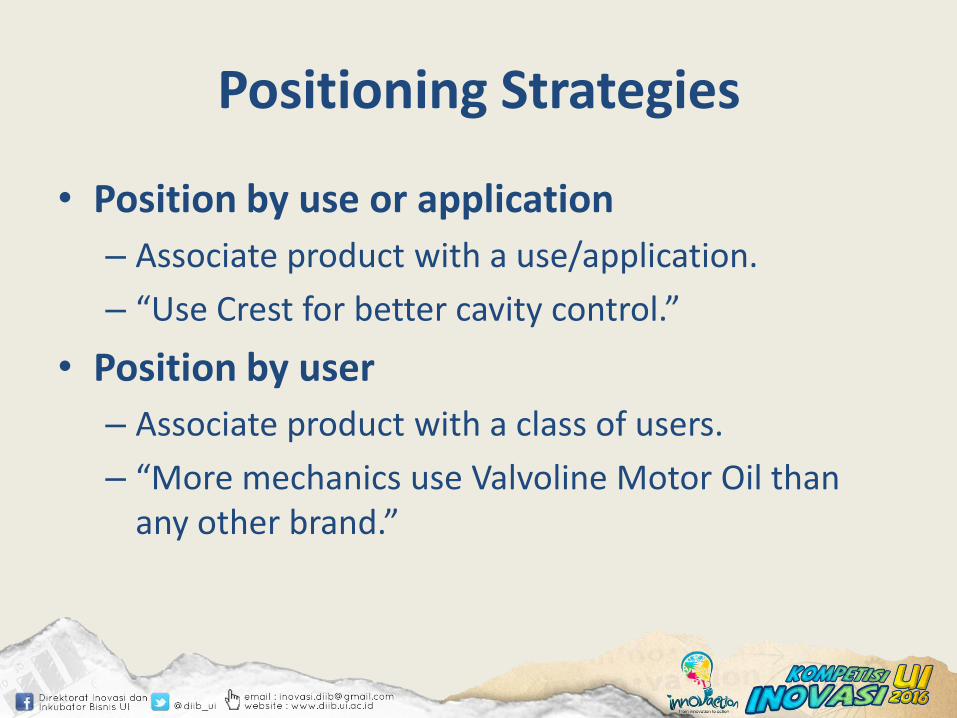
Positioning Strategies
• Position by use or application
– Associate product with a use/application.
– “Use Crest for better cavity control.”
• Position by user
– Associate product with a class of users.
– “More mechanics use Valvoline Motor Oil than any other brand.”
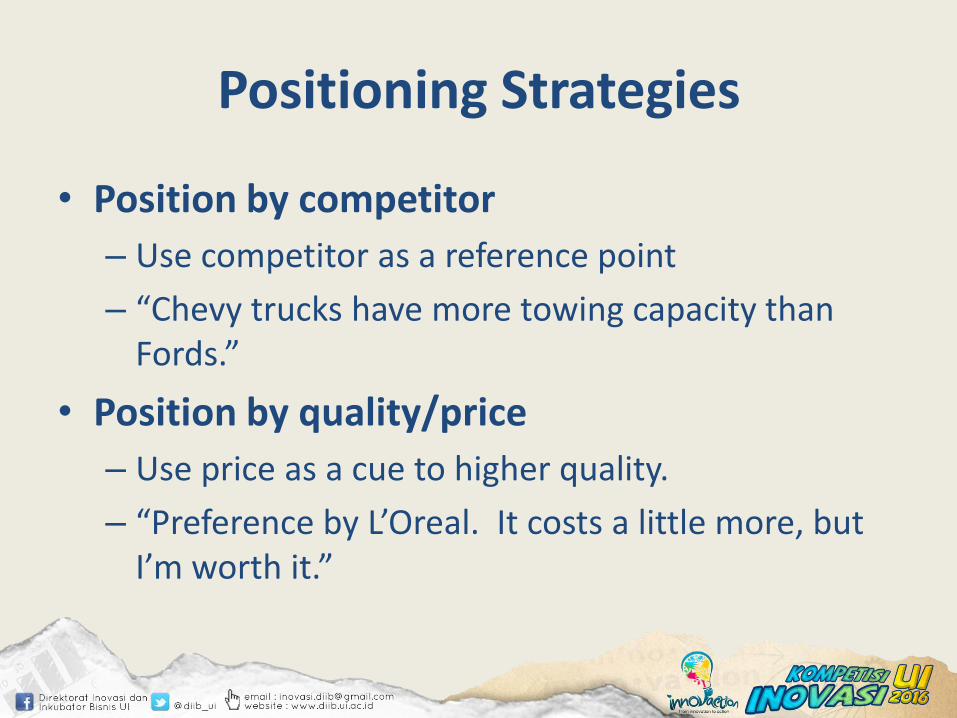
Positioning Strategies
• Position by competitor
– Use competitor as a reference point
– “Chevy trucks have more towing capacity than Fords.”
• Position by quality/price
– Use price as a cue to higher quality.
– “Preference by L’Oreal. It costs a little more, but I’m worth it.”
Daftar Referensi• Kotler, Philip dan Kevin Lane Keller. 2008. Manajemen
Pemasaran. Edisi Kedua Belas Jilid 1. Jakarta:PT. Index.
• Malhotra, Naresh K. 2009. Riset Pemasaran Pendekatan Terapan Jilid 1. Jakarta:PT Index