mengawal sustainabilitas jaminan kesehatan nasional (jkn) · source: bappenas, bps, unfpa 2013 14....
TRANSCRIPT
Mengawal SustainabilitasJaminan Kesehatan Nasional(JKN)
Donald Pardede
Pusat Pembiayaan & Jaminan Kesehatan Kemkes R.I
1

Things To Share
1. Pendahuluan (Prinsip Dasar & Tujuan)
2. Tantangan Penyelenggaraan JKN 2014-2015
3. Upaya untuk meningkatkan efisiensi
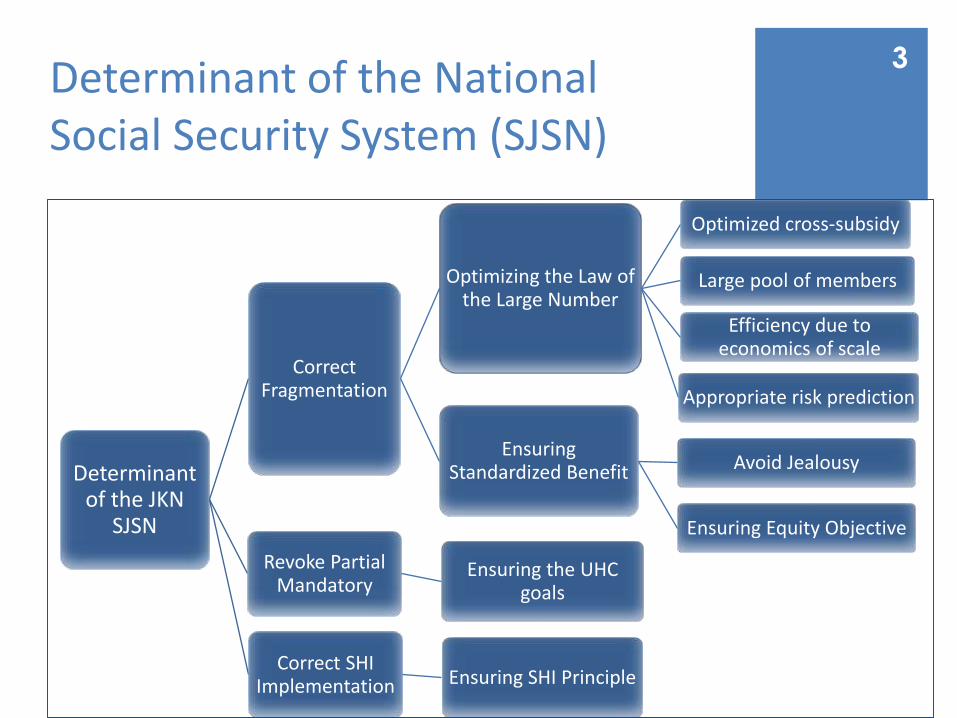
Determinant of the National Social Security System (SJSN)
Determinant of the JKN
SJSN
Correct Fragmentation
Optimizing the Law of the Large Number
Optimized cross-subsidy
Large pool of members
Efficiency due to economics of scale
Appropriate risk prediction
Ensuring Standardized Benefit Avoid Jealousy
Ensuring Equity Objective
Revoke Partial Mandatory
Ensuring the UHC goals
Correct SHI Implementation Ensuring SHI Principle
3
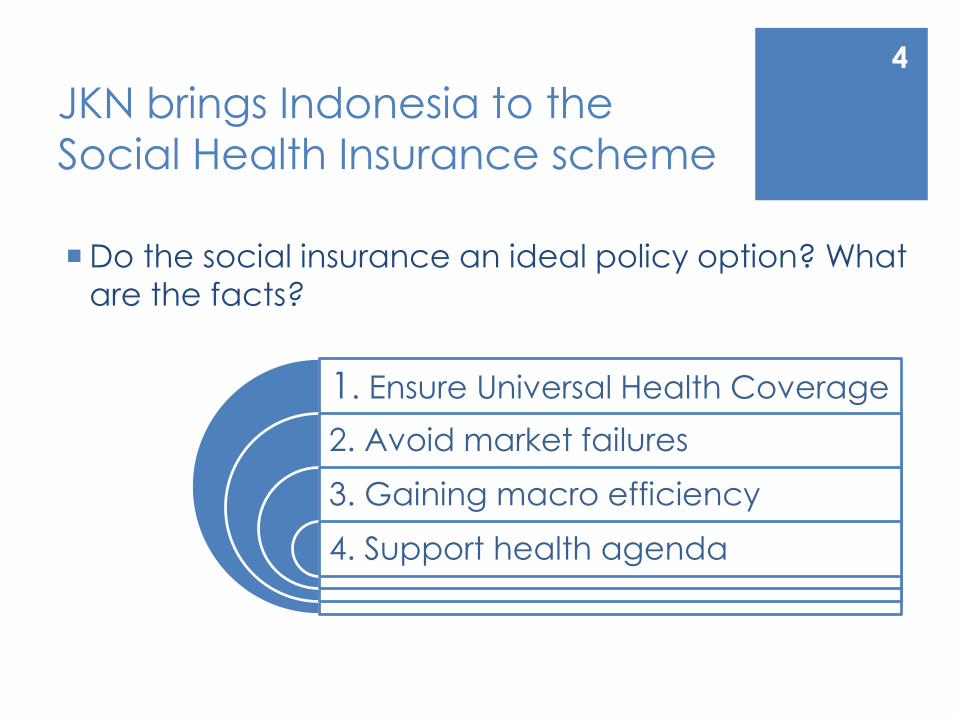
JKN brings Indonesia to the
Social Health Insurance scheme
Do the social insurance an ideal policy option? What
are the facts?
1. Ensure Universal Health Coverage
2. Avoid market failures
3. Gaining macro efficiency
4. Support health agenda
4
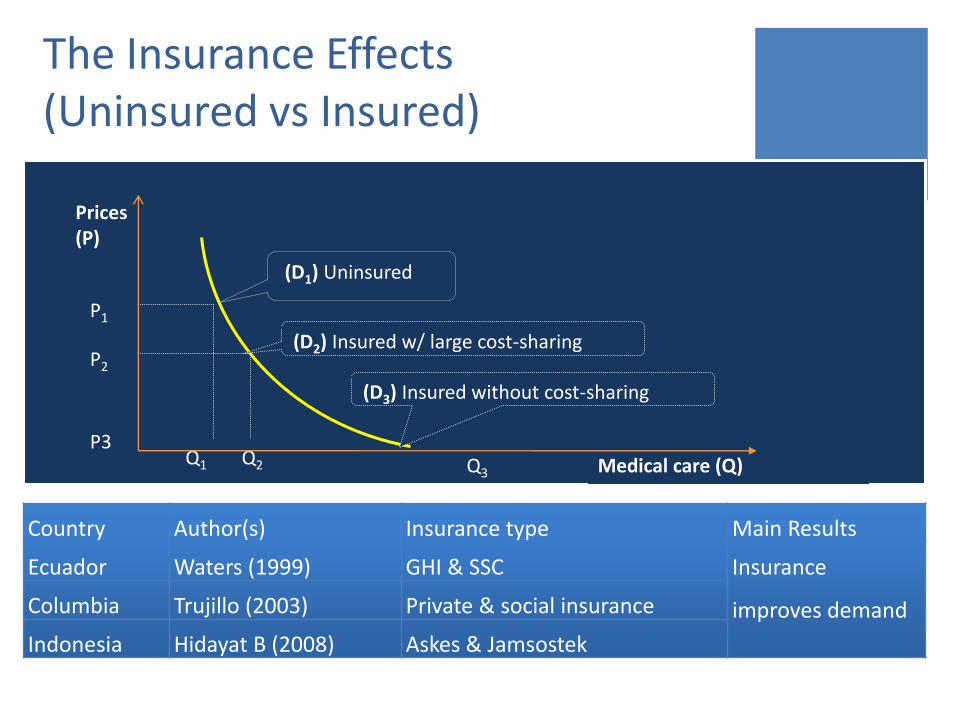
The Insurance Effects (Uninsured vs Insured)
Q1 Q2 Q3
P3
P2
P1
Medical care (Q)
Prices (P)
(D2) Insured w/ large cost-sharing
(D3) Insured without cost-sharing
(D1) Uninsured
Country Author(s) Insurance type Main Results
Ecuador Waters (1999) GHI & SSC Insurance
improves demandColumbia Trujillo (2003) Private & social insurance
Indonesia Hidayat B (2008) Askes & Jamsostek
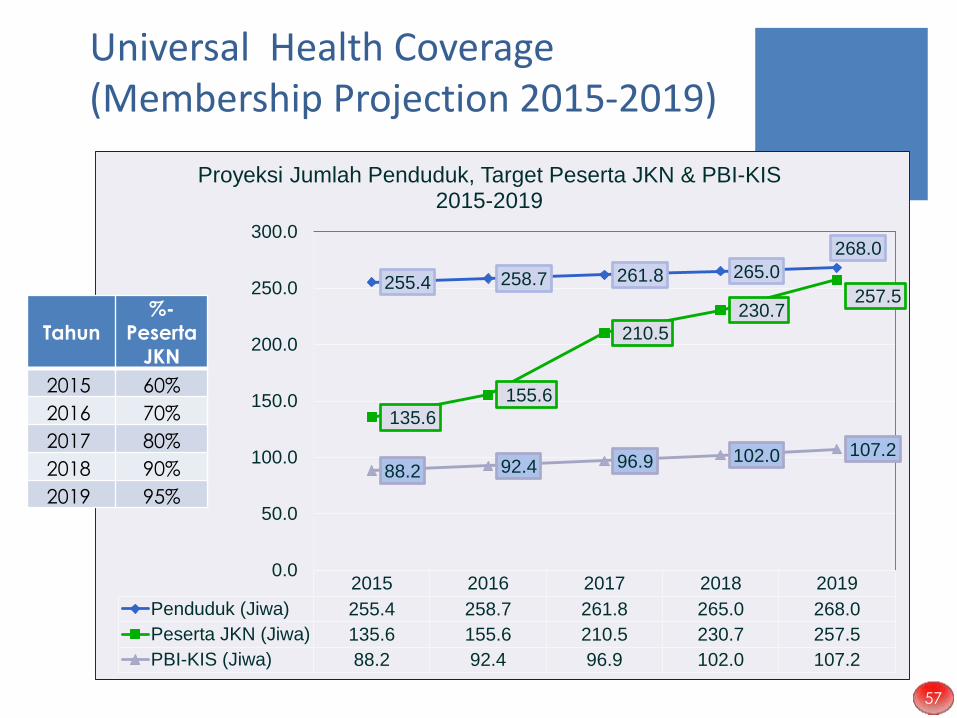
Universal Health Coverage (Membership Projection 2015-2019)
(dalam jutaan)
2015 2016 2017 2018 2019
Penduduk (Jiwa) 255.4 258.7 261.8 265.0 268.0
Peserta JKN (Jiwa) 135.6 155.6 210.5 230.7 257.5
PBI-KIS (Jiwa) 88.2 92.4 96.9 102.0 107.2
255.4 258.7 261.8 265.0
268.0
135.6
155.6
210.5
230.7 257.5
88.2 92.4 96.9 102.0 107.2
0.0
50.0
100.0
150.0
200.0
250.0
300.0
Proyeksi Jumlah Penduduk, Target Peserta JKN & PBI-KIS2015-2019
Tahun
%-
Peserta
JKN
2015 60%
2016 70%
2017 80%
2018 90%
2019 95%
57
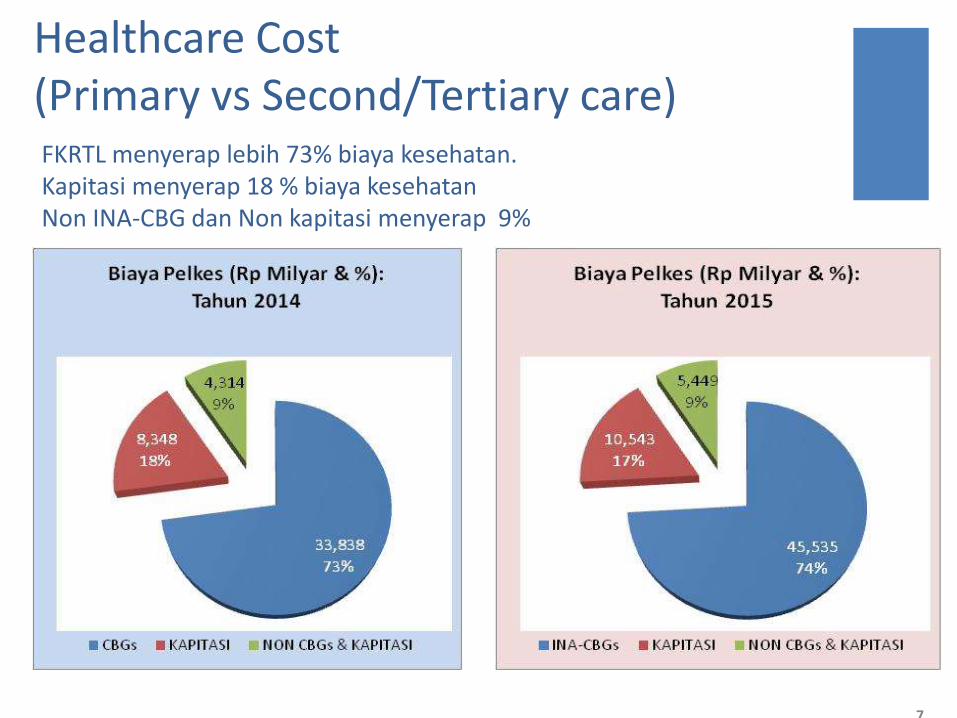
Healthcare Cost (Primary vs Second/Tertiary care)
7
FKRTL menyerap lebih 73% biaya kesehatan. Kapitasi menyerap 18 % biaya kesehatanNon INA-CBG dan Non kapitasi menyerap 9%
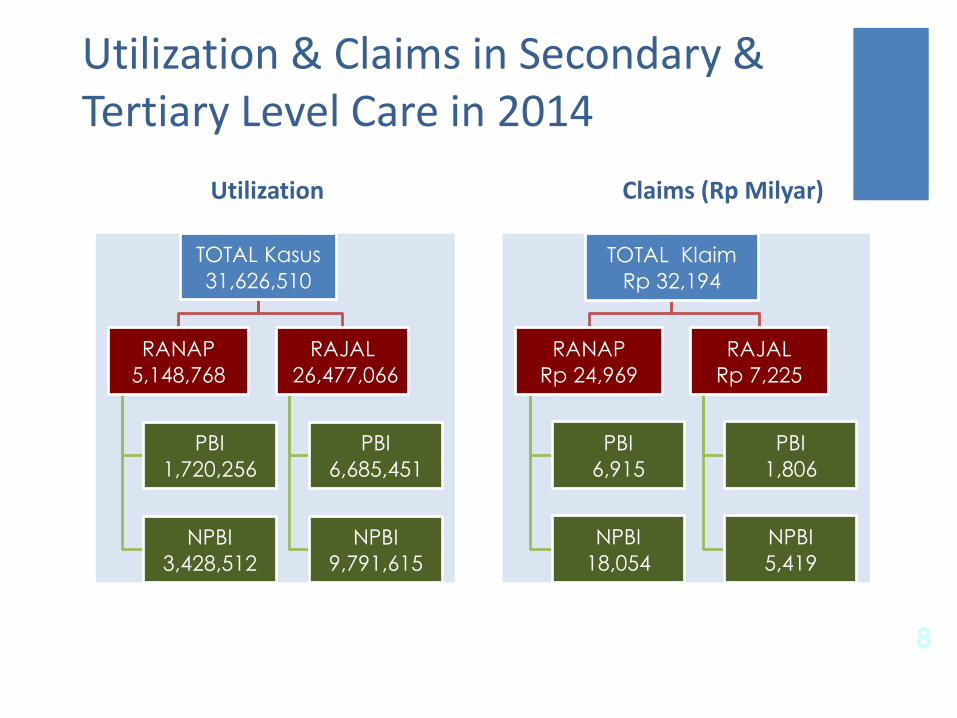
Utilization & Claims in Secondary & Tertiary Level Care in 2014
Utilization Claims (Rp Milyar)
8
TOTAL Kasus
31,626,510
RANAP
5,148,768
PBI
1,720,256
NPBI
3,428,512
RAJAL
26,477,066
PBI
6,685,451
NPBI
9,791,615
TOTAL Klaim
Rp 32,194
RANAP
Rp 24,969
PBI
6,915
NPBI
18,054
RAJAL
Rp 7,225
PBI
1,806
NPBI
5,419
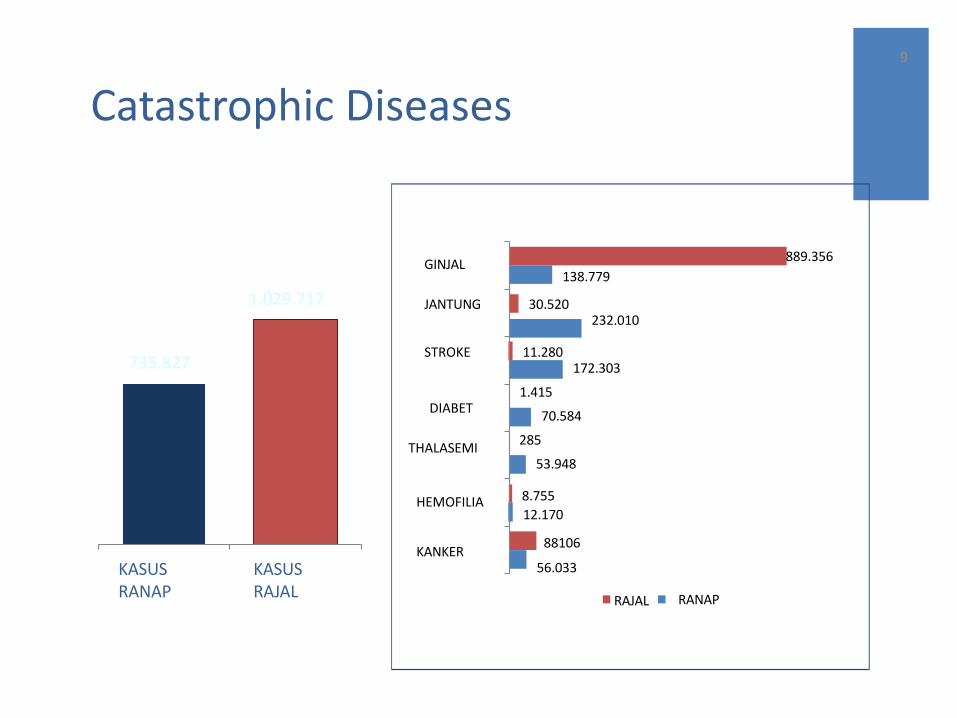
Catastrophic Diseases
56.033
8.755
12.170
53.948
70.584
172.303
232.010
138.779
88106
285
1.415
11.280
30.520
889.356
KANKER
HEMOFILIA
THALASEMI
DIABET
STROKE
JANTUNG
GINJAL
RAJAL RANAP
735.827
1.029.717
KASUSRANAP
KASUS RAJAL
9
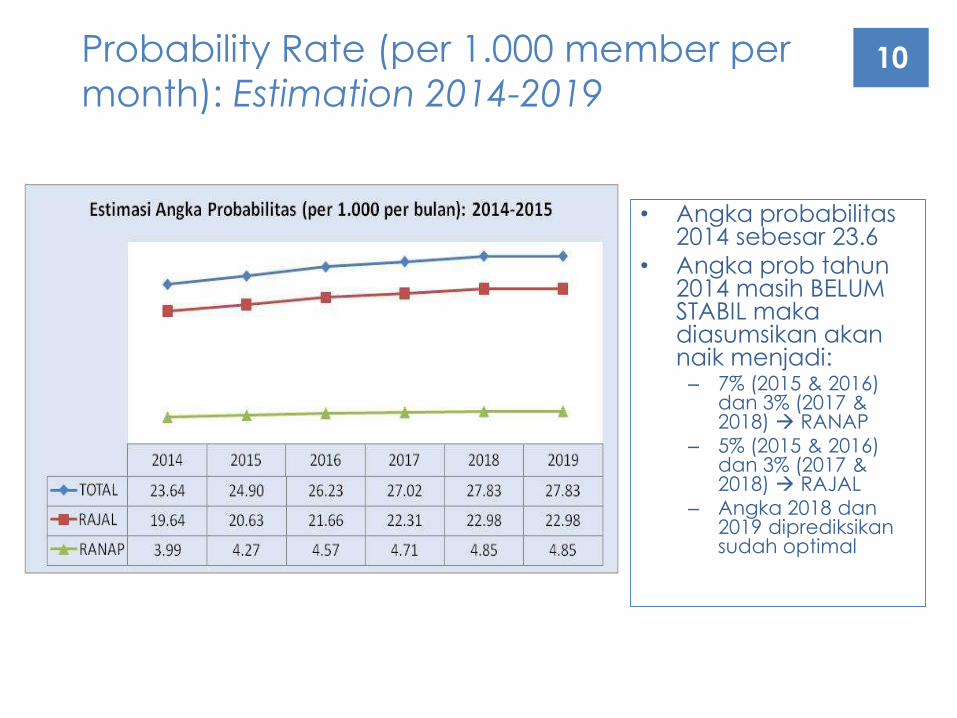
Probability Rate (per 1.000 member per
month): Estimation 2014-201910
• Angka probabilitas2014 sebesar 23.6
• Angka prob tahun2014 masih BELUM STABIL makadiasumsikan akannaik menjadi:– 7% (2015 & 2016)
dan 3% (2017 & 2018) RANAP
– 5% (2015 & 2016) dan 3% (2017 & 2018) RAJAL
– Angka 2018 dan2019 diprediksikansudah optimal
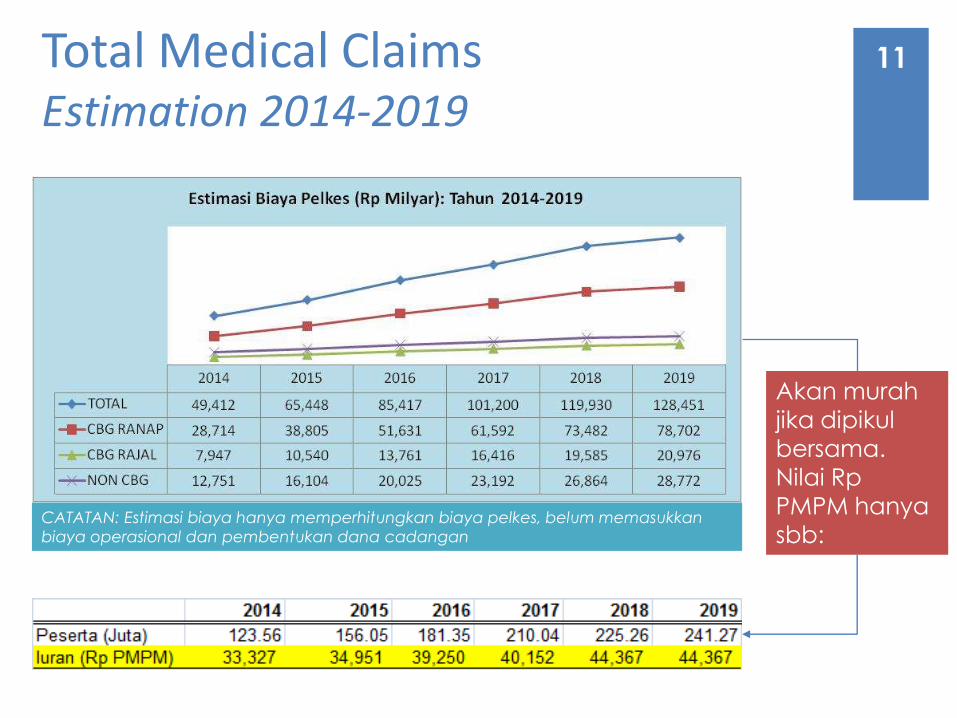
Total Medical Claims Estimation 2014-2019
Akan murah
jika dipikul
bersama.
Nilai Rp
PMPM hanya
sbb:CATATAN: Estimasi biaya hanya memperhitungkan biaya pelkes, belum memasukkan
biaya operasional dan pembentukan dana cadangan
11
Overcoming Financial Sustainability of JKN Program: Key Impetus
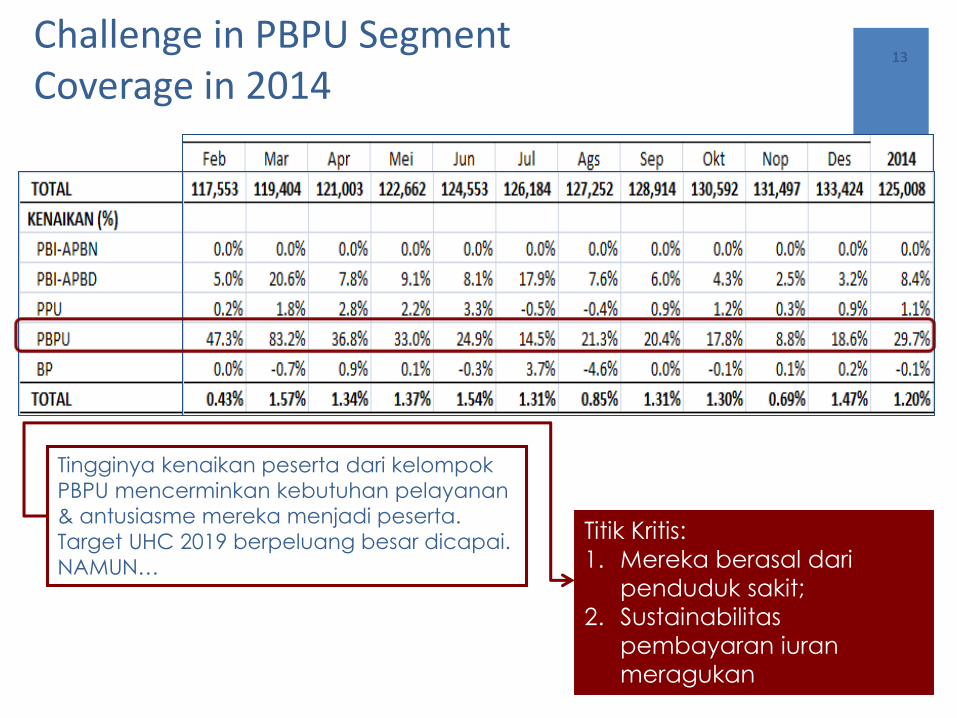
1. Challenge in PBPU’s segment
2. Demographic (elderly population) and epidemiological transition
3. Changes of epidemiological profile (growing NCD and Injuries) that lead to Double Burden
Trend of Indonesian Burden of Disease;
Risk factors of NCD
4. Inefficiency and fraudulent Issues
12
13
Titik Kritis:
1. Mereka berasal dari
penduduk sakit;
2. Sustainabilitas
pembayaran iuran
meragukan
Tingginya kenaikan peserta dari kelompok
PBPU mencerminkan kebutuhan pelayanan
& antusiasme mereka menjadi peserta.
Target UHC 2019 berpeluang besar dicapai.
NAMUN…
Challenge in PBPU SegmentCoverage in 2014
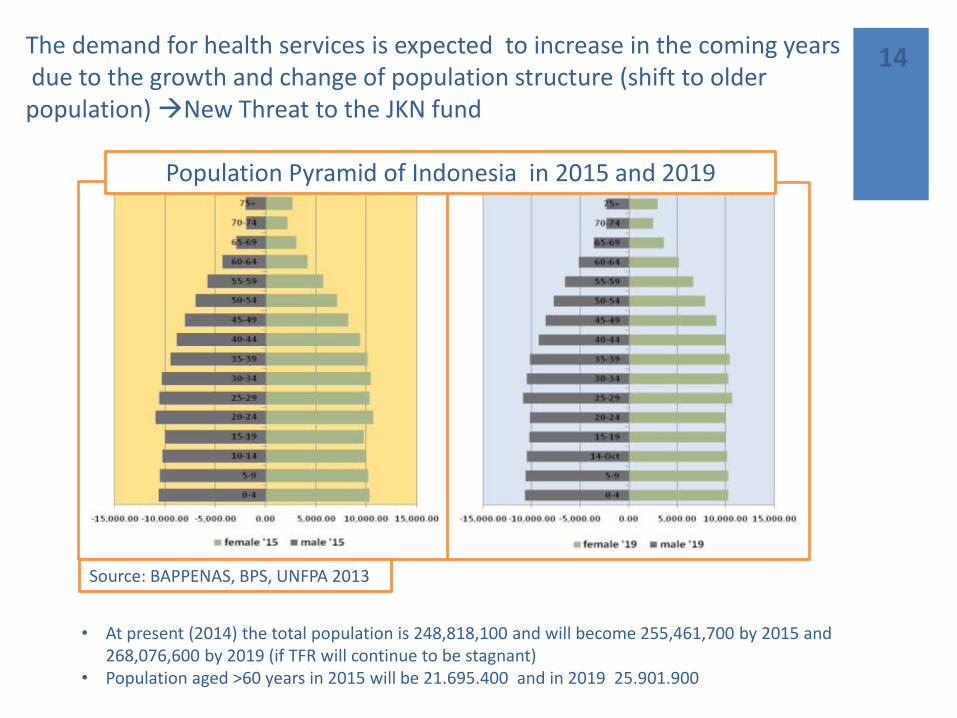
The demand for health services is expected to increase in the coming yearsdue to the growth and change of population structure (shift to older population) New Threat to the JKN fund
• At present (2014) the total population is 248,818,100 and will become 255,461,700 by 2015 and 268,076,600 by 2019 (if TFR will continue to be stagnant)
• Population aged >60 years in 2015 will be 21.695.400 and in 2019 25.901.900
Population Pyramid of Indonesia in 2015 and 2019
Source: BAPPENAS, BPS, UNFPA 2013
14
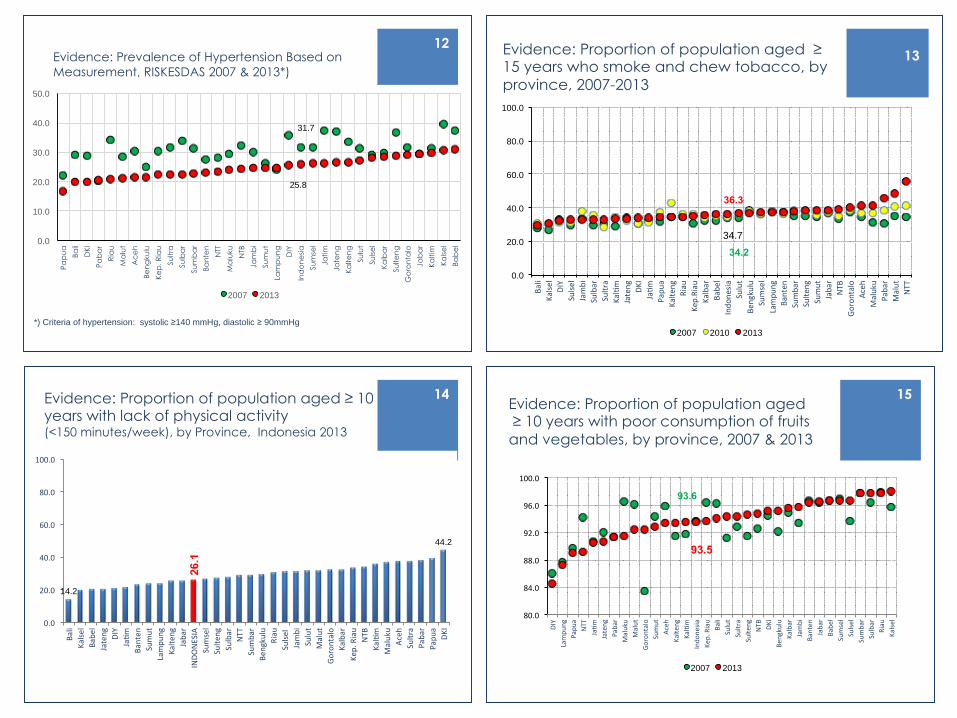
Evidence: Prevalence of Hypertension Based on
Measurement, RISKESDAS 2007 & 2013*)
31.7
25.8
0.0
10.0
20.0
30.0
40.0
50.0
Pa
pu
a
Ba
li
DK
I
Pa
ba
r
Ria
u
Ma
lut
Ac
eh
Be
ng
ku
lu
Ke
p.
Ria
u
Su
ltra
Su
lba
r
Su
mb
ar
Ba
nte
n
NTT
Ma
luku
NTB
Ja
mb
i
Su
mu
t
Lam
pu
ng
DIY
Ind
on
esi
a
Su
mse
l
Ja
tim
Ja
ten
g
Ka
lte
ng
Su
lut
Su
lse
l
Ka
lba
r
Su
lte
ng
Go
ron
talo
Ja
ba
r
Ka
ltim
Ka
lse
l
Ba
be
l
2007 2013
*) Criteria of hypertension: systolic ≥140 mmHg, diastolic ≥ 90mmHg
12 Evidence: Proportion of population aged ≥ 15 years who smoke and chew tobacco, by
province, 2007-2013
34.2
34.7
36.3
0.0
20.0
40.0
60.0
80.0
100.0
Bali
Kalsel
DIY
Sulsel
Jambi
Sulbar
Sultra
Kal
m
Jateng
DKI
Jam
Papua
Kalteng
Riau
Kep
.Riau
Kalbar
Babel
Indonesia
Sulut
Ben
gkulu
Sumsel
Lampung
Banten
Sumbar
Sulten
g
Sumut
Jabar
NTB
Gorontalo
Aceh
Maluku
Pabar
Malut
NTT
2007 2010 2013
13
Evidence: Proportion of population aged ≥ 10 years with lack of physical activity (<150 minutes/week), by Province, Indonesia 2013
14.2
26
.1
44.2
0.0
20.0
40.0
60.0
80.0
100.0
Bali
Kalsel
Babel
Jateng
DIY
Jam
Banten
Sumut
Lampung
Kalteng
Jabar
INDONESIA
Sumsel
Sulteng
Sulbar
NTT
Sumbar
Bengkulu
Riau
Sulsel
Jambi
Sulut
Malut
Gorontalo
Kalbar
Kep.R
iau
NTB
Kal
m
Maluku
Aceh
Sultra
Pabar
Papua
DKI
14 Evidence: Proportion of population aged ≥ 10 years with poor consumption of fruits
and vegetables, by province, 2007 & 2013
93.6
93.5
80.0
84.0
88.0
92.0
96.0
100.0
DIY
Lampung
Papua
NTT
Jam
Jateng
Pabar
Maluku
Malut
Gorontalo
Sumut
Aceh
Kalteng
Kal
m
Indonesia
Kep
.Riau
Bali
Sulut
Sultra
Sulteng
NTB
DKI
Bengkulu
Kalbar
Jambi
Ban
ten
Jabar
Babel
Sumsel
Sulsel
Sumbar
Sulbar
Riau
Kalsel
2007 2013
15
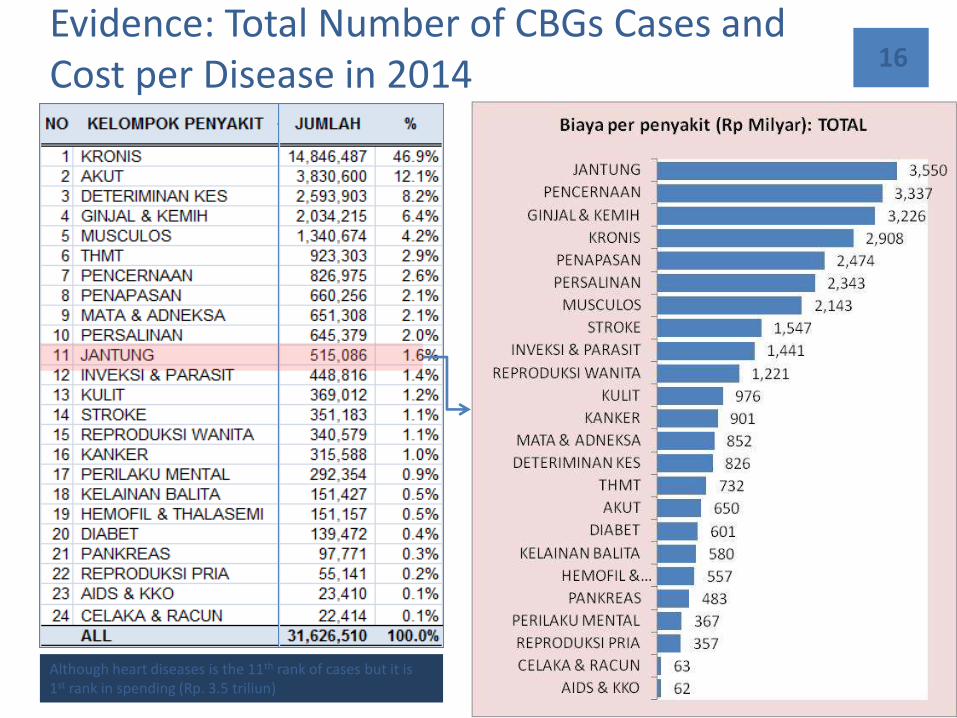
Evidence: Total Number of CBGs Cases and Cost per Disease in 2014
Although heart diseases is the 11th rank of cases but it is 1st rank in spending (Rp. 3.5 triliun)
16
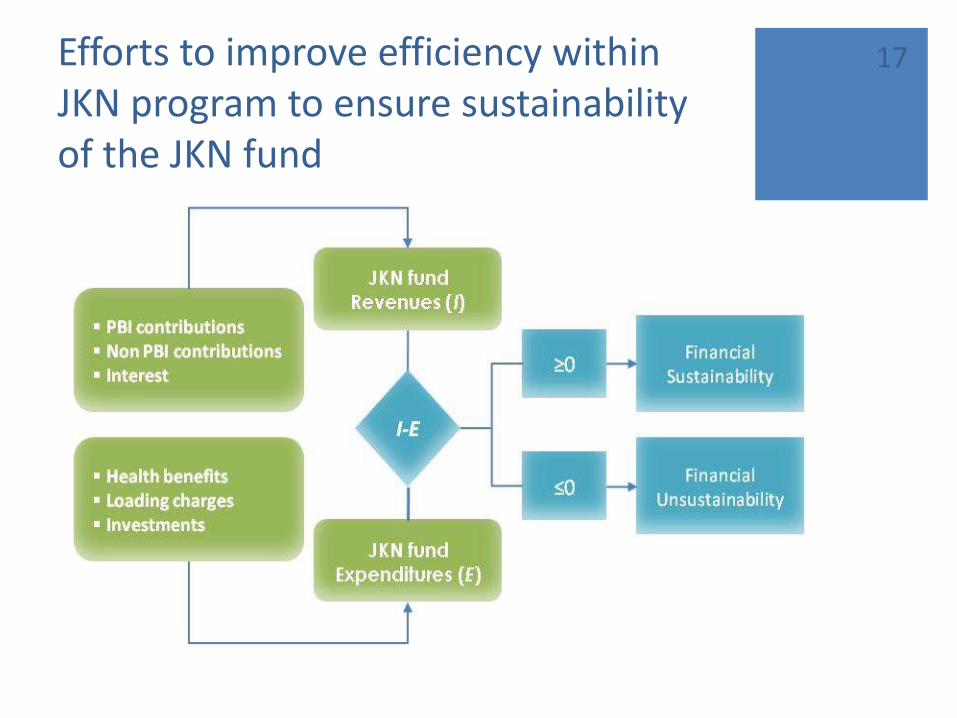
Efforts to improve efficiency within JKN program to ensure sustainability of the JKN fund
17
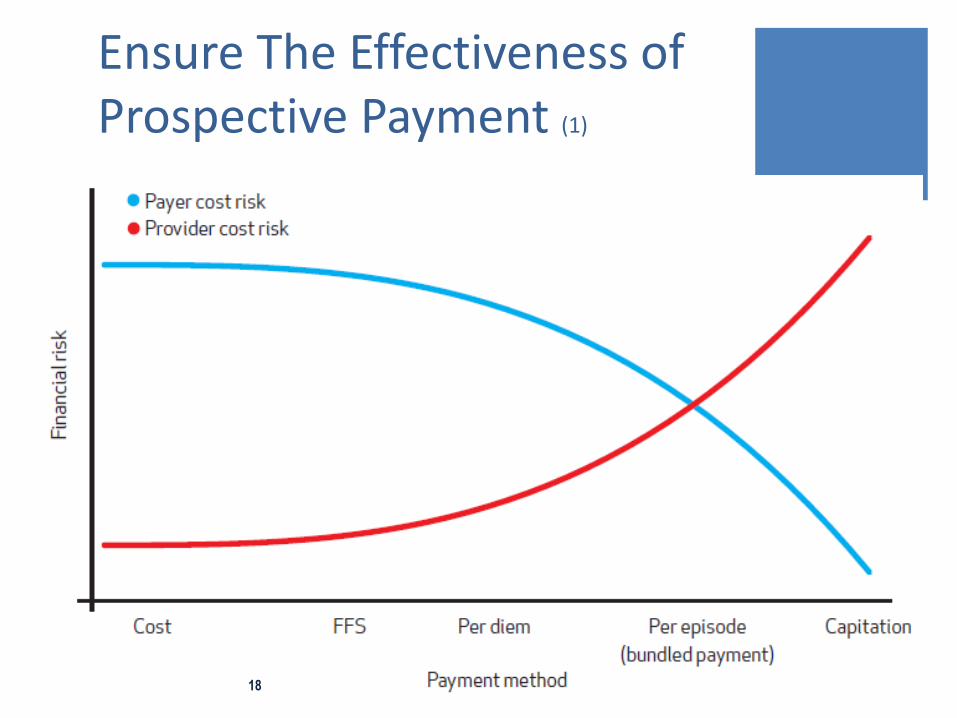
Ensure The Effectiveness of Prospective Payment (1)
18
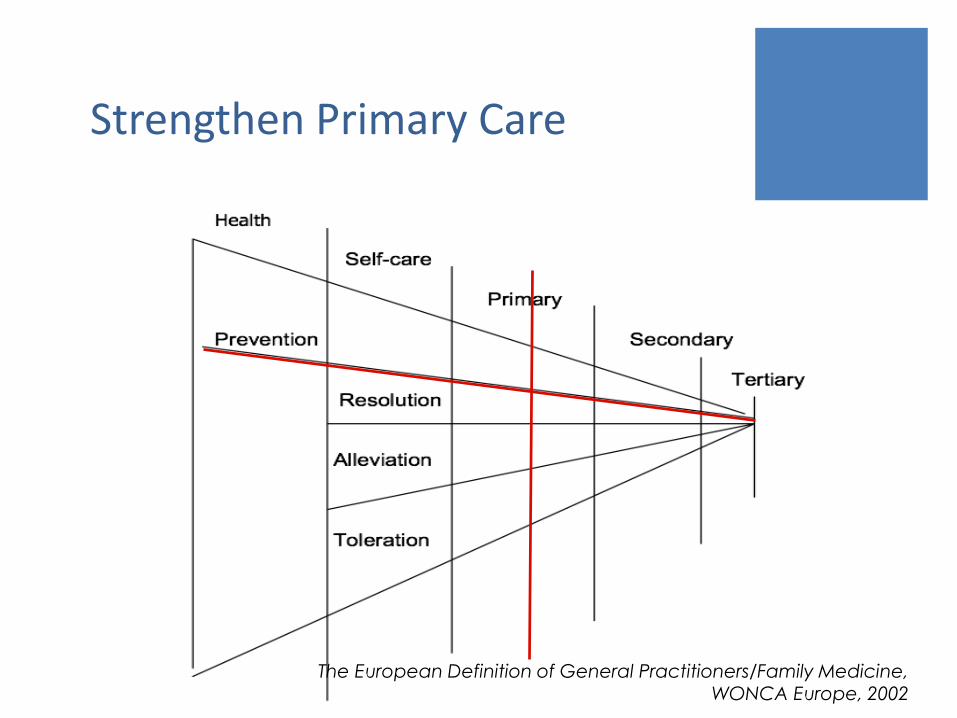
Strengthen Primary Care
The European Definition of General Practitioners/Family Medicine,
WONCA Europe, 2002
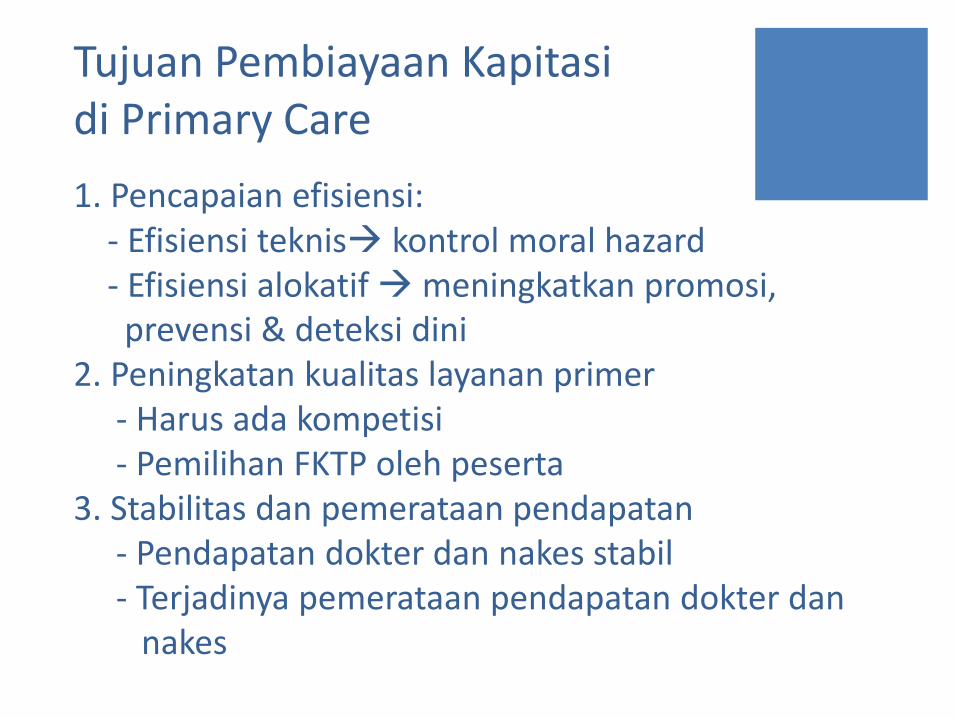
Tujuan Pembiayaan Kapitasi di Primary Care
1. Pencapaian efisiensi:- Efisiensi teknis kontrol moral hazard - Efisiensi alokatif meningkatkan promosi,
prevensi & deteksi dini2. Peningkatan kualitas layanan primer
- Harus ada kompetisi- Pemilihan FKTP oleh peserta
3. Stabilitas dan pemerataan pendapatan- Pendapatan dokter dan nakes stabil- Terjadinya pemerataan pendapatan dokter dan
nakes
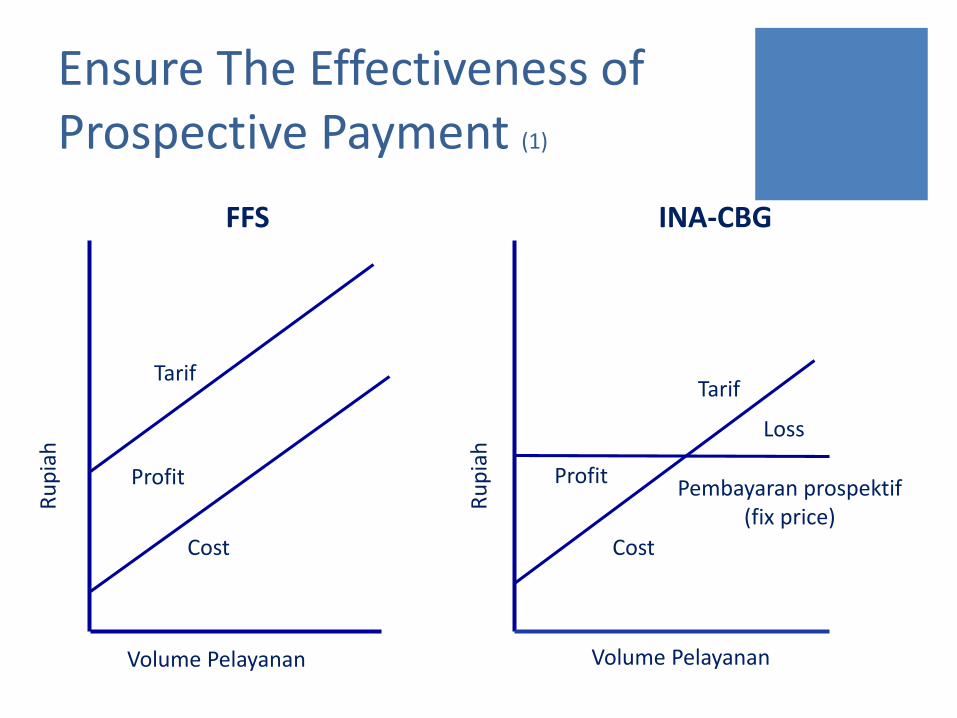
Ru
pia
h
Ru
pia
h
Volume Pelayanan Volume Pelayanan
Tarif
Cost Cost
Pembayaran prospektif(fix price)
Tarif
Profit Profit
Loss
FFS INA-CBG
Ensure The Effectiveness of Prospective Payment (1)
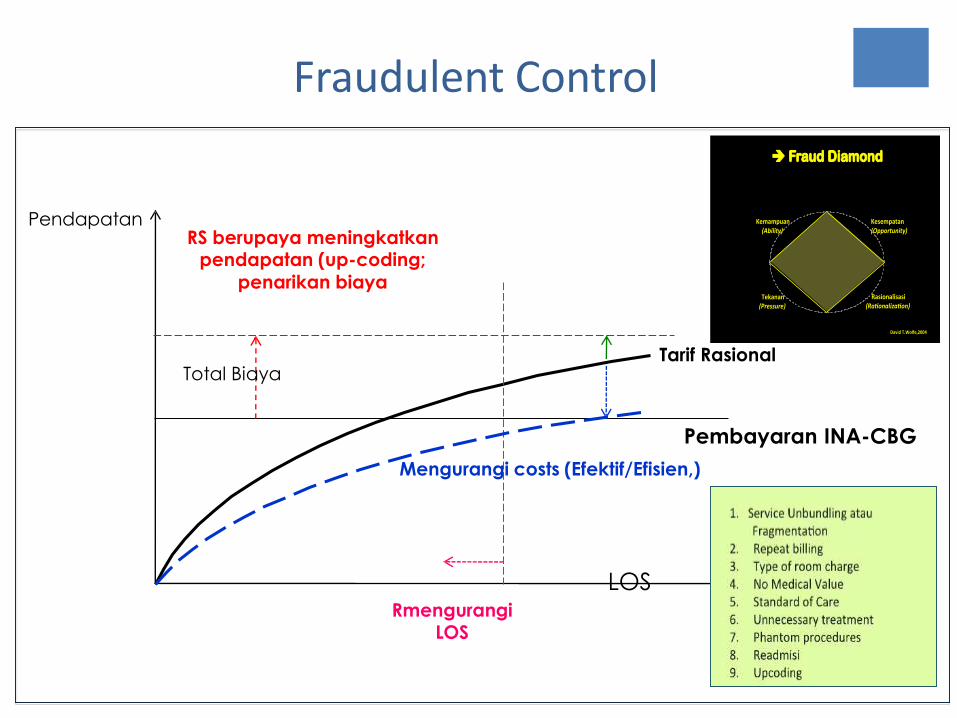
22
LOS
Pendapatan
Total Biaya
Pembayaran INA-CBG
Mengurangi costs (Efektif/Efisien,)
Rmengurangi LOS
RS berupaya meningkatkan pendapatan (up-coding;
penarikan biaya
Tarif Rasional
Fraudulent Control
Kesempatan(Opportunity)
Kemampuan(Ability)
Tekanan(Pressure)
Rasionalisasi(Ra onaliza on)
DavidT.Wolfe,2004
è Fraud Diamond
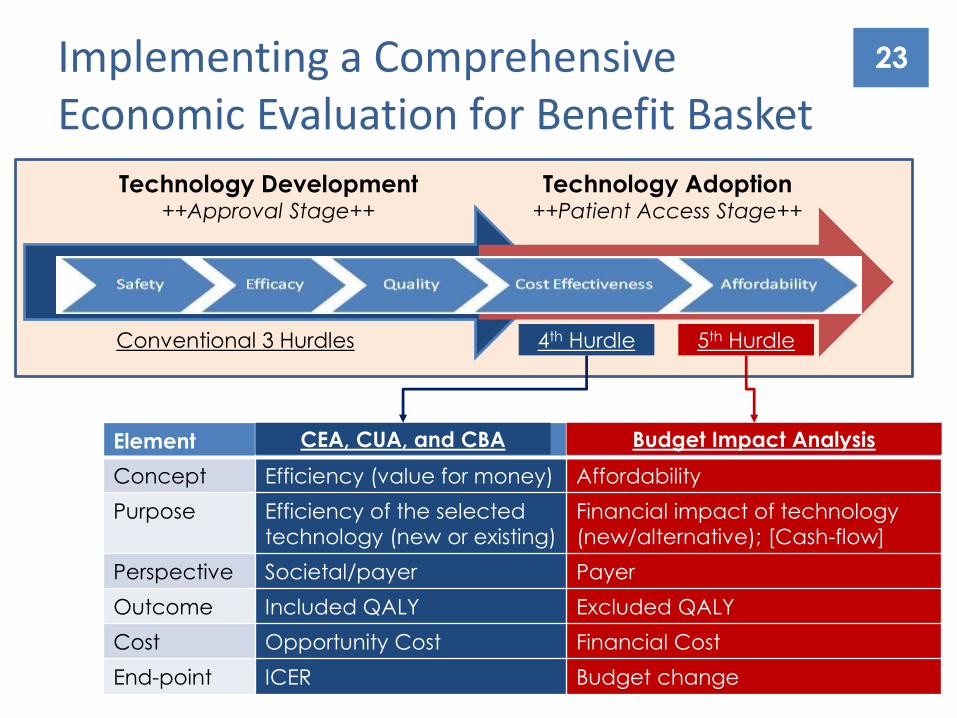
Implementing a Comprehensive Economic Evaluation for Benefit Basket
Element CEA BIA
Concept Efficiency (value for money) Affordability
Purpose Efficiency of the selected
technology (new or existing)
Financial impact of technology
(new/alternative); [Cash-flow]
Perspective Societal/payer Payer
Outcome Included QALY Excluded QALY
Cost Opportunity Cost Financial Cost
End-point ICER Budget change
Technology Development++Approval Stage++
Technology Adoption++Patient Access Stage++
4th Hurdle 5th HurdleConventional 3 Hurdles
CEA, CUA, and CBA Budget Impact Analysis
23