lembar persetujuan peneliti -...
TRANSCRIPT
Lampiran 1
LEMBAR PERSETUJUAN PENELITI
Responden yang saya hormati,
Saya yang bertandatangan di bawahini :
Nama : Mirawati Tefi
Nim : 2013 33 062
Alamat : Jln. Satria III, No.31 Grogol Jakarta Barat
Adalah mahasiswa Fakultas Ilmu-Ilmu Kesehatan Program Studi Ilmu
Keperawatan Universitas Esa Unggul, akan melakukan penelitian tentang
“Hubungan Tingkat Pengetahuan dan Perilaku Orang Tua Dalam Mencegah
Kejadian Diare Pada Balita Di Posyandu Sayang Ibu RW 4 Kelurahan Jelambar
Grogol Jakarta Barat”.
Tujuan penelitian ini adalah adakah Hubungan Tingkat Pengetahuan dan Perilaku
Orang Tua Dalam Mencegah Kejadian Diare Pada Balita Di Posyandu Sayang
Ibu RW 4 Kelurahan Jelambar Grogol Jakarta Barat”.
Penelitian ini tidak akan merugikan responden, data hanya akan digunakan untuk
kepentingan penelitian. Dengan surat ini saya lampirkan surat persetujuan bila
saudara bersedia menjadi responden penelitian.
Besar harapan saya agar saudara bersedia menjadi responden dalam penelitian
dan menjawab pertanyaan terkait penelitian yang akan dilakukan. Atas kesediaan
dan kerjasamanya saya ucapkan terimakasih.
Peneliti
Mirawati Tefi
Lampiran 2
LEMBAR PERSETUJUAN RESPONDEN
Saya yang bertanda tangan dibawah ini menyatakan bersedia untuk ikut
berpartisipasi dalam pengumpulan data yang dilakukan oleh mahasiswa Fakultas
Ilmu-Ilmu Kesehatan Program Studi Ilmu Keperawatan Universitas Esa Unggul
yang bernama Mirawati Tefi dengan penelitian yang berjudul “Hubungan
Tingkat Pengetahuan dan Perilaku Orang Tua Dalam Mencegah Kejadian Diare
Pada Balita Di Posyandu Sayang Ibu RW 4 Kelurahan Jelambar Grogol Jakarta
Barat”.
Saya mengetahui bahwa informasi yang saya berikan ini sangat besar
manfaatnya bagi peningkatan ilmu keperawatan di Indonesia.
Jakarta,........................Februari 2015
Responden
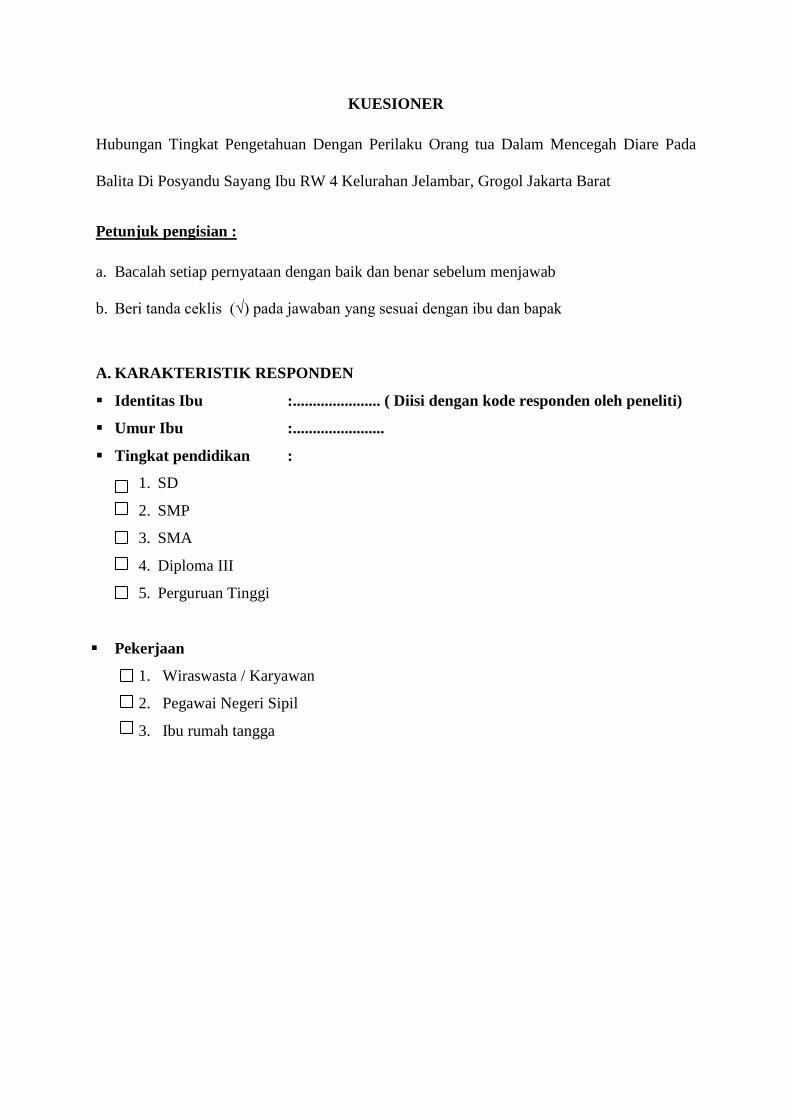
KUESIONER
Hubungan Tingkat Pengetahuan Dengan Perilaku Orang tua Dalam Mencegah Diare Pada
Balita Di Posyandu Sayang Ibu RW 4 Kelurahan Jelambar, Grogol Jakarta Barat
Petunjuk pengisian :
a. Bacalah setiap pernyataan dengan baik dan benar sebelum menjawab
b. Beri tanda ceklis (√) pada jawaban yang sesuai dengan ibu dan bapak
A. KARAKTERISTIK RESPONDEN
Identitas Ibu :...................... ( Diisi dengan kode responden oleh peneliti)
Umur Ibu :.......................
Tingkat pendidikan :
1. SD
2. SMP
3. SMA
4. Diploma III
5. Perguruan Tinggi
Pekerjaan
1. Wiraswasta / Karyawan
2. Pegawai Negeri Sipil
3. Ibu rumah tangga
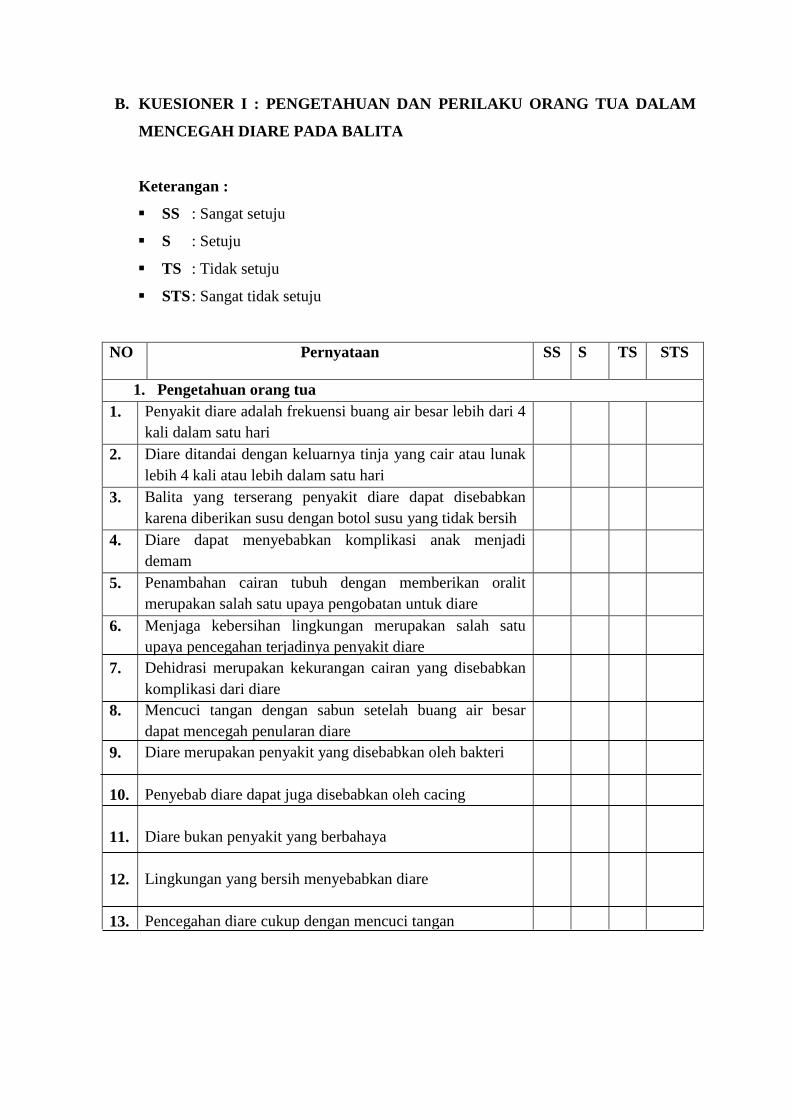
B. KUESIONER I : PENGETAHUAN DAN PERILAKU ORANG TUA DALAM
MENCEGAH DIARE PADA BALITA
Keterangan :
SS : Sangat setuju
S : Setuju
TS : Tidak setuju
STS : Sangat tidak setuju
NO Pernyataan SS
S
TS
STS
1. Pengetahuan orang tua
1. Penyakit diare adalah frekuensi buang air besar lebih dari 4
kali dalam satu hari
2. Diare ditandai dengan keluarnya tinja yang cair atau lunak
lebih 4 kali atau lebih dalam satu hari
3. Balita yang terserang penyakit diare dapat disebabkan
karena diberikan susu dengan botol susu yang tidak bersih
4. Diare dapat menyebabkan komplikasi anak menjadi
demam
5. Penambahan cairan tubuh dengan memberikan oralit
merupakan salah satu upaya pengobatan untuk diare
6.
7.
8.
9.
10.
11.
12.
13.
Menjaga kebersihan lingkungan merupakan salah satu
upaya pencegahan terjadinya penyakit diare
Dehidrasi merupakan kekurangan cairan yang disebabkan
komplikasi dari diare
Mencuci tangan dengan sabun setelah buang air besar
dapat mencegah penularan diare
Diare merupakan penyakit yang disebabkan oleh bakteri
Penyebab diare dapat juga disebabkan oleh cacing
Diare bukan penyakit yang berbahaya
Lingkungan yang bersih menyebabkan diare
Pencegahan diare cukup dengan mencuci tangan
14.
15.
Mual merupakan komplikasi dari diare
Diare dapat dicegah dengan memberikan ASI sampai 3
bulan
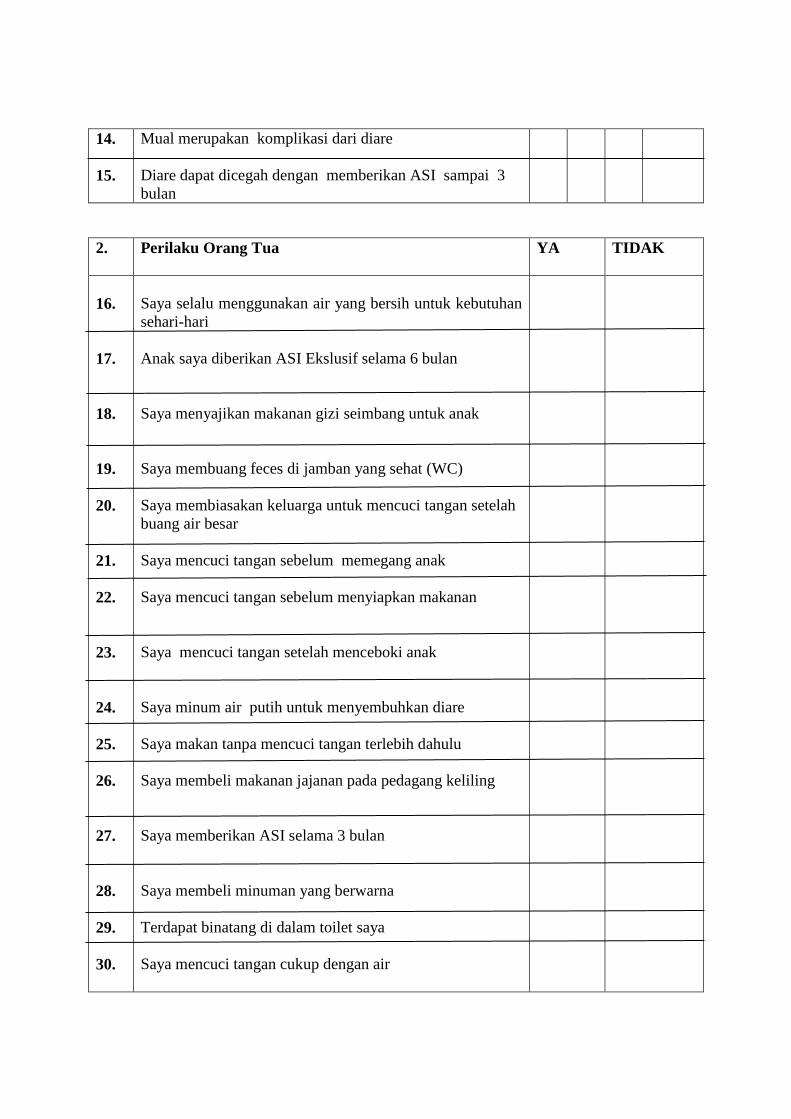
2. Perilaku Orang Tua
YA TIDAK
16.
17.
18.
19.
20.
21.
22.
23.
24.
25.
26.
27.
28.
29.
30.
Saya selalu menggunakan air yang bersih untuk kebutuhan
sehari-hari
Anak saya diberikan ASI Ekslusif selama 6 bulan
Saya menyajikan makanan gizi seimbang untuk anak
Saya membuang feces di jamban yang sehat (WC)
Saya membiasakan keluarga untuk mencuci tangan setelah
buang air besar
Saya mencuci tangan sebelum memegang anak
Saya mencuci tangan sebelum menyiapkan makanan
Saya mencuci tangan setelah menceboki anak
Saya minum air putih untuk menyembuhkan diare
Saya makan tanpa mencuci tangan terlebih dahulu
Saya membeli makanan jajanan pada pedagang keliling
Saya memberikan ASI selama 3 bulan
Saya membeli minuman yang berwarna
Terdapat binatang di dalam toilet saya
Saya mencuci tangan cukup dengan air
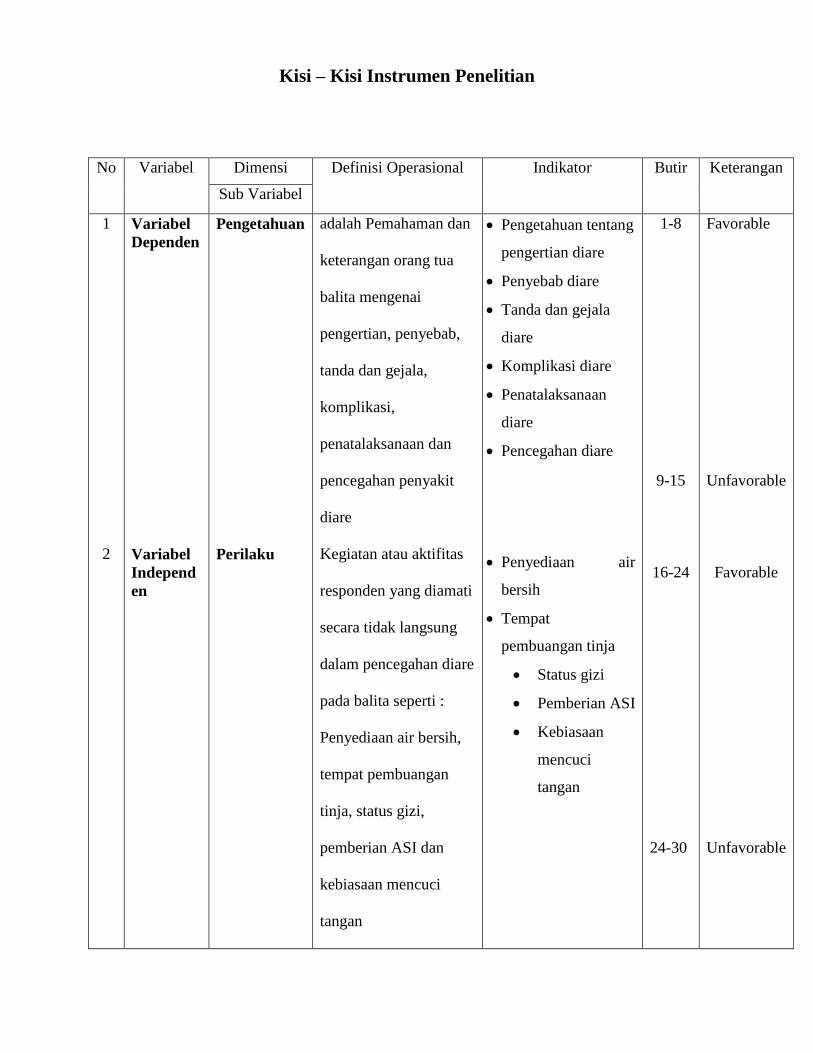
Kisi – Kisi Instrumen Penelitian
No Variabel Dimensi Definisi Operasional Indikator Butir Keterangan
Sub Variabel
1
2
Variabel
Dependen
Variabel
Independ
en
Pengetahuan
Perilaku
adalah Pemahaman dan
keterangan orang tua
balita mengenai
pengertian, penyebab,
tanda dan gejala,
komplikasi,
penatalaksanaan dan
pencegahan penyakit
diare
Kegiatan atau aktifitas
responden yang diamati
secara tidak langsung
dalam pencegahan diare
pada balita seperti :
Penyediaan air bersih,
tempat pembuangan
tinja, status gizi,
pemberian ASI dan
kebiasaan mencuci
tangan
Pengetahuan tentang
pengertian diare
Penyebab diare
Tanda dan gejala
diare
Komplikasi diare
Penatalaksanaan
diare
Pencegahan diare
Penyediaan air
bersih
Tempat
pembuangan tinja
Status gizi
Pemberian ASI
Kebiasaan
mencuci
tangan
1-8
9-15
16-24
24-30
Favorable
Unfavorable
Favorable
Unfavorable
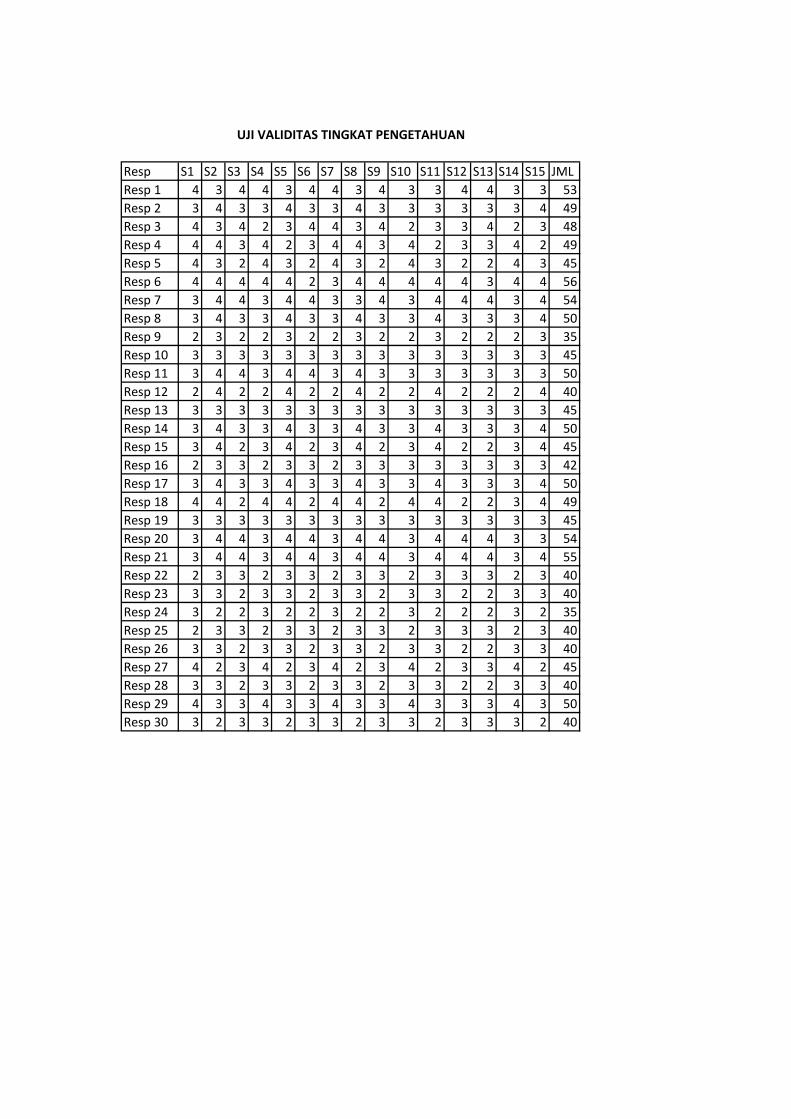
Resp S1 S2 S3 S4 S5 S6 S7 S8 S9 S10 S11 S12 S13 S14 S15 JML
Resp 1 4 3 4 4 3 4 4 3 4 3 3 4 4 3 3 53
Resp 2 3 4 3 3 4 3 3 4 3 3 3 3 3 3 4 49
Resp 3 4 3 4 2 3 4 4 3 4 2 3 3 4 2 3 48
Resp 4 4 4 3 4 2 3 4 4 3 4 2 3 3 4 2 49
Resp 5 4 3 2 4 3 2 4 3 2 4 3 2 2 4 3 45
Resp 6 4 4 4 4 4 2 3 4 4 4 4 4 3 4 4 56
Resp 7 3 4 4 3 4 4 3 3 4 3 4 4 4 3 4 54
Resp 8 3 4 3 3 4 3 3 4 3 3 4 3 3 3 4 50
Resp 9 2 3 2 2 3 2 2 3 2 2 3 2 2 2 3 35
Resp 10 3 3 3 3 3 3 3 3 3 3 3 3 3 3 3 45
Resp 11 3 4 4 3 4 4 3 4 3 3 3 3 3 3 3 50
Resp 12 2 4 2 2 4 2 2 4 2 2 4 2 2 2 4 40
Resp 13 3 3 3 3 3 3 3 3 3 3 3 3 3 3 3 45
Resp 14 3 4 3 3 4 3 3 4 3 3 4 3 3 3 4 50
Resp 15 3 4 2 3 4 2 3 4 2 3 4 2 2 3 4 45
Resp 16 2 3 3 2 3 3 2 3 3 3 3 3 3 3 3 42
Resp 17 3 4 3 3 4 3 3 4 3 3 4 3 3 3 4 50
Resp 18 4 4 2 4 4 2 4 4 2 4 4 2 2 3 4 49
Resp 19 3 3 3 3 3 3 3 3 3 3 3 3 3 3 3 45
Resp 20 3 4 4 3 4 4 3 4 4 3 4 4 4 3 3 54
Resp 21 3 4 4 3 4 4 3 4 4 3 4 4 4 3 4 55
Resp 22 2 3 3 2 3 3 2 3 3 2 3 3 3 2 3 40
Resp 23 3 3 2 3 3 2 3 3 2 3 3 2 2 3 3 40
Resp 24 3 2 2 3 2 2 3 2 2 3 2 2 2 3 2 35
Resp 25 2 3 3 2 3 3 2 3 3 2 3 3 3 2 3 40
Resp 26 3 3 2 3 3 2 3 3 2 3 3 2 2 3 3 40
Resp 27 4 2 3 4 2 3 4 2 3 4 2 3 3 4 2 45
Resp 28 3 3 2 3 3 2 3 3 2 3 3 2 2 3 3 40
Resp 29 4 3 3 4 3 3 4 3 3 4 3 3 3 4 3 50
Resp 30 3 2 3 3 2 3 3 2 3 3 2 3 3 3 2 40
UJI VALIDITAS TINGKAT PENGETAHUAN

UJI VALIDITAS TINGKAT PENGETAHUAN
Correlations
1 .000 .225 .849** -.14 .100 .961** .008 .242 .754** -.13 .184 .184 .710** -.13 .537**
. 1.0 .231 .000 .475 .599 .000 .967 .199 .000 .509 .332 .332 .000 .509 .002
30 30 30 30 30 30 30 30 30 30 30 30 30 30 30 30
.000 1 .259 .052 .855** .167 -.05 .961** .220 .057 .785** .255 .179 .000 .785** .639**
1.0 . .168 .785 .000 .379 .775 .000 .243 .767 .000 .173 .345 1.0 .000 .000
30 30 30 30 30 30 30 30 30 30 30 30 30 30 30 30
.225 .259 1 .074 .238 .877** .155 .186 .969** .005 .168 .940** .940** .079 .098 .743**
.231 .168 . .696 .205 .000 .412 .325 .000 .979 .374 .000 .000 .677 .606 .000
30 30 30 30 30 30 30 30 30 30 30 30 30 30 30 30
.849** .052 .074 1 -.09 -.06 .801** .055 .080 .920** -.09 .161 .010 .878** -.09 .496**
.000 .785 .696 . .620 .748 .000 .771 .676 .000 .624 .394 .958 .000 .624 .005
30 30 30 30 30 30 30 30 30 30 30 30 30 30 30 30
-.14 .855** .238 -.09 1 .141 -.20 .812** .196 -.10 .931** .224 .151 -.17 .931** .558**
.475 .000 .205 .620 . .457 .296 .000 .299 .589 .000 .233 .425 .370 .000 .001
30 30 30 30 30 30 30 30 30 30 30 30 30 30 30 30
.100 .167 .877** -.06 .141 1 .167 .087 .836** -.14 .057 .795** .933** -.08 -.01 .590**
.599 .379 .000 .748 .457 . .377 .648 .000 .450 .765 .000 .000 .673 .941 .001
30 30 30 30 30 30 30 30 30 30 30 30 30 30 30 30
.961** -.05 .155 .801** -.20 .167 1 -.05 .167 .695** -.19 .100 .179 .643** -.19 .463**
.000 .775 .412 .000 .296 .377 . .794 .379 .000 .302 .598 .343 .000 .302 .010
30 30 30 30 30 30 30 30 30 30 30 30 30 30 30 30
.008 .961** .186 .055 .812** .087 -.05 1 .141 .060 .733** .171 .093 .000 .733** .575**
.967 .000 .325 .771 .000 .648 .794 . .456 .752 .000 .366 .624 1.0 .000 .001
30 30 30 30 30 30 30 30 30 30 30 30 30 30 30 30
.242 .220 .969** .080 .196 .836** .167 .141 1 .008 .190 .967** .967** .082 .117 .739**
.199 .243 .000 .676 .299 .000 .379 .456 . .967 .316 .000 .000 .665 .539 .000
30 30 30 30 30 30 30 30 30 30 30 30 30 30 30 30
.754** .057 .005 .920** -.10 -.14 .695** .060 .008 1 -.10 .093 -.07 .955** -.10 .433*
.000 .767 .979 .000 .589 .450 .000 .752 .967 . .594 .624 .708 .000 .594 .017
30 30 30 30 30 30 30 30 30 30 30 30 30 30 30 30
-.13 .785** .168 -.09 .931** .057 -.19 .733** .190 -.10 1 .213 .137 -.18 .922** .518**
.509 .000 .374 .624 .000 .765 .302 .000 .316 .594 . .258 .470 .350 .000 .003
30 30 30 30 30 30 30 30 30 30 30 30 30 30 30 30
.184 .255 .940** .161 .224 .795** .100 .171 .967** .093 .213 1 .926** .172 .137 .754**
.332 .173 .000 .394 .233 .000 .598 .366 .000 .624 .258 . .000 .362 .470 .000
30 30 30 30 30 30 30 30 30 30 30 30 30 30 30 30
.184 .179 .940** .010 .151 .933** .179 .093 .967** -.07 .137 .926** 1 .000 .061 .685**
.332 .345 .000 .958 .425 .000 .343 .624 .000 .708 .470 .000 . 1.0 .749 .000
30 30 30 30 30 30 30 30 30 30 30 30 30 30 30 30
.710** .000 .079 .878** -.17 -.08 .643** .000 .082 .955** -.18 .172 .000 1 -.18 .423*
.000 1.0 .677 .000 .370 .673 .000 1.0 .665 .000 .350 .362 1.0 . .350 .020
30 30 30 30 30 30 30 30 30 30 30 30 30 30 30 30
-.13 .785** .098 -.09 .931** -.01 -.19 .733** .117 -.10 .922** .137 .061 -.18 1 .474**
.509 .000 .606 .624 .000 .941 .302 .000 .539 .594 .000 .470 .749 .350 . .008
30 30 30 30 30 30 30 30 30 30 30 30 30 30 30 30
.537** .639** .743** .496** .558** .590** .463** .575** .739** .433* .518** .754** .685** .423* .474** 1
.002 .000 .000 .005 .001 .001 .010 .001 .000 .017 .003 .000 .000 .020 .008 .
30 30 30 30 30 30 30 30 30 30 30 30 30 30 30 30
Pearson Correlation
Sig. (2-tailed)
N
Pearson Correlation
Sig. (2-tailed)
N
Pearson Correlation
Sig. (2-tailed)
N
Pearson Correlation
Sig. (2-tailed)
N
Pearson Correlation
Sig. (2-tailed)
N
Pearson Correlation
Sig. (2-tailed)
N
Pearson Correlation
Sig. (2-tailed)
N
Pearson Correlation
Sig. (2-tailed)
N
Pearson Correlation
Sig. (2-tailed)
N
Pearson Correlation
Sig. (2-tailed)
N
Pearson Correlation
Sig. (2-tailed)
N
Pearson Correlation
Sig. (2-tailed)
N
Pearson Correlation
Sig. (2-tailed)
N
Pearson Correlation
Sig. (2-tailed)
N
Pearson Correlation
Sig. (2-tailed)
N
Pearson Correlation
Sig. (2-tailed)
N
S1
S2
S3
S4
S5
S6
S7
S8
S9
S10
S11
S12
S13
S14
S15
JML
S1 S2 S3 S4 S5 S6 S7 S8 S9 S10 S11 S12 S13 S14 S15 JML
Correlat ion is signif icant at the 0.01 lev el (2-tailed).**.
Correlat ion is signif icant at the 0.05 lev el (2-tailed).*.

****** Method 1 (space saver) will be used for this analysis ******
�
R E L I A B I L I T Y A N A L Y S I S - S C A L E (A L P H A)
Item-total Statistics
Scale Scale Corrected
Mean Variance Item- Alpha
if Item if Item Total if Item
Deleted Deleted Correlation Deleted
S1 42.8667 30.2575 .4490 .8521
S2 42.6333 29.4816 .5637 .8461
S3 43.0333 28.1023 .6777 .8390
S4 42.9333 30.5471 .4018 .8545
S5 42.7000 29.9414 .4684 .8512
S6 43.1000 29.4724 .4992 .8496
S7 42.9000 30.9207 .3703 .8559
S8 42.6667 30.0230 .4928 .8498
S9 43.0667 28.3402 .6751 .8395
S10 42.9333 31.2368 .3418 .8571
S11 42.7667 30.3920 .4274 .8532
S12 43.1000 28.4379 .6965 .8387
S13 43.1000 28.9897 .6146 .8432
S14 42.9667 31.4126 .3353 .8572
S15 42.7667 30.7368 .3782 .8557
Reliability Coefficients
N of Cases = 30.0 N of Items = 15
Alpha = .8583
HASIL RELIABILITAS TINGKAT PENGETAHUAN
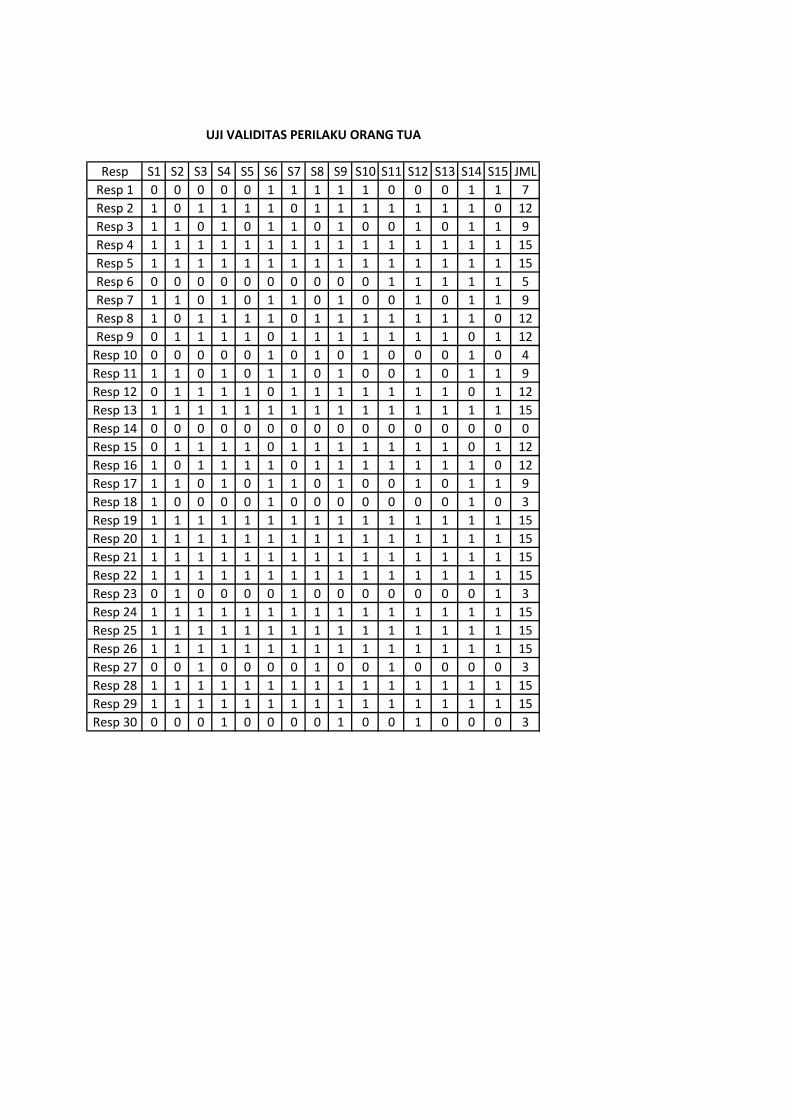
Resp S1 S2 S3 S4 S5 S6 S7 S8 S9 S10 S11 S12 S13 S14 S15 JML
Resp 1 0 0 0 0 0 1 1 1 1 1 0 0 0 1 1 7
Resp 2 1 0 1 1 1 1 0 1 1 1 1 1 1 1 0 12
Resp 3 1 1 0 1 0 1 1 0 1 0 0 1 0 1 1 9
Resp 4 1 1 1 1 1 1 1 1 1 1 1 1 1 1 1 15
Resp 5 1 1 1 1 1 1 1 1 1 1 1 1 1 1 1 15
Resp 6 0 0 0 0 0 0 0 0 0 0 1 1 1 1 1 5
Resp 7 1 1 0 1 0 1 1 0 1 0 0 1 0 1 1 9
Resp 8 1 0 1 1 1 1 0 1 1 1 1 1 1 1 0 12
Resp 9 0 1 1 1 1 0 1 1 1 1 1 1 1 0 1 12
Resp 10 0 0 0 0 0 1 0 1 0 1 0 0 0 1 0 4
Resp 11 1 1 0 1 0 1 1 0 1 0 0 1 0 1 1 9
Resp 12 0 1 1 1 1 0 1 1 1 1 1 1 1 0 1 12
Resp 13 1 1 1 1 1 1 1 1 1 1 1 1 1 1 1 15
Resp 14 0 0 0 0 0 0 0 0 0 0 0 0 0 0 0 0
Resp 15 0 1 1 1 1 0 1 1 1 1 1 1 1 0 1 12
Resp 16 1 0 1 1 1 1 0 1 1 1 1 1 1 1 0 12
Resp 17 1 1 0 1 0 1 1 0 1 0 0 1 0 1 1 9
Resp 18 1 0 0 0 0 1 0 0 0 0 0 0 0 1 0 3
Resp 19 1 1 1 1 1 1 1 1 1 1 1 1 1 1 1 15
Resp 20 1 1 1 1 1 1 1 1 1 1 1 1 1 1 1 15
Resp 21 1 1 1 1 1 1 1 1 1 1 1 1 1 1 1 15
Resp 22 1 1 1 1 1 1 1 1 1 1 1 1 1 1 1 15
Resp 23 0 1 0 0 0 0 1 0 0 0 0 0 0 0 1 3
Resp 24 1 1 1 1 1 1 1 1 1 1 1 1 1 1 1 15
Resp 25 1 1 1 1 1 1 1 1 1 1 1 1 1 1 1 15
Resp 26 1 1 1 1 1 1 1 1 1 1 1 1 1 1 1 15
Resp 27 0 0 1 0 0 0 0 1 0 0 1 0 0 0 0 3
Resp 28 1 1 1 1 1 1 1 1 1 1 1 1 1 1 1 15
Resp 29 1 1 1 1 1 1 1 1 1 1 1 1 1 1 1 15
Resp 30 0 0 0 1 0 0 0 0 1 0 0 1 0 0 0 3
UJI VALIDITAS PERILAKU ORANG TUA
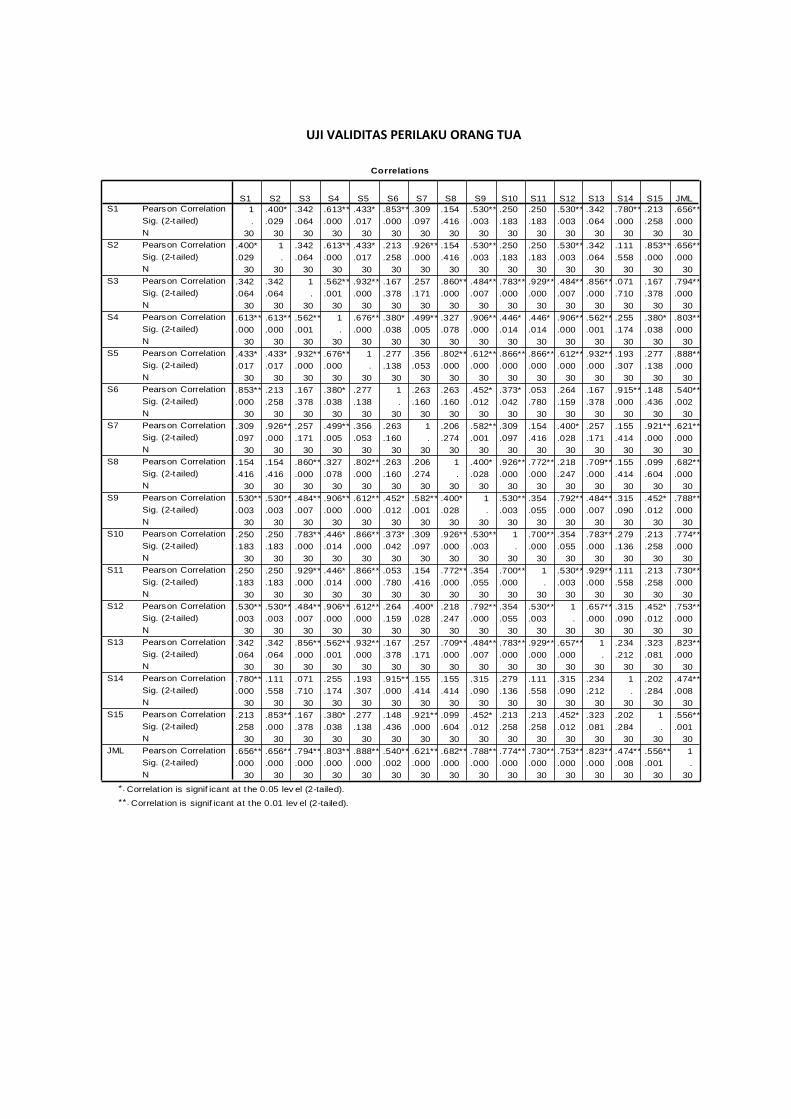
UJI VALIDITAS PERILAKU ORANG TUA
Correlations
1 .400* .342 .613** .433* .853** .309 .154 .530** .250 .250 .530** .342 .780** .213 .656**
. .029 .064 .000 .017 .000 .097 .416 .003 .183 .183 .003 .064 .000 .258 .000
30 30 30 30 30 30 30 30 30 30 30 30 30 30 30 30
.400* 1 .342 .613** .433* .213 .926** .154 .530** .250 .250 .530** .342 .111 .853** .656**
.029 . .064 .000 .017 .258 .000 .416 .003 .183 .183 .003 .064 .558 .000 .000
30 30 30 30 30 30 30 30 30 30 30 30 30 30 30 30
.342 .342 1 .562** .932** .167 .257 .860** .484** .783** .929** .484** .856** .071 .167 .794**
.064 .064 . .001 .000 .378 .171 .000 .007 .000 .000 .007 .000 .710 .378 .000
30 30 30 30 30 30 30 30 30 30 30 30 30 30 30 30
.613** .613** .562** 1 .676** .380* .499** .327 .906** .446* .446* .906** .562** .255 .380* .803**
.000 .000 .001 . .000 .038 .005 .078 .000 .014 .014 .000 .001 .174 .038 .000
30 30 30 30 30 30 30 30 30 30 30 30 30 30 30 30
.433* .433* .932** .676** 1 .277 .356 .802** .612** .866** .866** .612** .932** .193 .277 .888**
.017 .017 .000 .000 . .138 .053 .000 .000 .000 .000 .000 .000 .307 .138 .000
30 30 30 30 30 30 30 30 30 30 30 30 30 30 30 30
.853** .213 .167 .380* .277 1 .263 .263 .452* .373* .053 .264 .167 .915** .148 .540**
.000 .258 .378 .038 .138 . .160 .160 .012 .042 .780 .159 .378 .000 .436 .002
30 30 30 30 30 30 30 30 30 30 30 30 30 30 30 30
.309 .926** .257 .499** .356 .263 1 .206 .582** .309 .154 .400* .257 .155 .921** .621**
.097 .000 .171 .005 .053 .160 . .274 .001 .097 .416 .028 .171 .414 .000 .000
30 30 30 30 30 30 30 30 30 30 30 30 30 30 30 30
.154 .154 .860** .327 .802** .263 .206 1 .400* .926** .772** .218 .709** .155 .099 .682**
.416 .416 .000 .078 .000 .160 .274 . .028 .000 .000 .247 .000 .414 .604 .000
30 30 30 30 30 30 30 30 30 30 30 30 30 30 30 30
.530** .530** .484** .906** .612** .452* .582** .400* 1 .530** .354 .792** .484** .315 .452* .788**
.003 .003 .007 .000 .000 .012 .001 .028 . .003 .055 .000 .007 .090 .012 .000
30 30 30 30 30 30 30 30 30 30 30 30 30 30 30 30
.250 .250 .783** .446* .866** .373* .309 .926** .530** 1 .700** .354 .783** .279 .213 .774**
.183 .183 .000 .014 .000 .042 .097 .000 .003 . .000 .055 .000 .136 .258 .000
30 30 30 30 30 30 30 30 30 30 30 30 30 30 30 30
.250 .250 .929** .446* .866** .053 .154 .772** .354 .700** 1 .530** .929** .111 .213 .730**
.183 .183 .000 .014 .000 .780 .416 .000 .055 .000 . .003 .000 .558 .258 .000
30 30 30 30 30 30 30 30 30 30 30 30 30 30 30 30
.530** .530** .484** .906** .612** .264 .400* .218 .792** .354 .530** 1 .657** .315 .452* .753**
.003 .003 .007 .000 .000 .159 .028 .247 .000 .055 .003 . .000 .090 .012 .000
30 30 30 30 30 30 30 30 30 30 30 30 30 30 30 30
.342 .342 .856** .562** .932** .167 .257 .709** .484** .783** .929** .657** 1 .234 .323 .823**
.064 .064 .000 .001 .000 .378 .171 .000 .007 .000 .000 .000 . .212 .081 .000
30 30 30 30 30 30 30 30 30 30 30 30 30 30 30 30
.780** .111 .071 .255 .193 .915** .155 .155 .315 .279 .111 .315 .234 1 .202 .474**
.000 .558 .710 .174 .307 .000 .414 .414 .090 .136 .558 .090 .212 . .284 .008
30 30 30 30 30 30 30 30 30 30 30 30 30 30 30 30
.213 .853** .167 .380* .277 .148 .921** .099 .452* .213 .213 .452* .323 .202 1 .556**
.258 .000 .378 .038 .138 .436 .000 .604 .012 .258 .258 .012 .081 .284 . .001
30 30 30 30 30 30 30 30 30 30 30 30 30 30 30 30
.656** .656** .794** .803** .888** .540** .621** .682** .788** .774** .730** .753** .823** .474** .556** 1
.000 .000 .000 .000 .000 .002 .000 .000 .000 .000 .000 .000 .000 .008 .001 .
30 30 30 30 30 30 30 30 30 30 30 30 30 30 30 30
Pearson Correlation
Sig. (2-tailed)
N
Pearson Correlation
Sig. (2-tailed)
N
Pearson Correlation
Sig. (2-tailed)
N
Pearson Correlation
Sig. (2-tailed)
N
Pearson Correlation
Sig. (2-tailed)
N
Pearson Correlation
Sig. (2-tailed)
N
Pearson Correlation
Sig. (2-tailed)
N
Pearson Correlation
Sig. (2-tailed)
N
Pearson Correlation
Sig. (2-tailed)
N
Pearson Correlation
Sig. (2-tailed)
N
Pearson Correlation
Sig. (2-tailed)
N
Pearson Correlation
Sig. (2-tailed)
N
Pearson Correlation
Sig. (2-tailed)
N
Pearson Correlation
Sig. (2-tailed)
N
Pearson Correlation
Sig. (2-tailed)
N
Pearson Correlation
Sig. (2-tailed)
N
S1
S2
S3
S4
S5
S6
S7
S8
S9
S10
S11
S12
S13
S14
S15
JML
S1 S2 S3 S4 S5 S6 S7 S8 S9 S10 S11 S12 S13 S14 S15 JML
Correlat ion is signif icant at the 0.05 lev el (2-tailed).*.
Correlat ion is signif icant at the 0.01 lev el (2-tailed).**.
****** Method 1 (space saver) will be used for this analysis ******
�
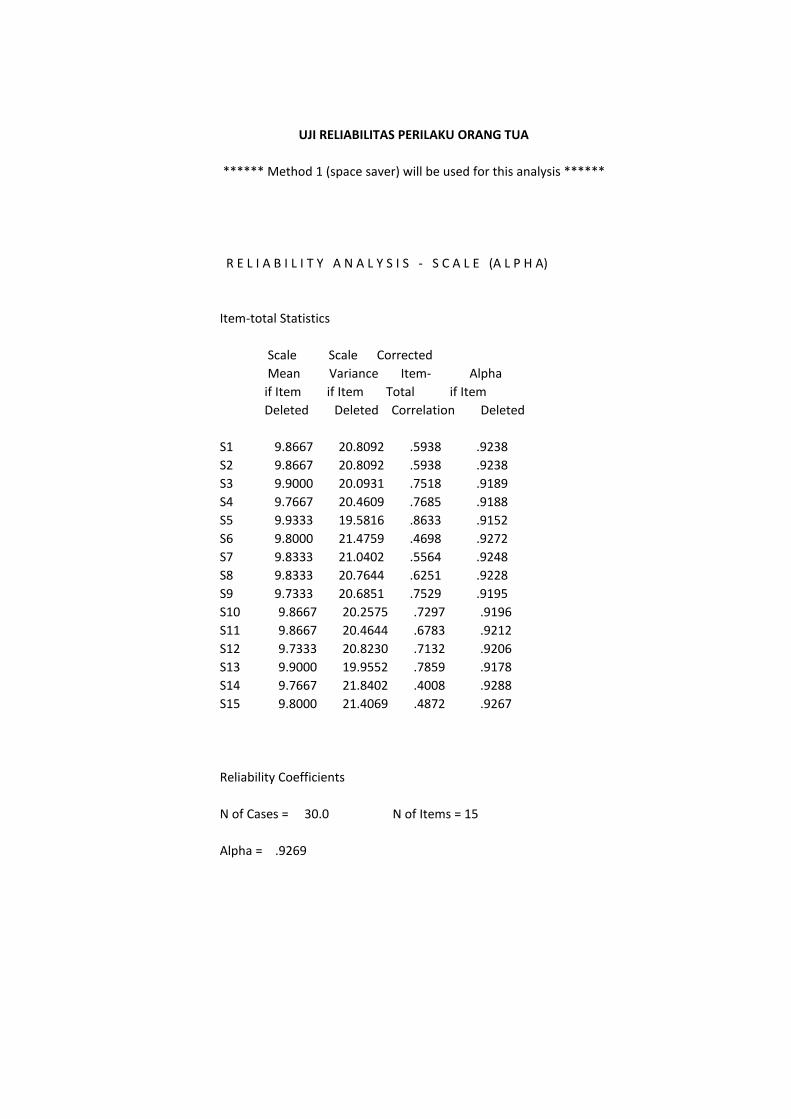
R E L I A B I L I T Y A N A L Y S I S - S C A L E (A L P H A)
Item-total Statistics
Scale Scale Corrected
Mean Variance Item- Alpha
if Item if Item Total if Item
Deleted Deleted Correlation Deleted
S1 9.8667 20.8092 .5938 .9238
S2 9.8667 20.8092 .5938 .9238
S3 9.9000 20.0931 .7518 .9189
S4 9.7667 20.4609 .7685 .9188
S5 9.9333 19.5816 .8633 .9152
S6 9.8000 21.4759 .4698 .9272
S7 9.8333 21.0402 .5564 .9248
S8 9.8333 20.7644 .6251 .9228
S9 9.7333 20.6851 .7529 .9195
S10 9.8667 20.2575 .7297 .9196
S11 9.8667 20.4644 .6783 .9212
S12 9.7333 20.8230 .7132 .9206
S13 9.9000 19.9552 .7859 .9178
S14 9.7667 21.8402 .4008 .9288
S15 9.8000 21.4069 .4872 .9267
Reliability Coefficients
N of Cases = 30.0 N of Items = 15
Alpha = .9269
UJI RELIABILITAS PERILAKU ORANG TUA
Resp S1 S2 S3 S4 S5 S6 S7 S8 S9 S10 S11 S12 S13 S14 S15 JM M K
Resp 1 3 4 4 3 2 4 4 3 4 4 4 3 4 3 4 53 46,5 2
Resp 2 3 4 2 4 3 4 4 2 4 3 4 2 4 3 4 50 46,5 2
Resp 3 4 2 2 3 4 4 3 3 4 2 4 3 4 3 4 49 46,5 2
Resp 4 4 3 2 3 2 4 3 3 3 2 3 2 3 3 2 42 46,5 1
Resp 5 3 4 4 2 3 3 4 3 2 4 3 4 2 3 4 48 46,5 2
Resp 6 4 4 2 4 4 4 3 2 3 4 2 3 4 2 3 48 46,5 2
Resp 7 4 3 2 3 4 3 2 3 4 3 2 4 3 2 4 46 46,5 1
Resp 8 3 4 2 3 4 4 2 4 3 2 3 3 3 4 4 48 46,5 2
Resp 9 2 4 3 4 2 3 4 3 4 3 4 3 2 4 4 49 46,5 2
Resp 10 3 4 3 2 4 3 2 4 3 4 2 3 3 3 3 46 46,5 1
Resp 11 3 2 3 2 3 2 3 4 2 4 3 4 2 4 3 44 46,5 1
Resp 12 4 3 4 4 2 4 3 4 4 2 4 3 4 2 2 49 46,5 2
Resp 13 3 2 4 4 3 4 2 4 3 4 2 4 3 3 4 49 46,5 2
Resp 14 3 4 4 2 3 2 3 4 2 4 3 4 3 3 3 47 46,5 2
Resp 15 2 4 3 4 2 4 3 4 2 3 4 2 4 3 3 47 46,5 2
Resp 16 2 4 4 3 2 4 3 4 4 2 4 3 4 2 4 49 46,5 2
Resp 17 3 4 2 4 3 4 2 4 3 2 4 3 4 2 3 47 46,5 2
Resp 18 2 4 3 2 4 3 2 4 4 3 4 2 4 4 2 47 46,5 2
Resp 19 3 4 2 4 3 2 3 4 2 3 2 3 2 3 3 43 46,5 1
Resp 20 4 3 2 3 2 3 2 3 2 3 2 3 4 2 3 41 46,5 1
Resp 21 3 2 3 2 3 2 3 2 3 2 3 2 3 4 3 40 46,5 1
Resp 22 4 3 4 4 3 2 3 4 3 2 3 2 4 4 2 47 46,5 2
Resp 23 3 4 2 3 4 2 3 4 2 4 3 3 2 4 3 46 46,5 1
Resp 24 4 3 4 3 4 2 3 4 2 4 3 2 4 3 2 47 46,5 2
Resp 25 4 3 3 4 2 4 3 4 2 3 4 4 2 4 3 49 46,5 2
Resp 26 3 4 4 4 2 4 3 2 4 3 2 4 3 4 2 48 46,5 2
Resp 27 3 2 3 4 2 3 4 2 3 4 2 3 4 2 3 44 46,5 1
Resp 28 4 4 2 2 4 3 4 2 3 4 2 4 3 2 4 47 46,5 2
Resp 29 3 2 3 4 2 4 3 4 3 4 4 3 4 2 3 48 46,5 2
Resp 30 3 4 4 2 3 4 2 4 4 3 4 2 3 2 4 48 46,5 2
Resp 31 2 3 2 3 2 3 2 3 2 4 3 2 3 2 3 39 46,5 1
Resp 32 4 3 4 4 3 4 4 2 3 2 4 2 3 2 4 48 46,5 2
Resp 33 3 2 3 2 4 3 2 3 2 3 2 4 3 4 3 43 46,5 1
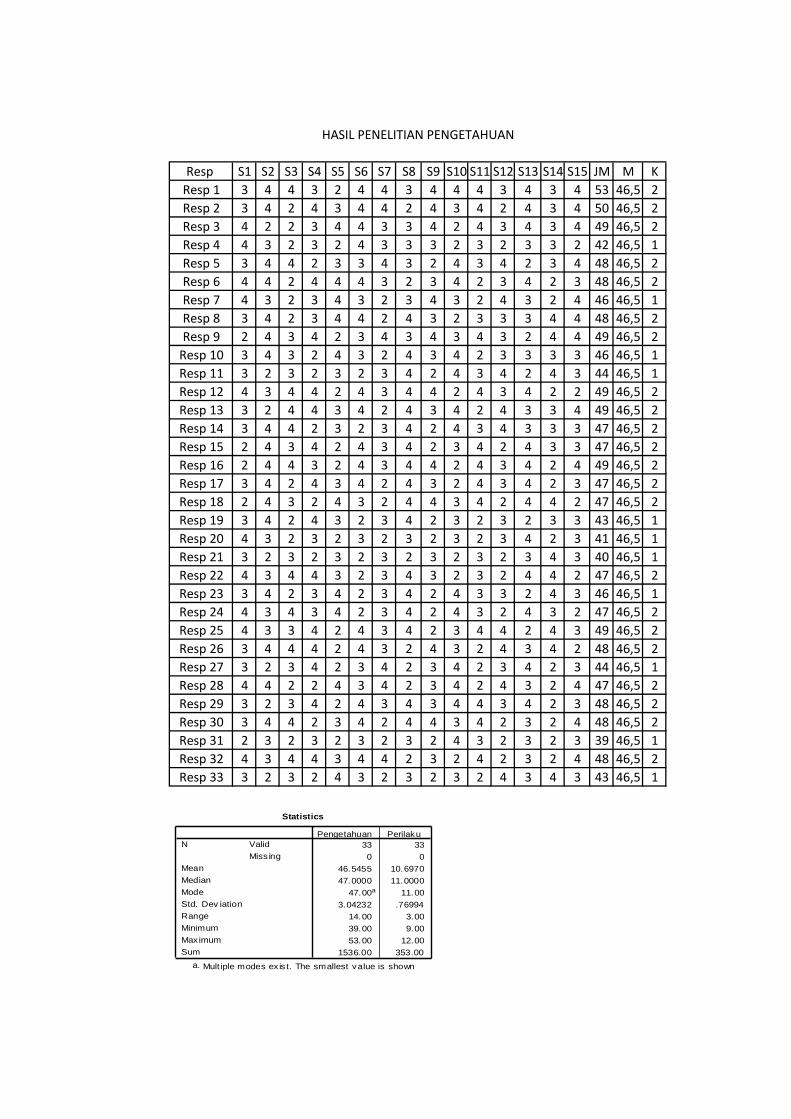
HASIL PENELITIAN PENGETAHUAN
Statistics
33 33
0 0
46.5455 10.6970
47.0000 11.0000
47.00a 11.00
3.04232 .76994
14.00 3.00
39.00 9.00
53.00 12.00
1536.00 353.00
Valid
Miss ing
N
Mean
Median
Mode
Std. Dev iation
Range
Minimum
Maximum
Sum
Pengetahuan Perilaku
Mult iple modes ex is t. The smallest value is showna.
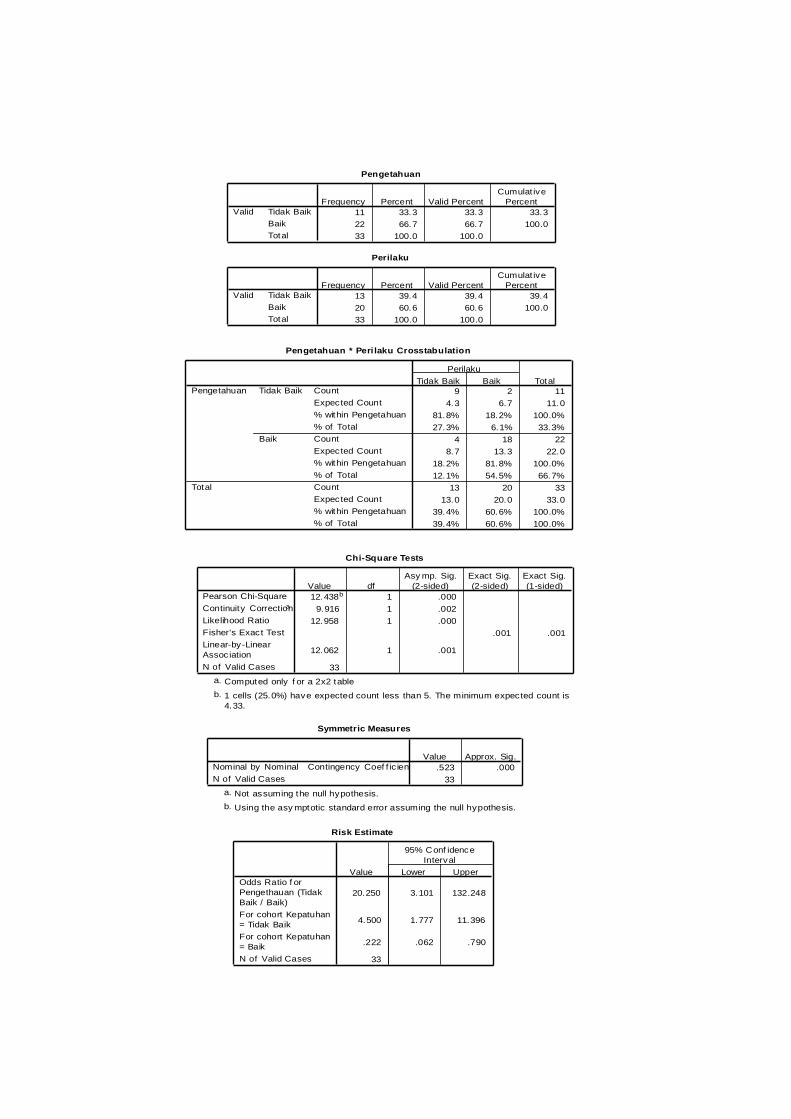
Perilaku
13 39.4 39.4 39.4
20 60.6 60.6 100.0
33 100.0 100.0
Tidak Baik
Baik
Total
Valid
Frequency Percent Valid Percent
Cumulat ive
Percent
Pengetahuan
11 33.3 33.3 33.3
22 66.7 66.7 100.0
33 100.0 100.0
Tidak Baik
Baik
Total
Valid
Frequency Percent Valid Percent
Cumulat ive
Percent
Chi-Square Tests
12.438b 1 .000
9.916 1 .002
12.958 1 .000
.001 .001
12.062 1 .001
33
Pearson Chi-Square
Continuity Correctiona
Likelihood Ratio
Fisher's Exact Test
Linear-by-Linear
Assoc iation
N of Valid Cases
Value df
Asy mp. Sig.
(2-sided)
Exact Sig.
(2-sided)
Exact Sig.
(1-sided)
Computed only f or a 2x2 tablea.
1 cells (25.0%) have expected count less than 5. The minimum expected count is
4.33.
b.
Symmetric Measures
.523 .000
33
Contingency Coef f ic ientNominal by Nominal
N of Valid Cases
Value Approx. Sig.
Not assuming the null hypothesis.a.
Using the asy mptotic standard error assuming the null hypothesis.b.
Risk Estimate
20.250 3.101 132.248
4.500 1.777 11.396
.222 .062 .790
33
Odds Ratio f or
Pengethauan (Tidak
Baik / Baik)
For cohort Kepatuhan
= Tidak Baik
For cohort Kepatuhan
= Baik
N of Valid Cases
Value Lower Upper
95% Conf idence
Interval
Pengetahuan * Peri laku Crosstabulation
9 2 11
4.3 6.7 11.0
81.8% 18.2% 100.0%
27.3% 6.1% 33.3%
4 18 22
8.7 13.3 22.0
18.2% 81.8% 100.0%
12.1% 54.5% 66.7%
13 20 33
13.0 20.0 33.0
39.4% 60.6% 100.0%
39.4% 60.6% 100.0%
Count
Expected Count
% within Pengetahuan
% of Total
Count
Expected Count
% within Pengetahuan
% of Total
Count
Expected Count
% within Pengetahuan
% of Total
Tidak Baik
Baik
Pengetahuan
Total
Tidak Baik Baik
Perilaku
Total
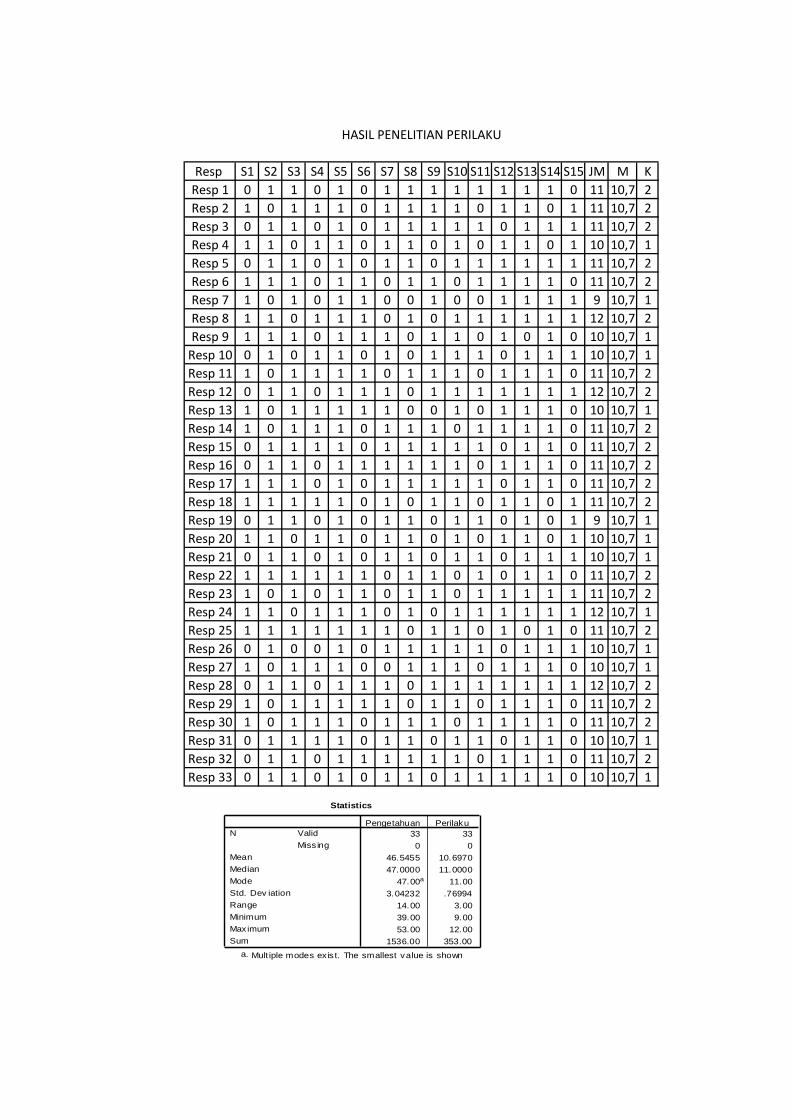
Resp S1 S2 S3 S4 S5 S6 S7 S8 S9 S10 S11 S12 S13 S14 S15 JM M K
Resp 1 0 1 1 0 1 0 1 1 1 1 1 1 1 1 0 11 10,7 2
Resp 2 1 0 1 1 1 0 1 1 1 1 0 1 1 0 1 11 10,7 2
Resp 3 0 1 1 0 1 0 1 1 1 1 1 0 1 1 1 11 10,7 2
Resp 4 1 1 0 1 1 0 1 1 0 1 0 1 1 0 1 10 10,7 1
Resp 5 0 1 1 0 1 0 1 1 0 1 1 1 1 1 1 11 10,7 2
Resp 6 1 1 1 0 1 1 0 1 1 0 1 1 1 1 0 11 10,7 2
Resp 7 1 0 1 0 1 1 0 0 1 0 0 1 1 1 1 9 10,7 1
Resp 8 1 1 0 1 1 1 0 1 0 1 1 1 1 1 1 12 10,7 2
Resp 9 1 1 1 0 1 1 1 0 1 1 0 1 0 1 0 10 10,7 1
Resp 10 0 1 0 1 1 0 1 0 1 1 1 0 1 1 1 10 10,7 1
Resp 11 1 0 1 1 1 1 0 1 1 1 0 1 1 1 0 11 10,7 2
Resp 12 0 1 1 0 1 1 1 0 1 1 1 1 1 1 1 12 10,7 2
Resp 13 1 0 1 1 1 1 1 0 0 1 0 1 1 1 0 10 10,7 1
Resp 14 1 0 1 1 1 0 1 1 1 0 1 1 1 1 0 11 10,7 2
Resp 15 0 1 1 1 1 0 1 1 1 1 1 0 1 1 0 11 10,7 2
Resp 16 0 1 1 0 1 1 1 1 1 1 0 1 1 1 0 11 10,7 2
Resp 17 1 1 1 0 1 0 1 1 1 1 1 0 1 1 0 11 10,7 2
Resp 18 1 1 1 1 1 0 1 0 1 1 0 1 1 0 1 11 10,7 2
Resp 19 0 1 1 0 1 0 1 1 0 1 1 0 1 0 1 9 10,7 1
Resp 20 1 1 0 1 1 0 1 1 0 1 0 1 1 0 1 10 10,7 1
Resp 21 0 1 1 0 1 0 1 1 0 1 1 0 1 1 1 10 10,7 1
Resp 22 1 1 1 1 1 1 0 1 1 0 1 0 1 1 0 11 10,7 2
Resp 23 1 0 1 0 1 1 0 1 1 0 1 1 1 1 1 11 10,7 2
Resp 24 1 1 0 1 1 1 0 1 0 1 1 1 1 1 1 12 10,7 1
Resp 25 1 1 1 1 1 1 1 0 1 1 0 1 0 1 0 11 10,7 2
Resp 26 0 1 0 0 1 0 1 1 1 1 1 0 1 1 1 10 10,7 1
Resp 27 1 0 1 1 1 0 0 1 1 1 0 1 1 1 0 10 10,7 1
Resp 28 0 1 1 0 1 1 1 0 1 1 1 1 1 1 1 12 10,7 2
Resp 29 1 0 1 1 1 1 1 0 1 1 0 1 1 1 0 11 10,7 2
Resp 30 1 0 1 1 1 0 1 1 1 0 1 1 1 1 0 11 10,7 2
Resp 31 0 1 1 1 1 0 1 1 0 1 1 0 1 1 0 10 10,7 1
Resp 32 0 1 1 0 1 1 1 1 1 1 0 1 1 1 0 11 10,7 2
Resp 33 0 1 1 0 1 0 1 1 0 1 1 1 1 1 0 10 10,7 1
HASIL PENELITIAN PERILAKU
Statistics
33 33
0 0
46.5455 10.6970
47.0000 11.0000
47.00a 11.00
3.04232 .76994
14.00 3.00
39.00 9.00
53.00 12.00
1536.00 353.00
Valid
Miss ing
N
Mean
Median
Mode
Std. Dev iation
Range
Minimum
Maximum
Sum
Pengetahuan Perilaku
Mult iple modes ex is t. The smallest value is showna.

HASIL NORMALITAS DATA
Descriptives
1.6667 .08333
1.4969
1.8364
1.6852
2.0000
.229
.47871
1.00
2.00
1.00
1.0000
-.741 .409
-1.548 .798
1.6061 .08638
1.4301
1.7820
1.6178
2.0000
.246
.49620
1.00
2.00
1.00
1.0000
-.455 .409
-1.913 .798
Mean
Lower Bound
Upper Bound
95% Conf idence
Interv al for Mean
5% Trimmed Mean
Median
Variance
Std. Dev iation
Minimum
Maximum
Range
Interquartile Range
Skewness
Kurtosis
Mean
Lower Bound
Upper Bound
95% Conf idence
Interv al for Mean
5% Trimmed Mean
Median
Variance
Std. Dev iation
Minimum
Maximum
Range
Interquartile Range
Skewness
Kurtosis
Pengetahuan
Kepatuhan
Stat is tic Std. Error