lampiran lampiran 1. surat keterangan...
TRANSCRIPT
82
LAMPIRAN
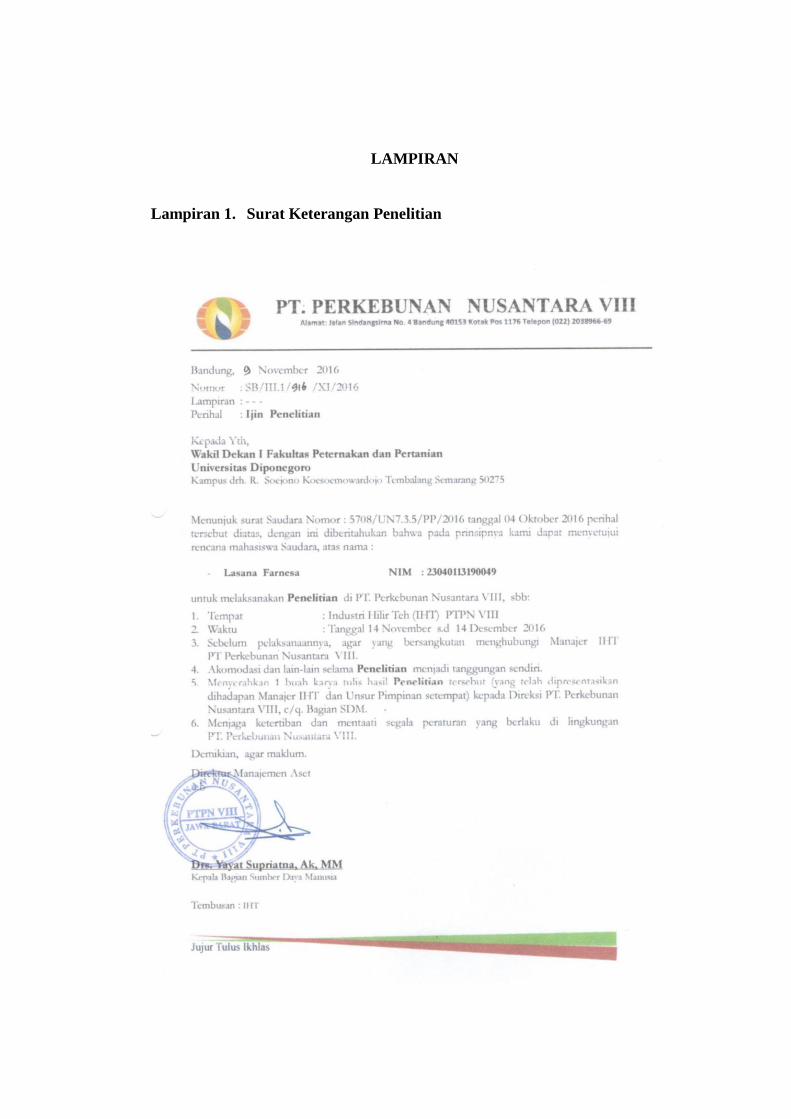
Lampiran 1. Surat Keterangan Penelitian
83
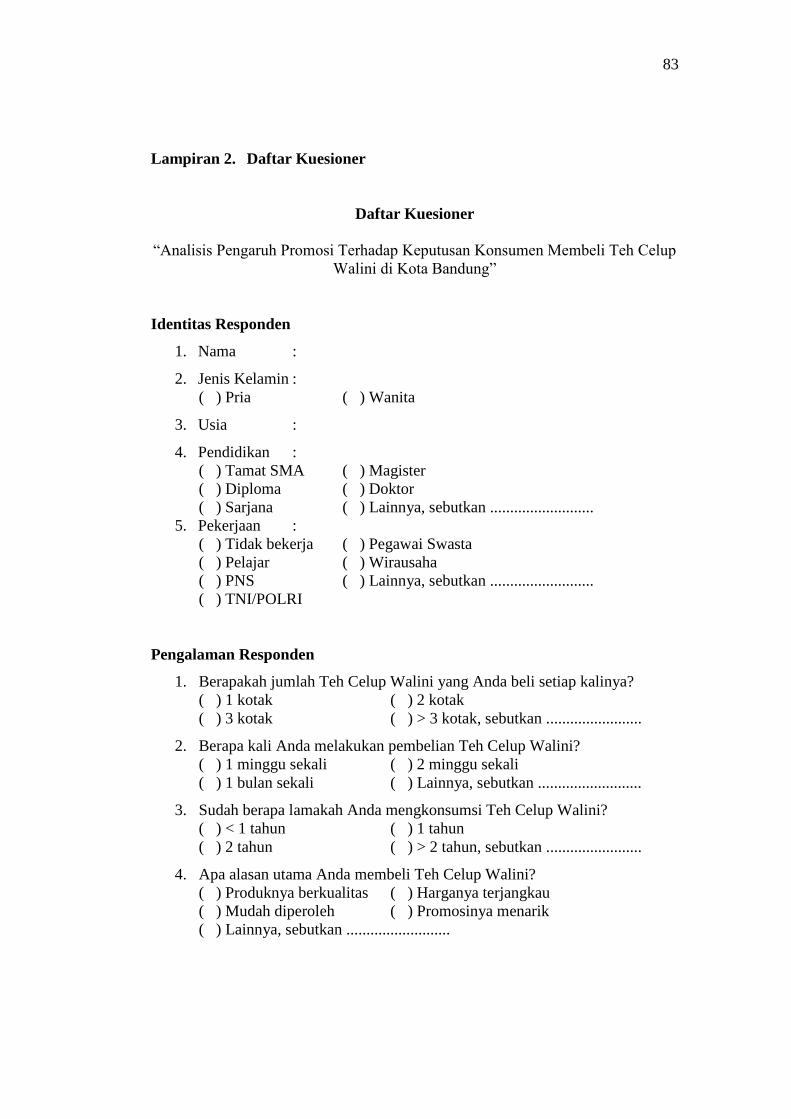
Lampiran 2. Daftar Kuesioner
Daftar Kuesioner
“Analisis Pengaruh Promosi Terhadap Keputusan Konsumen Membeli Teh Celup
Walini di Kota Bandung”
Identitas Responden
1. Nama :
2. Jenis Kelamin :
( ) Pria ( ) Wanita
3. Usia :
4. Pendidikan :
( ) Tamat SMA ( ) Magister
( ) Diploma ( ) Doktor
( ) Sarjana ( ) Lainnya, sebutkan ..........................
5. Pekerjaan :
( ) Tidak bekerja ( ) Pegawai Swasta
( ) Pelajar ( ) Wirausaha
( ) PNS ( ) Lainnya, sebutkan ..........................
( ) TNI/POLRI
Pengalaman Responden
1. Berapakah jumlah Teh Celup Walini yang Anda beli setiap kalinya?
( ) 1 kotak ( ) 2 kotak
( ) 3 kotak ( ) > 3 kotak, sebutkan ........................
2. Berapa kali Anda melakukan pembelian Teh Celup Walini?
( ) 1 minggu sekali ( ) 2 minggu sekali
( ) 1 bulan sekali ( ) Lainnya, sebutkan ..........................
3. Sudah berapa lamakah Anda mengkonsumsi Teh Celup Walini?
( ) < 1 tahun ( ) 1 tahun
( ) 2 tahun ( ) > 2 tahun, sebutkan ........................
4. Apa alasan utama Anda membeli Teh Celup Walini?
( ) Produknya berkualitas ( ) Harganya terjangkau
( ) Mudah diperoleh ( ) Promosinya menarik
( ) Lainnya, sebutkan ..........................
84
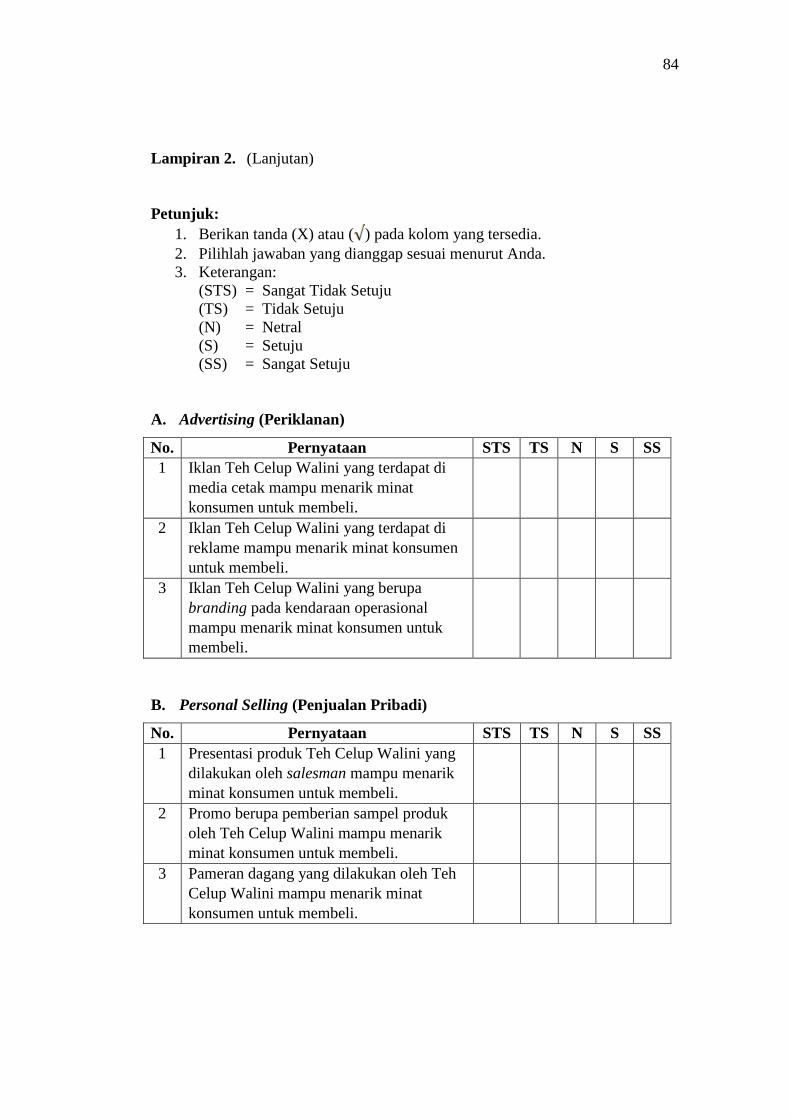
Lampiran 2. (Lanjutan)
Petunjuk:
1. Berikan tanda (X) atau ( ) pada kolom yang tersedia.
2. Pilihlah jawaban yang dianggap sesuai menurut Anda.
3. Keterangan:
(STS) = Sangat Tidak Setuju
(TS) = Tidak Setuju
(N) = Netral
(S) = Setuju
(SS) = Sangat Setuju
A. Advertising (Periklanan)
No. Pernyataan STS TS N S SS
1 Iklan Teh Celup Walini yang terdapat di
media cetak mampu menarik minat
konsumen untuk membeli.
2 Iklan Teh Celup Walini yang terdapat di
reklame mampu menarik minat konsumen
untuk membeli.
3 Iklan Teh Celup Walini yang berupa
branding pada kendaraan operasional
mampu menarik minat konsumen untuk
membeli.
B. Personal Selling (Penjualan Pribadi)
No. Pernyataan STS TS N S SS
1 Presentasi produk Teh Celup Walini yang
dilakukan oleh salesman mampu menarik
minat konsumen untuk membeli.
2 Promo berupa pemberian sampel produk
oleh Teh Celup Walini mampu menarik
minat konsumen untuk membeli.
3 Pameran dagang yang dilakukan oleh Teh
Celup Walini mampu menarik minat
konsumen untuk membeli.
85
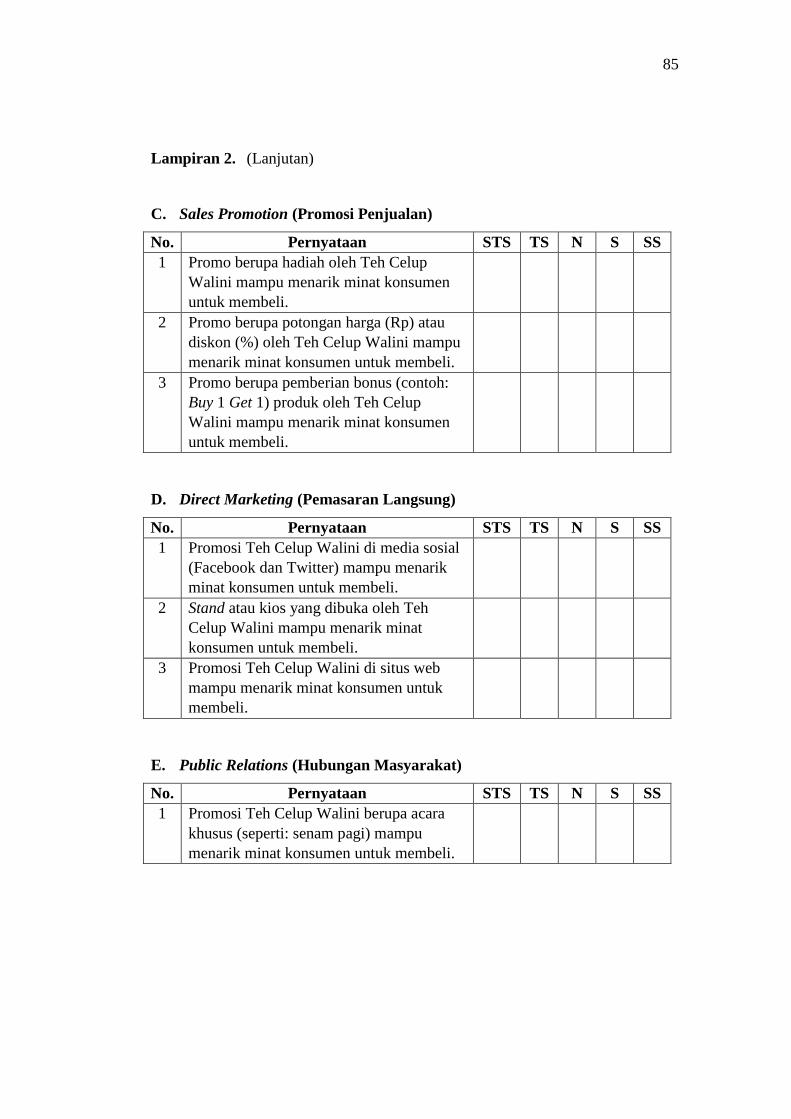
Lampiran 2. (Lanjutan)
C. Sales Promotion (Promosi Penjualan)
No. Pernyataan STS TS N S SS
1 Promo berupa hadiah oleh Teh Celup
Walini mampu menarik minat konsumen
untuk membeli.
2 Promo berupa potongan harga (Rp) atau
diskon (%) oleh Teh Celup Walini mampu
menarik minat konsumen untuk membeli.
3 Promo berupa pemberian bonus (contoh:
Buy 1 Get 1) produk oleh Teh Celup
Walini mampu menarik minat konsumen
untuk membeli.
D. Direct Marketing (Pemasaran Langsung)
No. Pernyataan STS TS N S SS
1 Promosi Teh Celup Walini di media sosial
(Facebook dan Twitter) mampu menarik
minat konsumen untuk membeli.
2 Stand atau kios yang dibuka oleh Teh
Celup Walini mampu menarik minat
konsumen untuk membeli.
3 Promosi Teh Celup Walini di situs web
mampu menarik minat konsumen untuk
membeli.
E. Public Relations (Hubungan Masyarakat)
No. Pernyataan STS TS N S SS
1 Promosi Teh Celup Walini berupa acara
khusus (seperti: senam pagi) mampu
menarik minat konsumen untuk membeli.
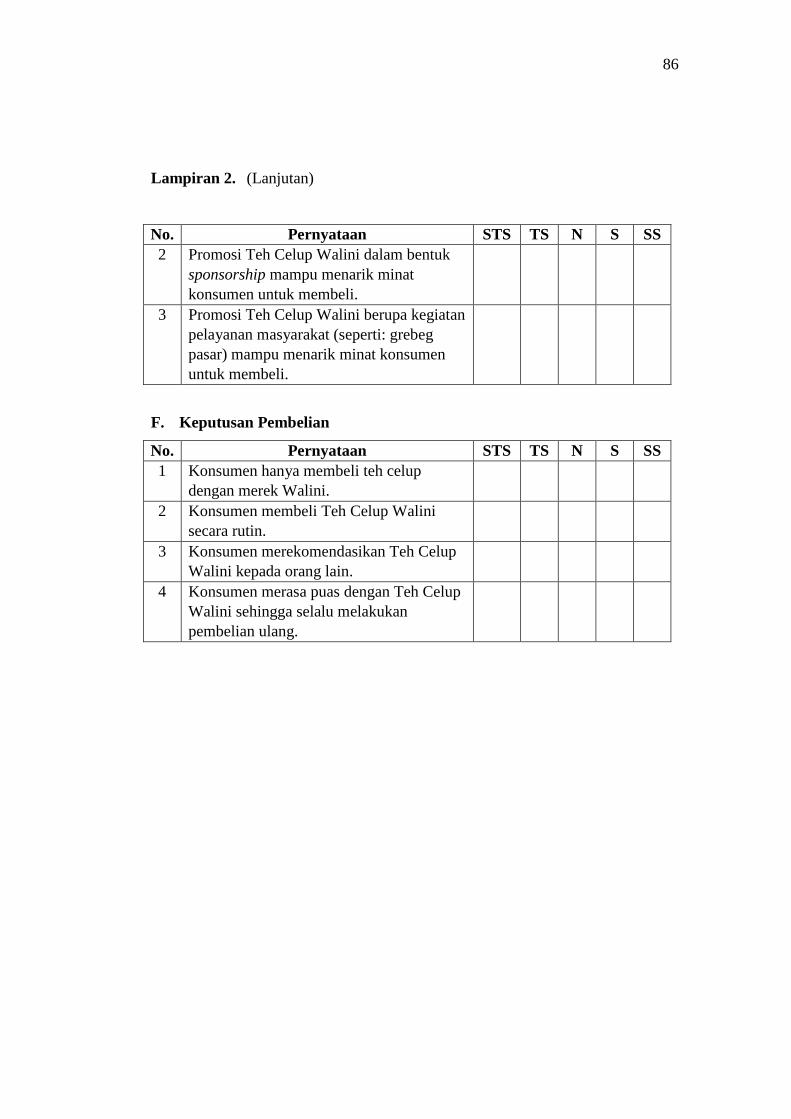
86
Lampiran 2. (Lanjutan)
No. Pernyataan STS TS N S SS
2 Promosi Teh Celup Walini dalam bentuk
sponsorship mampu menarik minat
konsumen untuk membeli.
3 Promosi Teh Celup Walini berupa kegiatan
pelayanan masyarakat (seperti: grebeg
pasar) mampu menarik minat konsumen
untuk membeli.
F. Keputusan Pembelian
No. Pernyataan STS TS N S SS
1 Konsumen hanya membeli teh celup
dengan merek Walini.
2 Konsumen membeli Teh Celup Walini
secara rutin.
3 Konsumen merekomendasikan Teh Celup
Walini kepada orang lain.
4 Konsumen merasa puas dengan Teh Celup
Walini sehingga selalu melakukan
pembelian ulang.
87
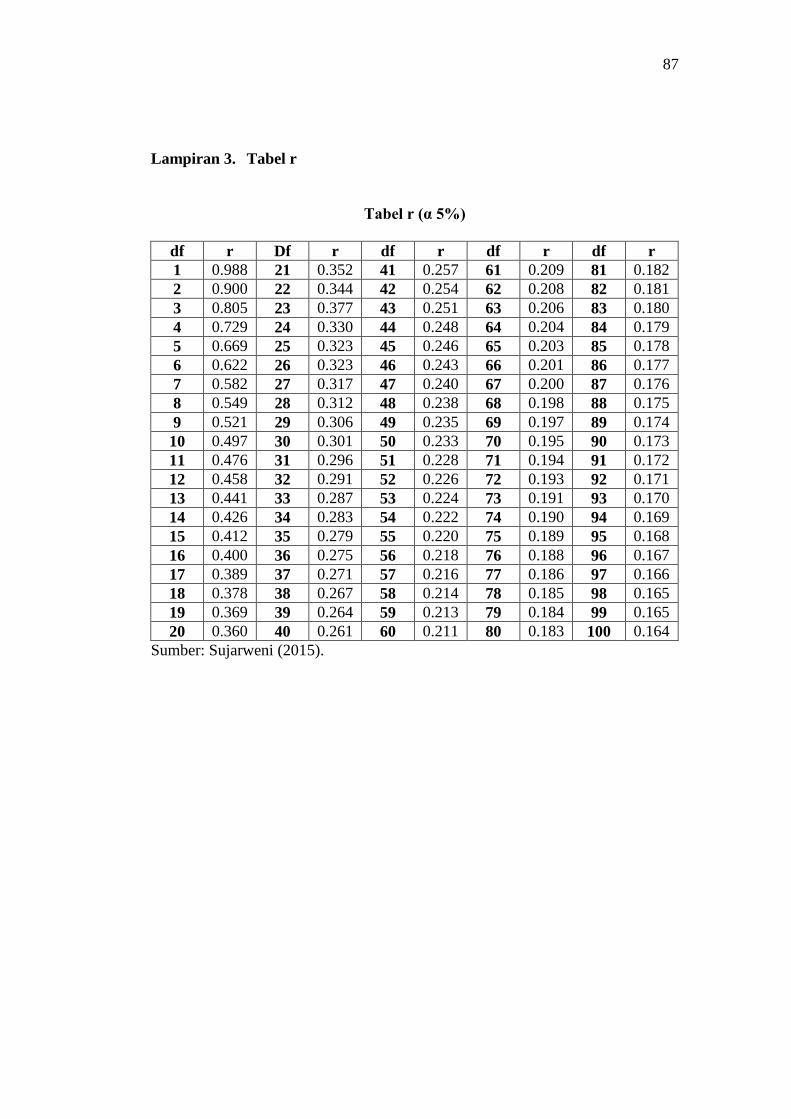
Lampiran 3. Tabel r
Tabel r (α 5%)
df r Df r df r df r df r
1 0.988 21 0.352 41 0.257 61 0.209 81 0.182
2 0.900 22 0.344 42 0.254 62 0.208 82 0.181
3 0.805 23 0.377 43 0.251 63 0.206 83 0.180
4 0.729 24 0.330 44 0.248 64 0.204 84 0.179
5 0.669 25 0.323 45 0.246 65 0.203 85 0.178
6 0.622 26 0.323 46 0.243 66 0.201 86 0.177
7 0.582 27 0.317 47 0.240 67 0.200 87 0.176
8 0.549 28 0.312 48 0.238 68 0.198 88 0.175
9 0.521 29 0.306 49 0.235 69 0.197 89 0.174
10 0.497 30 0.301 50 0.233 70 0.195 90 0.173
11 0.476 31 0.296 51 0.228 71 0.194 91 0.172
12 0.458 32 0.291 52 0.226 72 0.193 92 0.171
13 0.441 33 0.287 53 0.224 73 0.191 93 0.170
14 0.426 34 0.283 54 0.222 74 0.190 94 0.169
15 0.412 35 0.279 55 0.220 75 0.189 95 0.168
16 0.400 36 0.275 56 0.218 76 0.188 96 0.167
17 0.389 37 0.271 57 0.216 77 0.186 97 0.166
18 0.378 38 0.267 58 0.214 78 0.185 98 0.165
19 0.369 39 0.264 59 0.213 79 0.184 99 0.165
20 0.360 40 0.261 60 0.211 80 0.183 100 0.164
Sumber: Sujarweni (2015).
88
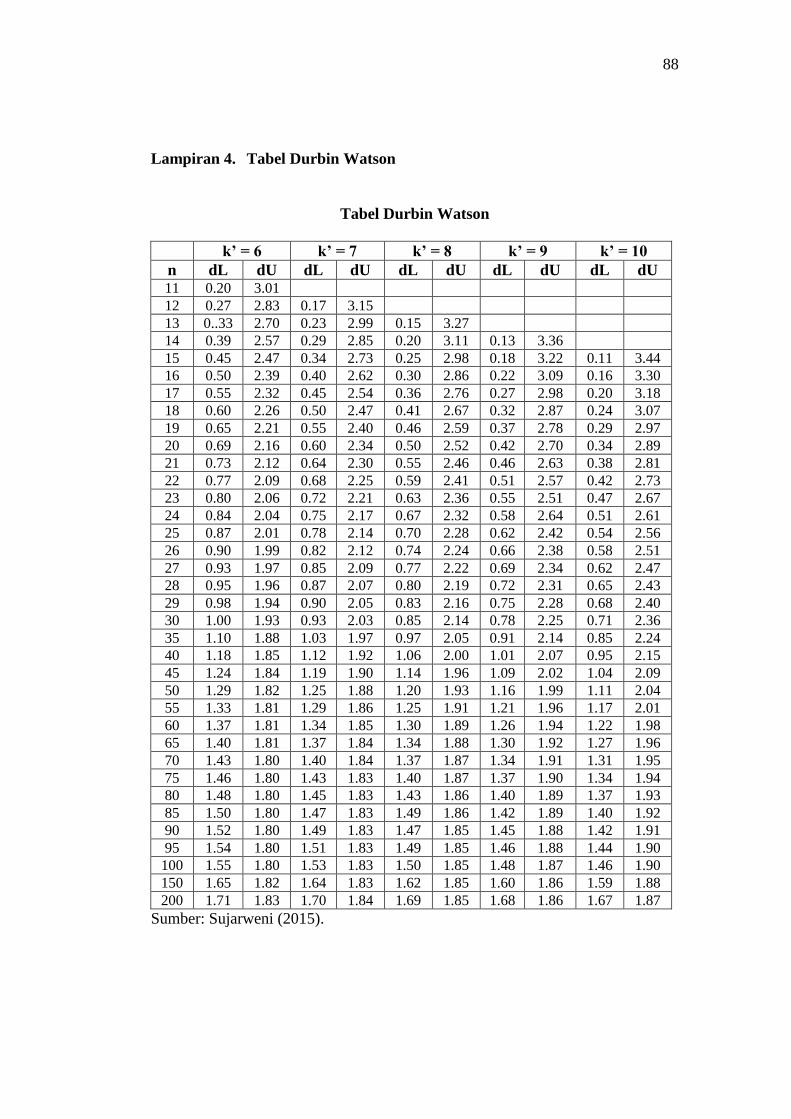
Lampiran 4. Tabel Durbin Watson
Tabel Durbin Watson
k’ = 6 k’ = 7 k’ = 8 k’ = 9 k’ = 10
n dL dU dL dU dL dU dL dU dL dU 11 0.20 3.01
12 0.27 2.83 0.17 3.15
13 0..33 2.70 0.23 2.99 0.15 3.27
14 0.39 2.57 0.29 2.85 0.20 3.11 0.13 3.36
15 0.45 2.47 0.34 2.73 0.25 2.98 0.18 3.22 0.11 3.44
16 0.50 2.39 0.40 2.62 0.30 2.86 0.22 3.09 0.16 3.30
17 0.55 2.32 0.45 2.54 0.36 2.76 0.27 2.98 0.20 3.18
18 0.60 2.26 0.50 2.47 0.41 2.67 0.32 2.87 0.24 3.07
19 0.65 2.21 0.55 2.40 0.46 2.59 0.37 2.78 0.29 2.97
20 0.69 2.16 0.60 2.34 0.50 2.52 0.42 2.70 0.34 2.89
21 0.73 2.12 0.64 2.30 0.55 2.46 0.46 2.63 0.38 2.81
22 0.77 2.09 0.68 2.25 0.59 2.41 0.51 2.57 0.42 2.73
23 0.80 2.06 0.72 2.21 0.63 2.36 0.55 2.51 0.47 2.67
24 0.84 2.04 0.75 2.17 0.67 2.32 0.58 2.64 0.51 2.61
25 0.87 2.01 0.78 2.14 0.70 2.28 0.62 2.42 0.54 2.56
26 0.90 1.99 0.82 2.12 0.74 2.24 0.66 2.38 0.58 2.51
27 0.93 1.97 0.85 2.09 0.77 2.22 0.69 2.34 0.62 2.47
28 0.95 1.96 0.87 2.07 0.80 2.19 0.72 2.31 0.65 2.43
29 0.98 1.94 0.90 2.05 0.83 2.16 0.75 2.28 0.68 2.40
30 1.00 1.93 0.93 2.03 0.85 2.14 0.78 2.25 0.71 2.36
35 1.10 1.88 1.03 1.97 0.97 2.05 0.91 2.14 0.85 2.24
40 1.18 1.85 1.12 1.92 1.06 2.00 1.01 2.07 0.95 2.15
45 1.24 1.84 1.19 1.90 1.14 1.96 1.09 2.02 1.04 2.09
50 1.29 1.82 1.25 1.88 1.20 1.93 1.16 1.99 1.11 2.04
55 1.33 1.81 1.29 1.86 1.25 1.91 1.21 1.96 1.17 2.01
60 1.37 1.81 1.34 1.85 1.30 1.89 1.26 1.94 1.22 1.98
65 1.40 1.81 1.37 1.84 1.34 1.88 1.30 1.92 1.27 1.96
70 1.43 1.80 1.40 1.84 1.37 1.87 1.34 1.91 1.31 1.95
75 1.46 1.80 1.43 1.83 1.40 1.87 1.37 1.90 1.34 1.94
80 1.48 1.80 1.45 1.83 1.43 1.86 1.40 1.89 1.37 1.93
85 1.50 1.80 1.47 1.83 1.49 1.86 1.42 1.89 1.40 1.92
90 1.52 1.80 1.49 1.83 1.47 1.85 1.45 1.88 1.42 1.91
95 1.54 1.80 1.51 1.83 1.49 1.85 1.46 1.88 1.44 1.90
100 1.55 1.80 1.53 1.83 1.50 1.85 1.48 1.87 1.46 1.90
150 1.65 1.82 1.64 1.83 1.62 1.85 1.60 1.86 1.59 1.88
200 1.71 1.83 1.70 1.84 1.69 1.85 1.68 1.86 1.67 1.87
Sumber: Sujarweni (2015).
89
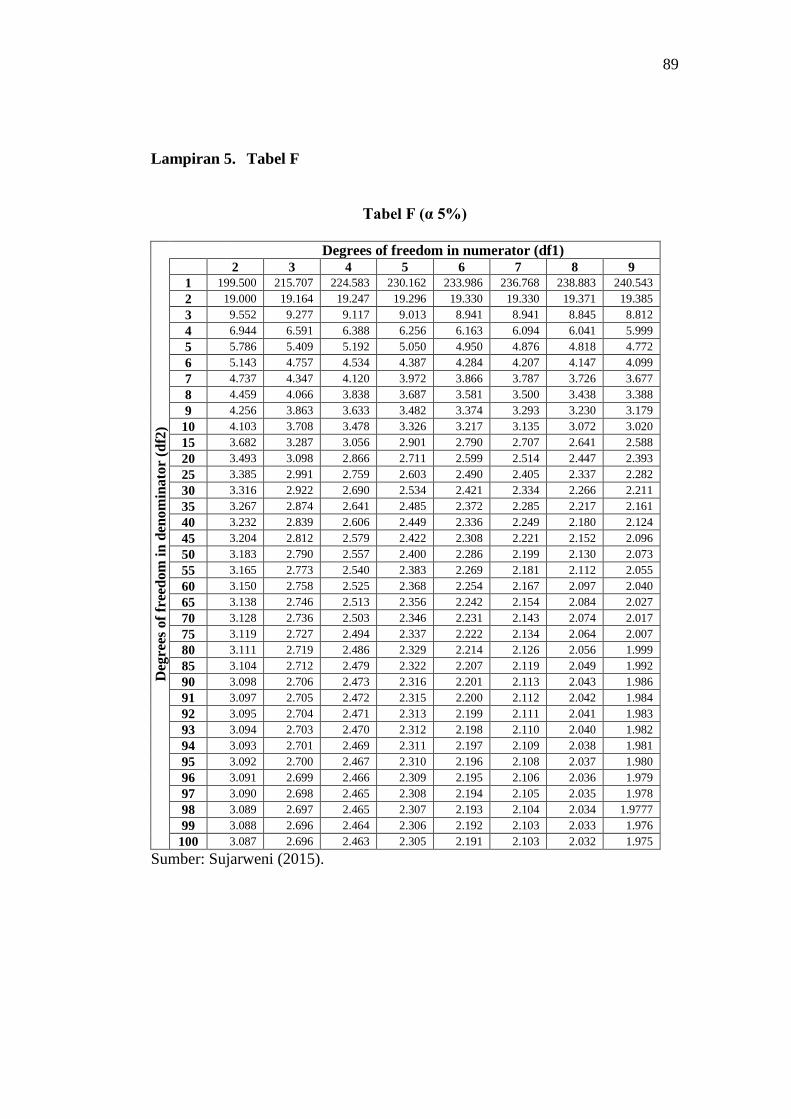
Lampiran 5. Tabel F
Tabel F (α 5%)
Degrees of freedom in numerator (df1)
Deg
rees
of
free
dom
in
den
om
inato
r (d
f2)
2 3 4 5 6 7 8 9
1 199.500 215.707 224.583 230.162 233.986 236.768 238.883 240.543
2 19.000 19.164 19.247 19.296 19.330 19.330 19.371 19.385
3 9.552 9.277 9.117 9.013 8.941 8.941 8.845 8.812
4 6.944 6.591 6.388 6.256 6.163 6.094 6.041 5.999
5 5.786 5.409 5.192 5.050 4.950 4.876 4.818 4.772
6 5.143 4.757 4.534 4.387 4.284 4.207 4.147 4.099
7 4.737 4.347 4.120 3.972 3.866 3.787 3.726 3.677
8 4.459 4.066 3.838 3.687 3.581 3.500 3.438 3.388
9 4.256 3.863 3.633 3.482 3.374 3.293 3.230 3.179
10 4.103 3.708 3.478 3.326 3.217 3.135 3.072 3.020
15 3.682 3.287 3.056 2.901 2.790 2.707 2.641 2.588
20 3.493 3.098 2.866 2.711 2.599 2.514 2.447 2.393
25 3.385 2.991 2.759 2.603 2.490 2.405 2.337 2.282
30 3.316 2.922 2.690 2.534 2.421 2.334 2.266 2.211
35 3.267 2.874 2.641 2.485 2.372 2.285 2.217 2.161
40 3.232 2.839 2.606 2.449 2.336 2.249 2.180 2.124
45 3.204 2.812 2.579 2.422 2.308 2.221 2.152 2.096
50 3.183 2.790 2.557 2.400 2.286 2.199 2.130 2.073
55 3.165 2.773 2.540 2.383 2.269 2.181 2.112 2.055
60 3.150 2.758 2.525 2.368 2.254 2.167 2.097 2.040
65 3.138 2.746 2.513 2.356 2.242 2.154 2.084 2.027
70 3.128 2.736 2.503 2.346 2.231 2.143 2.074 2.017
75 3.119 2.727 2.494 2.337 2.222 2.134 2.064 2.007
80 3.111 2.719 2.486 2.329 2.214 2.126 2.056 1.999
85 3.104 2.712 2.479 2.322 2.207 2.119 2.049 1.992
90 3.098 2.706 2.473 2.316 2.201 2.113 2.043 1.986
91 3.097 2.705 2.472 2.315 2.200 2.112 2.042 1.984
92 3.095 2.704 2.471 2.313 2.199 2.111 2.041 1.983
93 3.094 2.703 2.470 2.312 2.198 2.110 2.040 1.982
94 3.093 2.701 2.469 2.311 2.197 2.109 2.038 1.981
95 3.092 2.700 2.467 2.310 2.196 2.108 2.037 1.980
96 3.091 2.699 2.466 2.309 2.195 2.106 2.036 1.979
97 3.090 2.698 2.465 2.308 2.194 2.105 2.035 1.978
98 3.089 2.697 2.465 2.307 2.193 2.104 2.034 1.9777
99 3.088 2.696 2.464 2.306 2.192 2.103 2.033 1.976
100 3.087 2.696 2.463 2.305 2.191 2.103 2.032 1.975
Sumber: Sujarweni (2015).
90
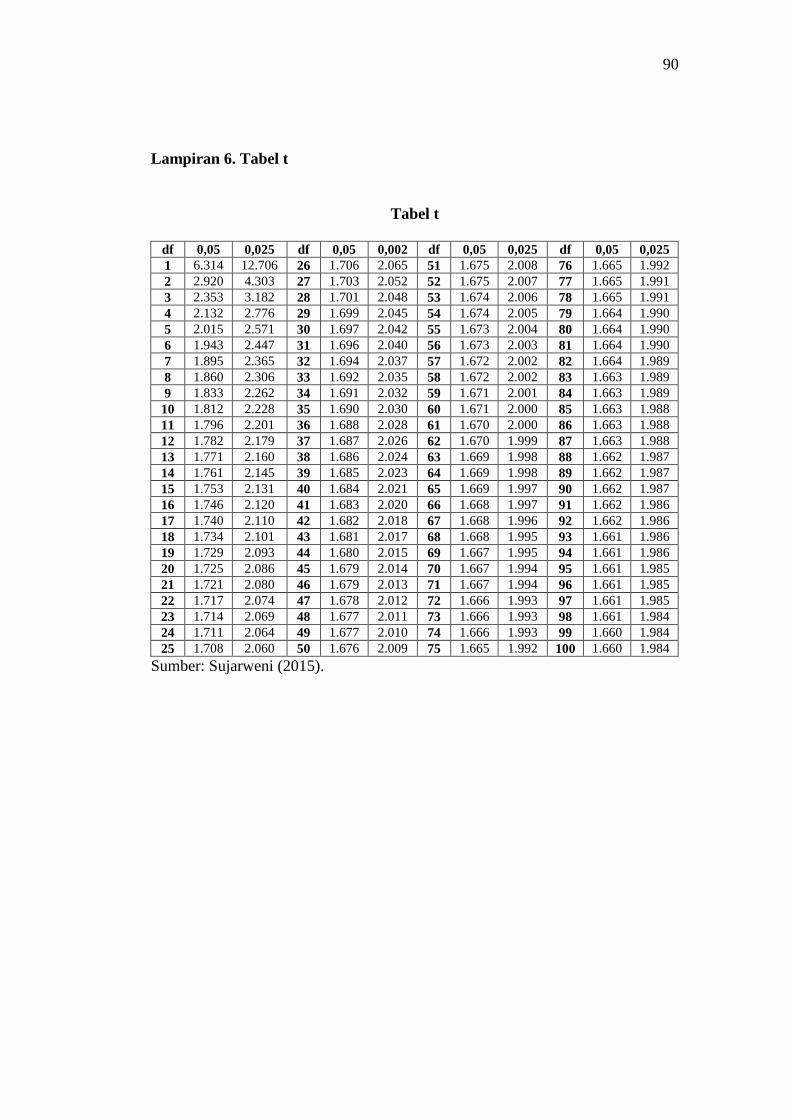
Lampiran 6. Tabel t
Tabel t
df 0,05 0,025 df 0,05 0,002 df 0,05 0,025 df 0,05 0,025
1 6.314 12.706 26 1.706 2.065 51 1.675 2.008 76 1.665 1.992
2 2.920 4.303 27 1.703 2.052 52 1.675 2.007 77 1.665 1.991
3 2.353 3.182 28 1.701 2.048 53 1.674 2.006 78 1.665 1.991
4 2.132 2.776 29 1.699 2.045 54 1.674 2.005 79 1.664 1.990
5 2.015 2.571 30 1.697 2.042 55 1.673 2.004 80 1.664 1.990
6 1.943 2.447 31 1.696 2.040 56 1.673 2.003 81 1.664 1.990
7 1.895 2.365 32 1.694 2.037 57 1.672 2.002 82 1.664 1.989
8 1.860 2.306 33 1.692 2.035 58 1.672 2.002 83 1.663 1.989
9 1.833 2.262 34 1.691 2.032 59 1.671 2.001 84 1.663 1.989
10 1.812 2.228 35 1.690 2.030 60 1.671 2.000 85 1.663 1.988
11 1.796 2.201 36 1.688 2.028 61 1.670 2.000 86 1.663 1.988
12 1.782 2.179 37 1.687 2.026 62 1.670 1.999 87 1.663 1.988
13 1.771 2.160 38 1.686 2.024 63 1.669 1.998 88 1.662 1.987
14 1.761 2.145 39 1.685 2.023 64 1.669 1.998 89 1.662 1.987
15 1.753 2.131 40 1.684 2.021 65 1.669 1.997 90 1.662 1.987
16 1.746 2.120 41 1.683 2.020 66 1.668 1.997 91 1.662 1.986
17 1.740 2.110 42 1.682 2.018 67 1.668 1.996 92 1.662 1.986
18 1.734 2.101 43 1.681 2.017 68 1.668 1.995 93 1.661 1.986
19 1.729 2.093 44 1.680 2.015 69 1.667 1.995 94 1.661 1.986
20 1.725 2.086 45 1.679 2.014 70 1.667 1.994 95 1.661 1.985
21 1.721 2.080 46 1.679 2.013 71 1.667 1.994 96 1.661 1.985
22 1.717 2.074 47 1.678 2.012 72 1.666 1.993 97 1.661 1.985
23 1.714 2.069 48 1.677 2.011 73 1.666 1.993 98 1.661 1.984
24 1.711 2.064 49 1.677 2.010 74 1.666 1.993 99 1.660 1.984
25 1.708 2.060 50 1.676 2.009 75 1.665 1.992 100 1.660 1.984
Sumber: Sujarweni (2015).
91
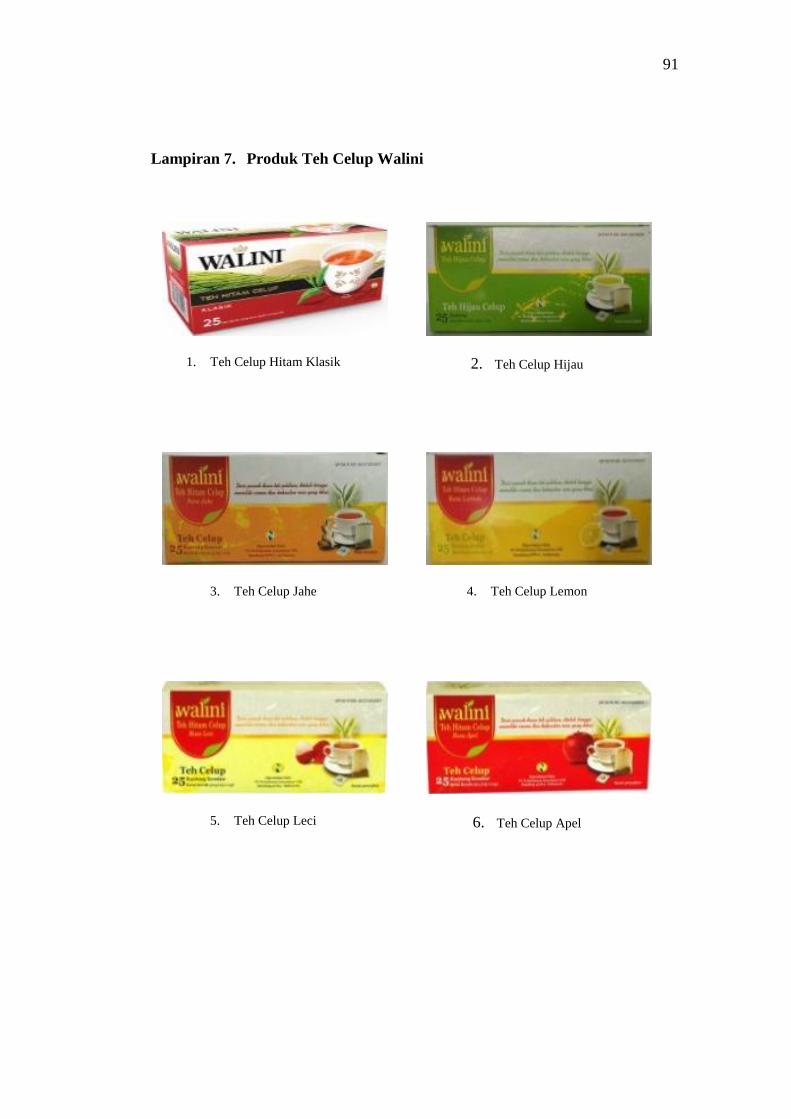
Lampiran 7. Produk Teh Celup Walini
1. Teh Celup Hitam Klasik
2. Teh Celup Hijau
3. Teh Celup Jahe
4. Teh Celup Lemon
5. Teh Celup Leci
6. Teh Celup Apel

92
Lampiran 7. (Lanjutan)
7. Teh Celup Blackcurrant
8. Teh Celup Mint
9. Teh Celup Wangi Melati
93
Lampiran 8. Data Karakteristik Demografi Responden
Responden Jenis Kelamin Usia Pendidikan Pekerjaan
1 1 21 1 0
2 1 22 3 0
3 1 21 1 0
4 0 21 3 0
5 1 20 1 0
6 1 21 3 0
7 1 22 1 0
8 1 49 4 1
9 1 21 1 0
10 1 22 3 0
11 1 21 1 0
12 1 31 3 1
13 1 35 2 1
14 0 56 4 1
15 0 38 5 1
16 1 23 1 0
17 0 50 3 1
18 1 48 3 1
19 0 55 4 1
20 0 52 4 1
21 1 35 2 1
22 0 28 3 0
23 0 40 3 1
24 0 46 4 1
25 0 23 4 0
26 0 22 3 1
27 1 21 1 0
28 0 21 3 0
29 0 23 3 1
30 0 22 3 0
31 1 21 1 0
32 0 31 4 1
33 1 22 3 1
34 1 56 3 1
35 0 54 5 1
36 0 58 4 1
94
Lampiran 8. (Lanjutan)
Responden Jenis Kelamin Usia Pendidikan Pekerjaan
37 0 50 3 1
38 0 50 1 1
39 0 37 2 1
40 0 62 5 0
41 0 44 5 1
42 0 58 5 1
43 1 36 3 1
44 1 27 1 0
45 1 36 1 1
46 1 40 1 1
47 1 23 3 1
48 1 60 1 1
49 1 32 3 1
50 1 32 3 1
51 1 18 1 0
52 1 20 1 0
53 1 19 1 0
54 1 18 1 0
55 1 27 3 0
56 1 26 2 1
57 0 32 3 1
58 1 26 4 1
59 1 23 3 1
60 1 40 4 1
61 0 27 2 1
62 1 34 3 0
63 1 22 1 0
64 1 21 3 0
65 1 21 3 1
66 1 21 1 0
67 1 21 3 0
68 1 47 3 0
69 1 24 3 0
70 0 26 3 1
71 0 54 4 1
72 1 47 3 0

95
Lampiran 8. (Lanjutan)
Responden Jenis Kelamin Usia Pendidikan Pekerjaan
73 0 50 3 1
74 1 49 4 1
75 0 52 4 1
76 1 58 4 1
77 0 60 3 1
78 1 56 4 1
79 0 58 4 1
80 1 55 4 1
81 1 57 3 0
82 1 45 4 1
83 1 36 1 1
84 1 48 1 1
85 1 49 3 1
86 1 52 3 0
87 1 42 3 1
88 1 43 3 1
89 1 46 4 1
90 0 53 4 1
91 1 55 4 1
92 1 75 4 0
93 1 71 2 1
94 1 53 3 1
95 1 58 5 1
96 1 60 3 1
97 0 34 3 1
98 1 30 4 1
99 1 28 3 0
100 1 28 3 1
96
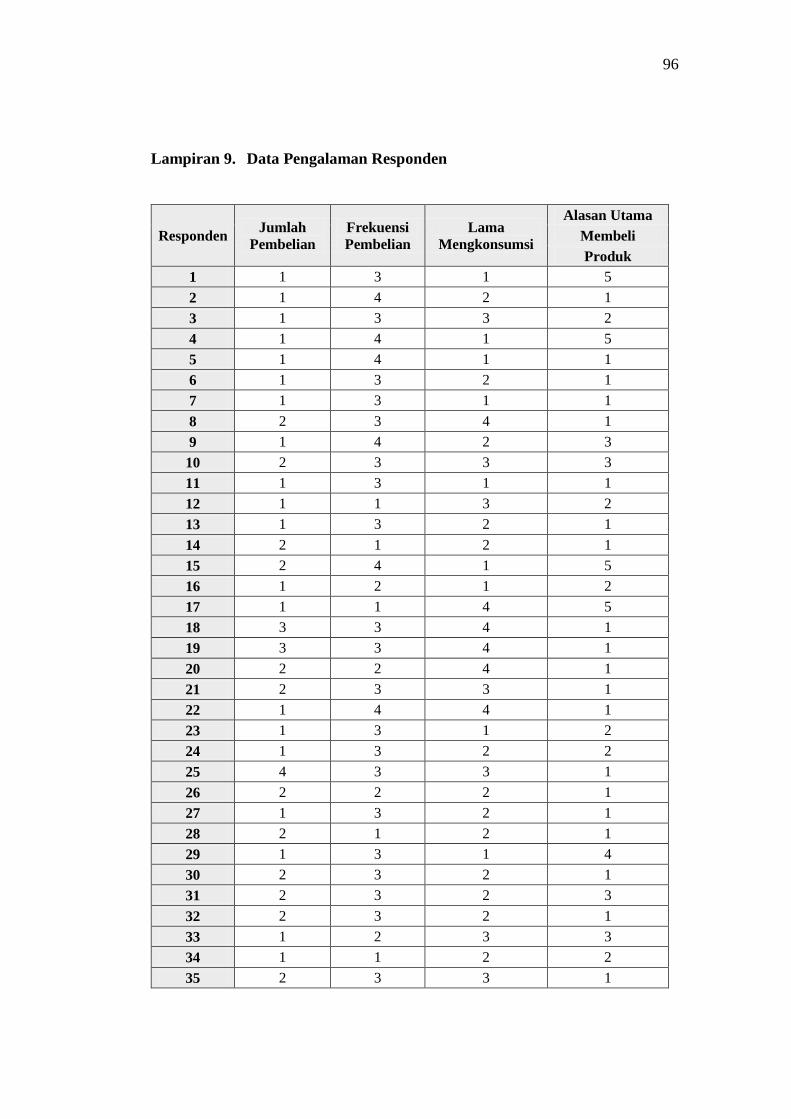
Lampiran 9. Data Pengalaman Responden
Responden Jumlah
Pembelian
Frekuensi
Pembelian
Lama
Mengkonsumsi
Alasan Utama
Membeli
Produk
1 1 3 1 5
2 1 4 2 1
3 1 3 3 2
4 1 4 1 5
5 1 4 1 1
6 1 3 2 1
7 1 3 1 1
8 2 3 4 1
9 1 4 2 3
10 2 3 3 3
11 1 3 1 1
12 1 1 3 2
13 1 3 2 1
14 2 1 2 1
15 2 4 1 5
16 1 2 1 2
17 1 1 4 5
18 3 3 4 1
19 3 3 4 1
20 2 2 4 1
21 2 3 3 1
22 1 4 4 1
23 1 3 1 2
24 1 3 2 2
25 4 3 3 1
26 2 2 2 1
27 1 3 2 1
28 2 1 2 1
29 1 3 1 4
30 2 3 2 1
31 2 3 2 3
32 2 3 2 1
33 1 2 3 3
34 1 1 2 2
35 2 3 3 1
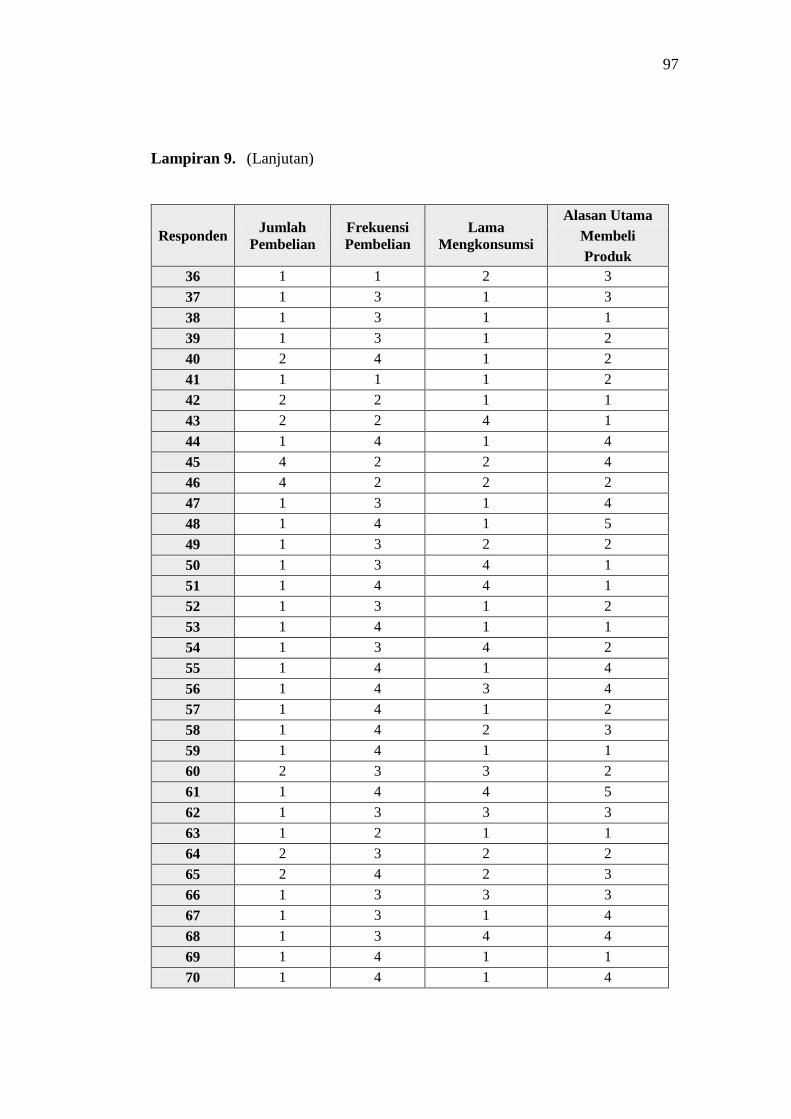
97
Lampiran 9. (Lanjutan)
Responden Jumlah
Pembelian
Frekuensi
Pembelian
Lama
Mengkonsumsi
Alasan Utama
Membeli
Produk
36 1 1 2 3
37 1 3 1 3
38 1 3 1 1
39 1 3 1 2
40 2 4 1 2
41 1 1 1 2
42 2 2 1 1
43 2 2 4 1
44 1 4 1 4
45 4 2 2 4
46 4 2 2 2
47 1 3 1 4
48 1 4 1 5
49 1 3 2 2
50 1 3 4 1
51 1 4 4 1
52 1 3 1 2
53 1 4 1 1
54 1 3 4 2
55 1 4 1 4
56 1 4 3 4
57 1 4 1 2
58 1 4 2 3
59 1 4 1 1
60 2 3 3 2
61 1 4 4 5
62 1 3 3 3
63 1 2 1 1
64 2 3 2 2
65 2 4 2 3
66 1 3 3 3
67 1 3 1 4
68 1 3 4 4
69 1 4 1 1
70 1 4 1 4

98
Lampiran 9. (Lanjutan)
Responden Jumlah
Pembelian
Frekuensi
Pembelian
Lama
Mengkonsumsi
Alasan Utama
Membeli
Produk
71 2 3 4 1
72 2 3 4 4
73 1 3 3 5
74 4 4 4 5
75 4 4 4 5
76 2 3 4 4
77 1 3 2 1
78 1 3 4 4
79 4 4 2 1
80 1 3 4 1
81 1 3 1 1
82 1 4 1 4
83 1 4 1 4
84 1 4 1 4
85 2 3 4 1
86 2 3 4 4
87 2 3 2 1
88 1 3 1 3
89 1 4 2 1
90 2 3 4 1
91 1 4 1 4
92 1 3 4 1
93 1 3 4 4
94 1 4 4 1
95 2 3 4 4
96 1 3 1 1
97 1 3 1 1
98 1 4 3 4
99 1 3 1 4
100 1 3 1 4
99
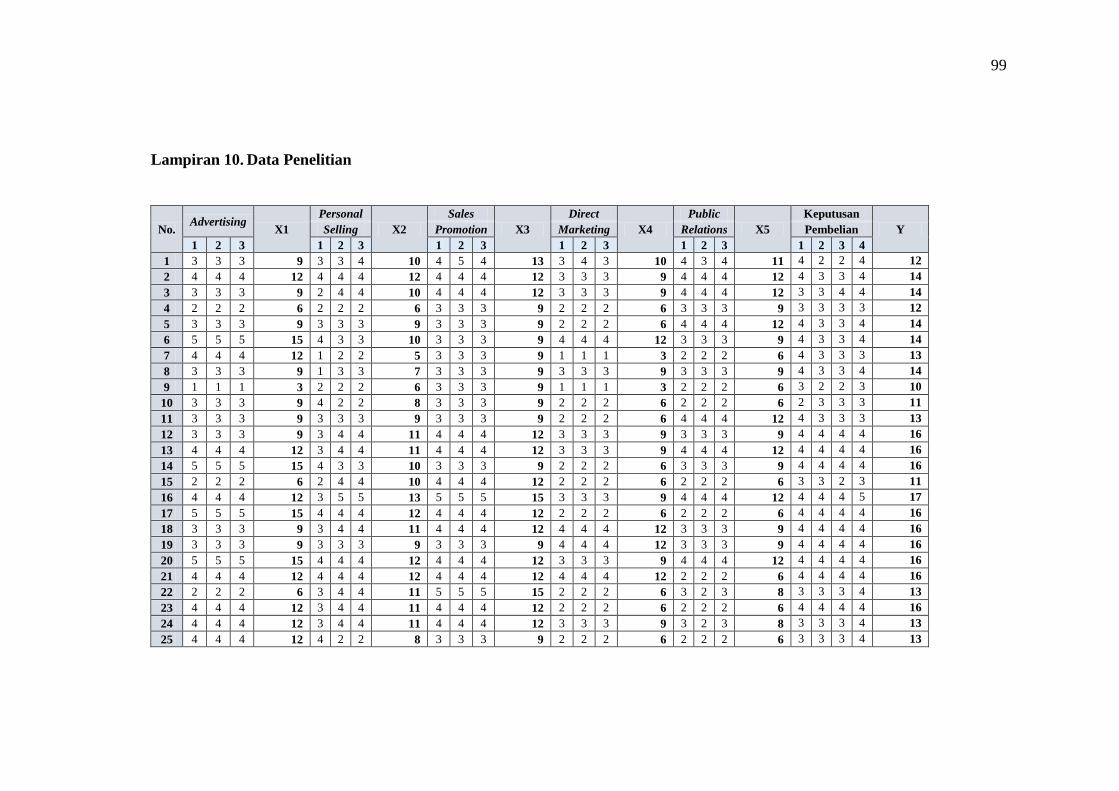
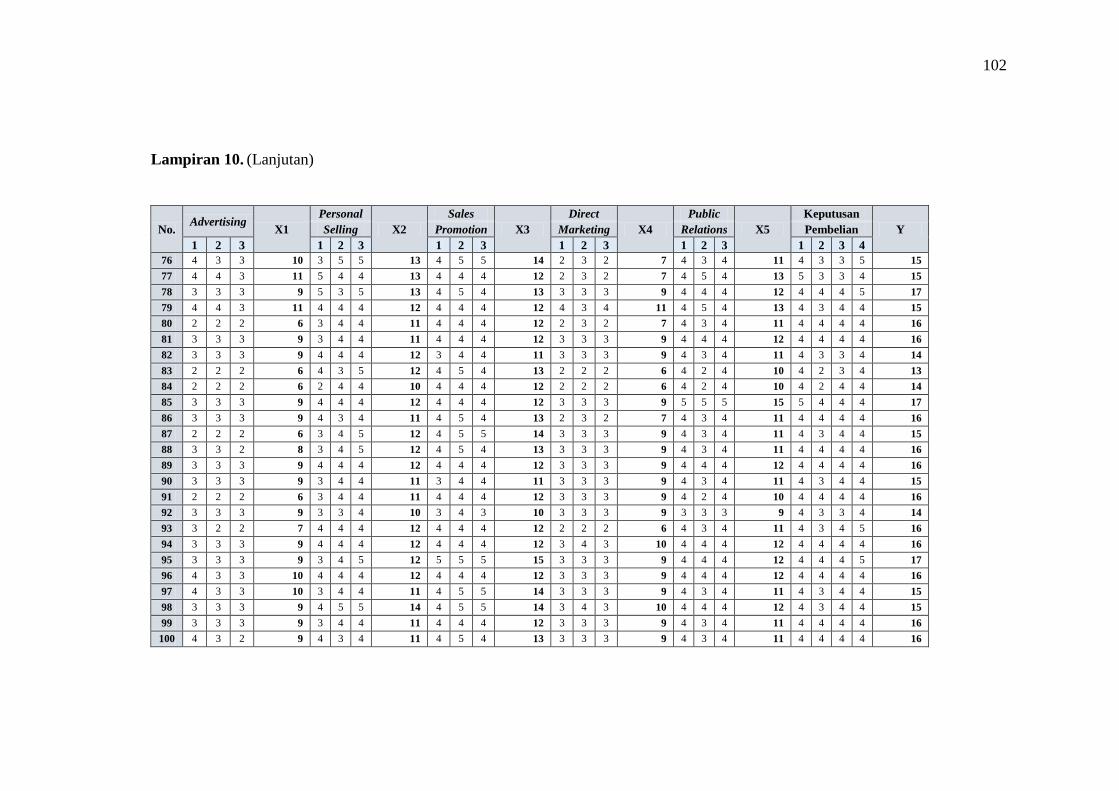
Lampiran 10. Data Penelitian
No. Advertising
X1
Personal
X2
Sales
X3
Direct
X4
Public
X5
Keputusan
Y Selling Promotion Marketing Relations Pembelian
1 2 3 1 2 3 1 2 3 1 2 3 1 2 3 1 2 3 4
1 3 3 3 9 3 3 4 10 4 5 4 13 3 4 3 10 4 3 4 11 4 2 2 4 12
2 4 4 4 12 4 4 4 12 4 4 4 12 3 3 3 9 4 4 4 12 4 3 3 4 14
3 3 3 3 9 2 4 4 10 4 4 4 12 3 3 3 9 4 4 4 12 3 3 4 4 14
4 2 2 2 6 2 2 2 6 3 3 3 9 2 2 2 6 3 3 3 9 3 3 3 3 12
5 3 3 3 9 3 3 3 9 3 3 3 9 2 2 2 6 4 4 4 12 4 3 3 4 14
6 5 5 5 15 4 3 3 10 3 3 3 9 4 4 4 12 3 3 3 9 4 3 3 4 14
7 4 4 4 12 1 2 2 5 3 3 3 9 1 1 1 3 2 2 2 6 4 3 3 3 13
8 3 3 3 9 1 3 3 7 3 3 3 9 3 3 3 9 3 3 3 9 4 3 3 4 14
9 1 1 1 3 2 2 2 6 3 3 3 9 1 1 1 3 2 2 2 6 3 2 2 3 10
10 3 3 3 9 4 2 2 8 3 3 3 9 2 2 2 6 2 2 2 6 2 3 3 3 11
11 3 3 3 9 3 3 3 9 3 3 3 9 2 2 2 6 4 4 4 12 4 3 3 3 13
12 3 3 3 9 3 4 4 11 4 4 4 12 3 3 3 9 3 3 3 9 4 4 4 4 16
13 4 4 4 12 3 4 4 11 4 4 4 12 3 3 3 9 4 4 4 12 4 4 4 4 16
14 5 5 5 15 4 3 3 10 3 3 3 9 2 2 2 6 3 3 3 9 4 4 4 4 16
15 2 2 2 6 2 4 4 10 4 4 4 12 2 2 2 6 2 2 2 6 3 3 2 3 11
16 4 4 4 12 3 5 5 13 5 5 5 15 3 3 3 9 4 4 4 12 4 4 4 5 17
17 5 5 5 15 4 4 4 12 4 4 4 12 2 2 2 6 2 2 2 6 4 4 4 4 16
18 3 3 3 9 3 4 4 11 4 4 4 12 4 4 4 12 3 3 3 9 4 4 4 4 16
19 3 3 3 9 3 3 3 9 3 3 3 9 4 4 4 12 3 3 3 9 4 4 4 4 16
20 5 5 5 15 4 4 4 12 4 4 4 12 3 3 3 9 4 4 4 12 4 4 4 4 16
21 4 4 4 12 4 4 4 12 4 4 4 12 4 4 4 12 2 2 2 6 4 4 4 4 16
22 2 2 2 6 3 4 4 11 5 5 5 15 2 2 2 6 3 2 3 8 3 3 3 4 13
23 4 4 4 12 3 4 4 11 4 4 4 12 2 2 2 6 2 2 2 6 4 4 4 4 16
24 4 4 4 12 3 4 4 11 4 4 4 12 3 3 3 9 3 2 3 8 3 3 3 4 13
25 4 4 4 12 4 2 2 8 3 3 3 9 2 2 2 6 2 2 2 6 3 3 3 4 13

100
Lampiran 10. (Lanjutan)
No. Advertising
X1
Personal
X2
Sales
X3
Direct
X4
Public
X5
Keputusan
Y Selling Promotion Marketing Relations Pembelian
1 2 3 1 2 3 1 2 3 1 2 3 1 2 3 1 2 3 4
26 4 4 4 12 2 4 4 10 4 4 4 12 5 5 5 15 3 4 3 10 5 4 4 5 18
27 2 2 2 6 1 2 2 5 3 3 3 9 2 2 2 6 2 2 2 6 3 3 2 4 12
28 4 4 4 12 4 4 4 12 4 4 4 12 4 4 4 12 4 4 4 12 4 3 3 4 14
29 3 3 3 9 4 2 2 8 3 3 3 9 2 2 2 6 2 2 2 6 3 3 3 5 14
30 4 4 4 12 3 4 4 11 4 4 4 12 2 2 2 6 4 4 4 12 4 3 3 4 14
31 3 3 3 9 1 2 2 5 3 3 3 9 2 2 2 6 3 3 3 9 5 4 4 4 17
32 3 3 3 9 1 2 2 5 3 3 3 9 3 3 3 9 3 2 3 8 3 4 4 3 14
33 3 3 3 9 2 2 2 6 3 3 3 9 3 3 3 9 4 4 4 12 4 4 4 4 16
34 4 4 4 12 4 4 4 12 4 4 4 12 4 4 4 12 3 3 3 9 4 4 3 4 15
35 4 4 4 12 4 4 4 12 5 5 5 15 4 4 4 12 3 3 3 9 5 5 4 4 18
36 4 4 4 12 4 3 3 10 3 3 3 9 3 3 3 9 4 4 4 12 4 3 4 4 15
37 3 3 3 9 4 3 3 10 3 3 3 9 3 3 3 9 3 2 3 8 4 4 3 4 15
38 4 4 4 12 4 4 4 12 5 5 5 15 3 3 3 9 4 3 4 11 5 5 4 5 19
39 4 4 4 12 4 4 4 12 4 4 4 12 4 4 4 12 3 4 4 11 4 5 4 4 17
40 4 4 4 12 4 4 4 12 4 4 4 12 4 4 4 12 4 4 4 12 4 4 4 4 16
41 4 4 4 12 2 4 4 10 4 4 4 12 4 4 4 12 4 4 4 12 4 4 4 4 16
42 4 4 4 12 4 5 5 14 5 5 5 15 3 3 3 9 4 4 4 12 4 4 5 5 18
43 4 4 4 12 4 4 4 12 4 4 4 12 4 4 4 12 4 4 4 12 4 5 5 5 19
44 4 4 4 12 3 4 4 11 4 4 4 12 2 2 2 6 4 4 4 12 4 4 4 4 16
45 4 4 4 12 4 4 4 12 4 4 4 12 2 2 2 6 2 2 2 6 4 4 4 4 16
46 4 4 4 12 4 3 3 10 3 3 3 9 3 3 3 9 3 3 3 9 4 4 4 4 16
47 4 4 4 12 2 4 4 10 4 4 4 12 3 3 3 9 4 4 4 12 3 4 4 4 15
48 4 4 4 12 2 4 4 10 4 4 4 12 3 3 3 9 4 4 4 12 3 4 4 4 15
49 3 3 3 9 2 3 3 8 3 3 3 9 4 4 4 12 3 3 3 9 3 4 3 4 14
50 4 4 4 12 4 5 5 14 5 5 5 15 4 4 4 12 4 4 4 12 5 4 5 5 19
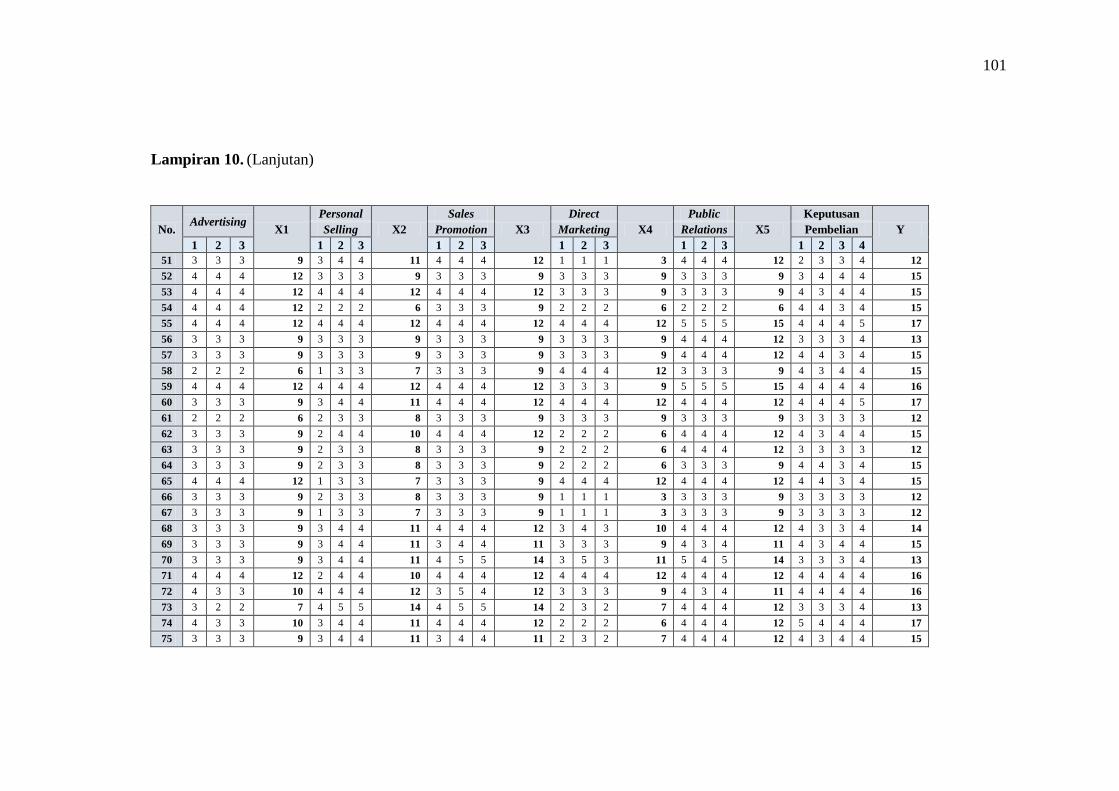
101
Lampiran 10. (Lanjutan)
No. Advertising
X1
Personal
X2
Sales
X3
Direct
X4
Public
X5
Keputusan
Y Selling Promotion Marketing Relations Pembelian
1 2 3 1 2 3 1 2 3 1 2 3 1 2 3 1 2 3 4
51 3 3 3 9 3 4 4 11 4 4 4 12 1 1 1 3 4 4 4 12 2 3 3 4 12
52 4 4 4 12 3 3 3 9 3 3 3 9 3 3 3 9 3 3 3 9 3 4 4 4 15
53 4 4 4 12 4 4 4 12 4 4 4 12 3 3 3 9 3 3 3 9 4 3 4 4 15
54 4 4 4 12 2 2 2 6 3 3 3 9 2 2 2 6 2 2 2 6 4 4 3 4 15
55 4 4 4 12 4 4 4 12 4 4 4 12 4 4 4 12 5 5 5 15 4 4 4 5 17
56 3 3 3 9 3 3 3 9 3 3 3 9 3 3 3 9 4 4 4 12 3 3 3 4 13
57 3 3 3 9 3 3 3 9 3 3 3 9 3 3 3 9 4 4 4 12 4 4 3 4 15
58 2 2 2 6 1 3 3 7 3 3 3 9 4 4 4 12 3 3 3 9 4 3 4 4 15
59 4 4 4 12 4 4 4 12 4 4 4 12 3 3 3 9 5 5 5 15 4 4 4 4 16
60 3 3 3 9 3 4 4 11 4 4 4 12 4 4 4 12 4 4 4 12 4 4 4 5 17
61 2 2 2 6 2 3 3 8 3 3 3 9 3 3 3 9 3 3 3 9 3 3 3 3 12
62 3 3 3 9 2 4 4 10 4 4 4 12 2 2 2 6 4 4 4 12 4 3 4 4 15
63 3 3 3 9 2 3 3 8 3 3 3 9 2 2 2 6 4 4 4 12 3 3 3 3 12
64 3 3 3 9 2 3 3 8 3 3 3 9 2 2 2 6 3 3 3 9 4 4 3 4 15
65 4 4 4 12 1 3 3 7 3 3 3 9 4 4 4 12 4 4 4 12 4 4 3 4 15
66 3 3 3 9 2 3 3 8 3 3 3 9 1 1 1 3 3 3 3 9 3 3 3 3 12
67 3 3 3 9 1 3 3 7 3 3 3 9 1 1 1 3 3 3 3 9 3 3 3 3 12
68 3 3 3 9 3 4 4 11 4 4 4 12 3 4 3 10 4 4 4 12 4 3 3 4 14
69 3 3 3 9 3 4 4 11 3 4 4 11 3 3 3 9 4 3 4 11 4 3 4 4 15
70 3 3 3 9 3 4 4 11 4 5 5 14 3 5 3 11 5 4 5 14 3 3 3 4 13
71 4 4 4 12 2 4 4 10 4 4 4 12 4 4 4 12 4 4 4 12 4 4 4 4 16
72 4 3 3 10 4 4 4 12 3 5 4 12 3 3 3 9 4 3 4 11 4 4 4 4 16
73 3 2 2 7 4 5 5 14 4 5 5 14 2 3 2 7 4 4 4 12 3 3 3 4 13
74 4 3 3 10 3 4 4 11 4 4 4 12 2 2 2 6 4 4 4 12 5 4 4 4 17
75 3 3 3 9 3 4 4 11 3 4 4 11 2 3 2 7 4 4 4 12 4 3 4 4 15
102
Lampiran 10. (Lanjutan)
No. Advertising
X1
Personal
X2
Sales
X3
Direct
X4
Public
X5
Keputusan
Y Selling Promotion Marketing Relations Pembelian
1 2 3 1 2 3 1 2 3 1 2 3 1 2 3 1 2 3 4
76 4 3 3 10 3 5 5 13 4 5 5 14 2 3 2 7 4 3 4 11 4 3 3 5 15
77 4 4 3 11 5 4 4 13 4 4 4 12 2 3 2 7 4 5 4 13 5 3 3 4 15
78 3 3 3 9 5 3 5 13 4 5 4 13 3 3 3 9 4 4 4 12 4 4 4 5 17
79 4 4 3 11 4 4 4 12 4 4 4 12 4 3 4 11 4 5 4 13 4 3 4 4 15
80 2 2 2 6 3 4 4 11 4 4 4 12 2 3 2 7 4 3 4 11 4 4 4 4 16
81 3 3 3 9 3 4 4 11 4 4 4 12 3 3 3 9 4 4 4 12 4 4 4 4 16
82 3 3 3 9 4 4 4 12 3 4 4 11 3 3 3 9 4 3 4 11 4 3 3 4 14
83 2 2 2 6 4 3 5 12 4 5 4 13 2 2 2 6 4 2 4 10 4 2 3 4 13
84 2 2 2 6 2 4 4 10 4 4 4 12 2 2 2 6 4 2 4 10 4 2 4 4 14
85 3 3 3 9 4 4 4 12 4 4 4 12 3 3 3 9 5 5 5 15 5 4 4 4 17
86 3 3 3 9 4 3 4 11 4 5 4 13 2 3 2 7 4 3 4 11 4 4 4 4 16
87 2 2 2 6 3 4 5 12 4 5 5 14 3 3 3 9 4 3 4 11 4 3 4 4 15
88 3 3 2 8 3 4 5 12 4 5 4 13 3 3 3 9 4 3 4 11 4 4 4 4 16
89 3 3 3 9 4 4 4 12 4 4 4 12 3 3 3 9 4 4 4 12 4 4 4 4 16
90 3 3 3 9 3 4 4 11 3 4 4 11 3 3 3 9 4 3 4 11 4 3 4 4 15
91 2 2 2 6 3 4 4 11 4 4 4 12 3 3 3 9 4 2 4 10 4 4 4 4 16
92 3 3 3 9 3 3 4 10 3 4 3 10 3 3 3 9 3 3 3 9 4 3 3 4 14
93 3 2 2 7 4 4 4 12 4 4 4 12 2 2 2 6 4 3 4 11 4 3 4 5 16
94 3 3 3 9 4 4 4 12 4 4 4 12 3 4 3 10 4 4 4 12 4 4 4 4 16
95 3 3 3 9 3 4 5 12 5 5 5 15 3 3 3 9 4 4 4 12 4 4 4 5 17
96 4 3 3 10 4 4 4 12 4 4 4 12 3 3 3 9 4 4 4 12 4 4 4 4 16
97 4 3 3 10 3 4 4 11 4 5 5 14 3 3 3 9 4 3 4 11 4 3 4 4 15
98 3 3 3 9 4 5 5 14 4 5 5 14 3 4 3 10 4 4 4 12 4 3 4 4 15
99 3 3 3 9 3 4 4 11 4 4 4 12 3 3 3 9 4 3 4 11 4 4 4 4 16
100 4 3 2 9 4 3 4 11 4 5 4 13 3 3 3 9 4 3 4 11 4 4 4 4 16
103
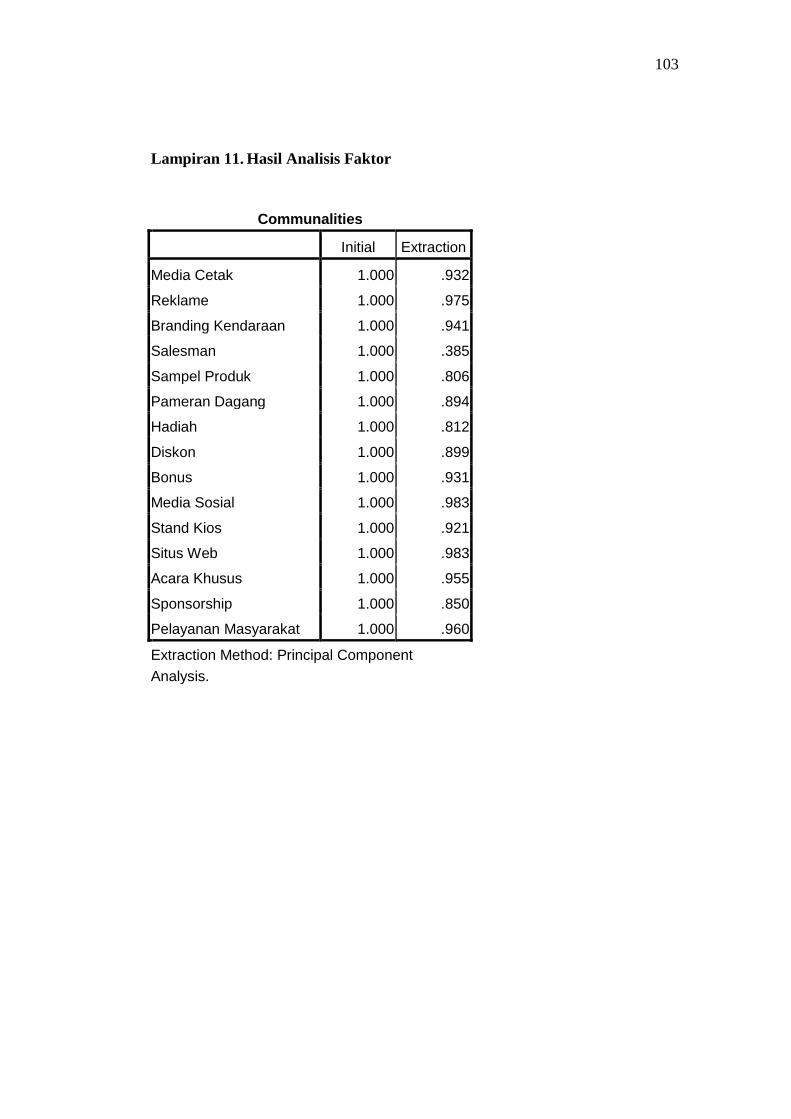
Lampiran 11. Hasil Analisis Faktor
Communalities
Initial Extraction
Media Cetak 1.000 .932
Reklame 1.000 .975
Branding Kendaraan 1.000 .941
Salesman 1.000 .385
Sampel Produk 1.000 .806
Pameran Dagang 1.000 .894
Hadiah 1.000 .812
Diskon 1.000 .899
Bonus 1.000 .931
Media Sosial 1.000 .983
Stand Kios 1.000 .921
Situs Web 1.000 .983
Acara Khusus 1.000 .955
Sponsorship 1.000 .850
Pelayanan Masyarakat 1.000 .960
Extraction Method: Principal Component
Analysis.
104
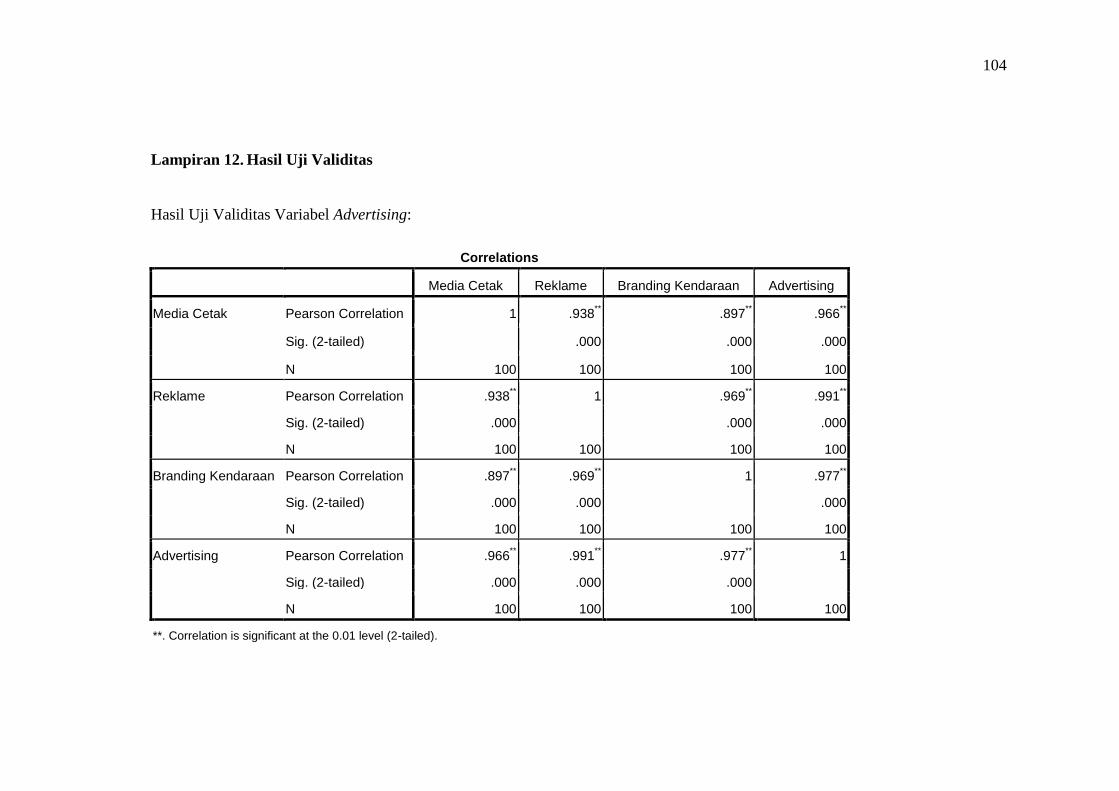
Lampiran 12. Hasil Uji Validitas
Hasil Uji Validitas Variabel Advertising:
Correlations
Media Cetak Reklame Branding Kendaraan Advertising
Media Cetak Pearson Correlation 1 .938** .897
** .966
**
Sig. (2-tailed)
.000 .000 .000
N 100 100 100 100
Reklame Pearson Correlation .938** 1 .969
** .991
**
Sig. (2-tailed) .000
.000 .000
N 100 100 100 100
Branding Kendaraan Pearson Correlation .897** .969
** 1 .977
**
Sig. (2-tailed) .000 .000
.000
N 100 100 100 100
Advertising Pearson Correlation .966** .991
** .977
** 1
Sig. (2-tailed) .000 .000 .000
N 100 100 100 100
**. Correlation is significant at the 0.01 level (2-tailed).

105
Lampiran 12. (Lanjutan)
Hasil Uji Validitas Variabel Personal Selling:
Correlations
Salesman Sampel Produk Pameran Dagang Personal Selling
Salesman Pearson Correlation 1 .380** .449
** .763
**
Sig. (2-tailed)
.000 .000 .000
N 100 100 100 100
Sampel Produk Pearson Correlation .380** 1 .890
** .868
**
Sig. (2-tailed) .000
.000 .000
N 100 100 100 100
Pameran Dagang Pearson Correlation .449** .890
** 1 .902
**
Sig. (2-tailed) .000 .000
.000
N 100 100 100 100
Personal Selling Pearson Correlation .763** .868
** .902
** 1
Sig. (2-tailed) .000 .000 .000
N 100 100 100 100
**. Correlation is significant at the 0.01 level (2-tailed).
106
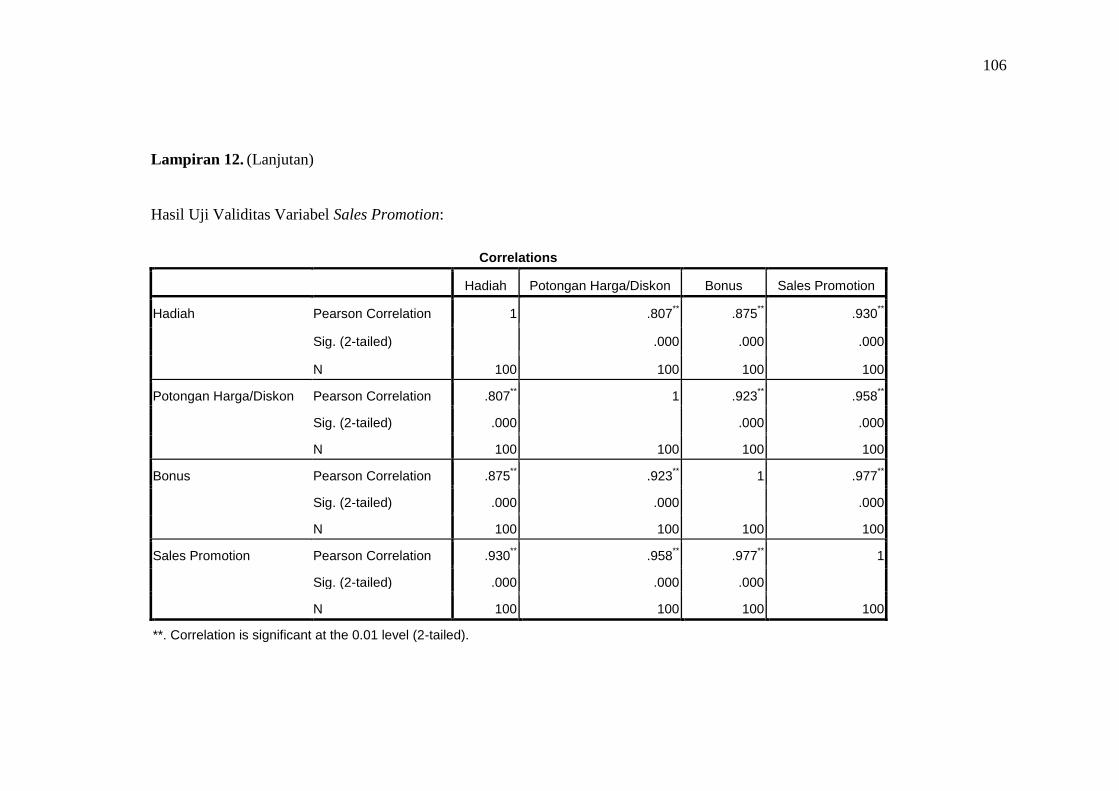
Lampiran 12. (Lanjutan)
Hasil Uji Validitas Variabel Sales Promotion:
Correlations
Hadiah Potongan Harga/Diskon Bonus Sales Promotion
Hadiah Pearson Correlation 1 .807** .875
** .930
**
Sig. (2-tailed)
.000 .000 .000
N 100 100 100 100
Potongan Harga/Diskon Pearson Correlation .807** 1 .923
** .958
**
Sig. (2-tailed) .000
.000 .000
N 100 100 100 100
Bonus Pearson Correlation .875** .923
** 1 .977
**
Sig. (2-tailed) .000 .000
.000
N 100 100 100 100
Sales Promotion Pearson Correlation .930** .958
** .977
** 1
Sig. (2-tailed) .000 .000 .000
N 100 100 100 100
**. Correlation is significant at the 0.01 level (2-tailed).
107
Lampiran 12. (Lanjutan)
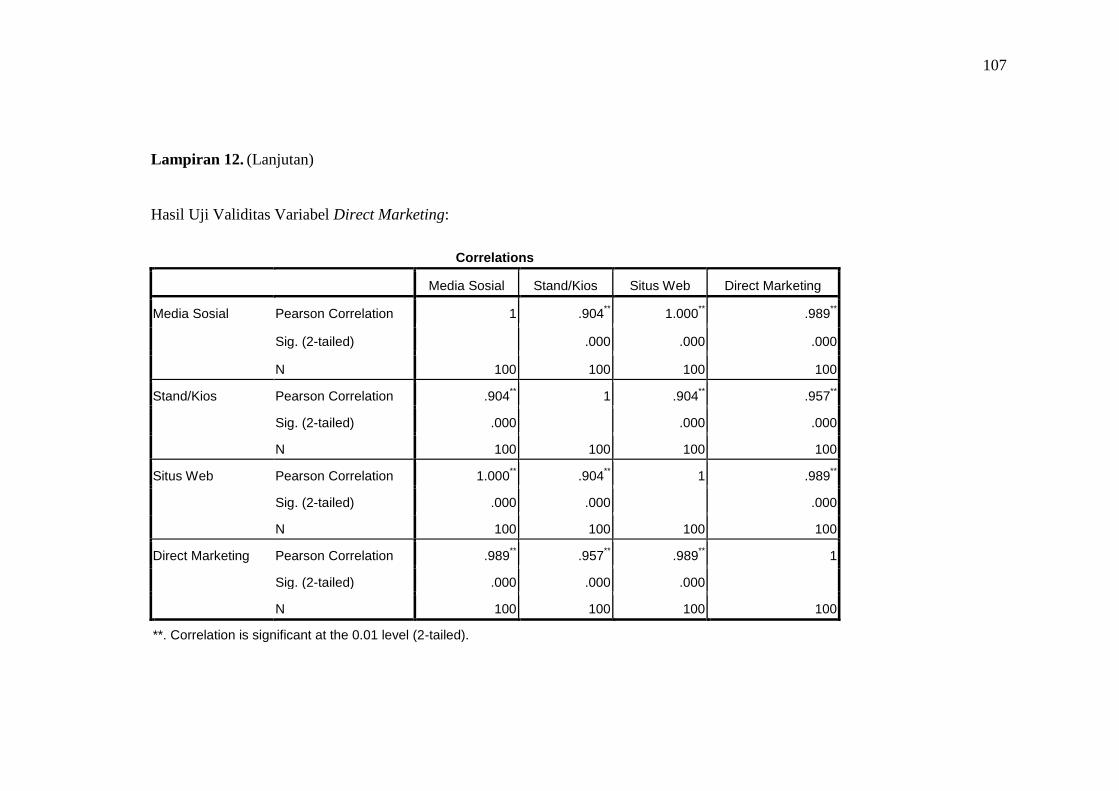
Hasil Uji Validitas Variabel Direct Marketing:
Correlations
Media Sosial Stand/Kios Situs Web Direct Marketing
Media Sosial Pearson Correlation 1 .904** 1.000
** .989
**
Sig. (2-tailed)
.000 .000 .000
N 100 100 100 100
Stand/Kios Pearson Correlation .904** 1 .904
** .957
**
Sig. (2-tailed) .000
.000 .000
N 100 100 100 100
Situs Web Pearson Correlation 1.000** .904
** 1 .989
**
Sig. (2-tailed) .000 .000
.000
N 100 100 100 100
Direct Marketing Pearson Correlation .989** .957
** .989
** 1
Sig. (2-tailed) .000 .000 .000
N 100 100 100 100
**. Correlation is significant at the 0.01 level (2-tailed).

108
Lampiran 12. (Lanjutan)
Hasil Uji Validitas Variabel Public Relation:
Correlations
Acara Khusus Sponsorship Pelayanan Masyarakat Public Relations
Acara Khusus Pearson Correlation 1 .758** .991
** .966
**
Sig. (2-tailed)
.000 .000 .000
N 100 100 100 100
Sponsorship Pearson Correlation .758** 1 .769
** .899
**
Sig. (2-tailed) .000
.000 .000
N 100 100 100 100
Pelayanan Masyarakat Pearson Correlation .991** .769
** 1 .970
**
Sig. (2-tailed) .000 .000
.000
N 100 100 100 100
Public Relations Pearson Correlation .966** .899
** .970
** 1
Sig. (2-tailed) .000 .000 .000
N 100 100 100 100
**. Correlation is significant at the 0.01 level (2-tailed).
109
Lampiran 12. (Lanjutan)
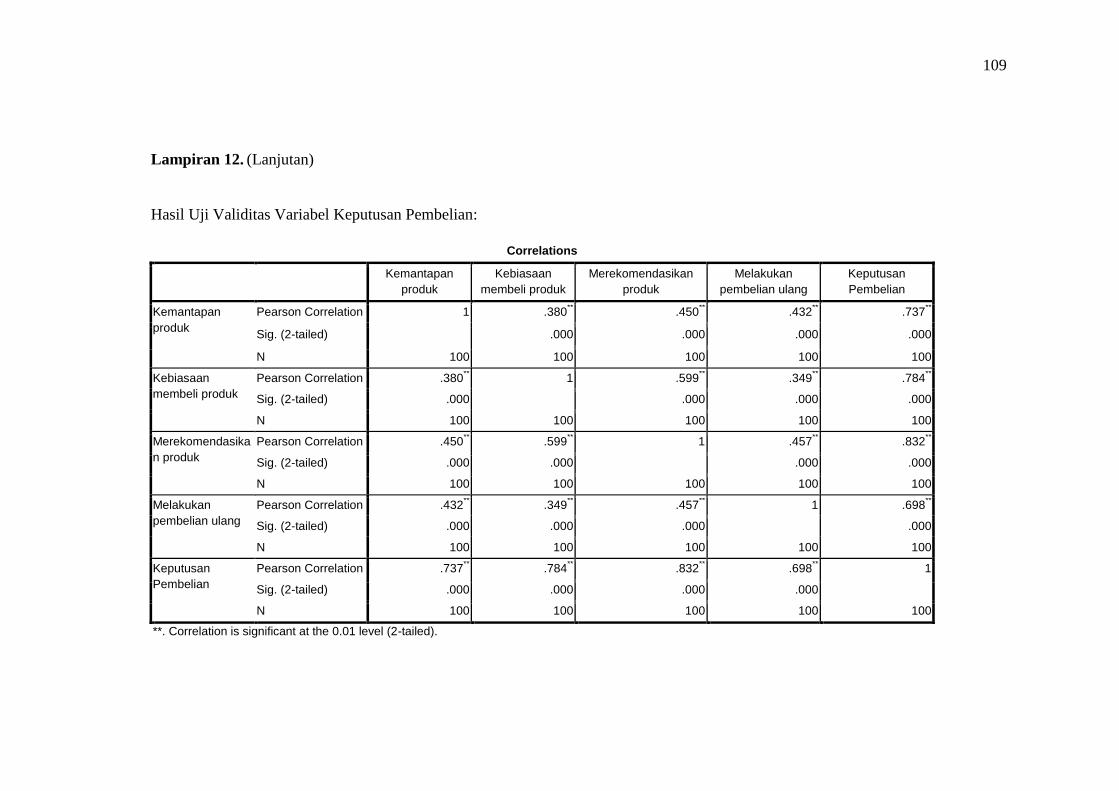
Hasil Uji Validitas Variabel Keputusan Pembelian:
Correlations
Kemantapan
produk
Kebiasaan
membeli produk
Merekomendasikan
produk
Melakukan
pembelian ulang
Keputusan
Pembelian
Kemantapan
produk
Pearson Correlation 1 .380** .450
** .432
** .737
**
Sig. (2-tailed) .000 .000 .000 .000
N 100 100 100 100 100
Kebiasaan
membeli produk
Pearson Correlation .380** 1 .599
** .349
** .784
**
Sig. (2-tailed) .000 .000 .000 .000
N 100 100 100 100 100
Merekomendasika
n produk
Pearson Correlation .450** .599
** 1 .457
** .832
**
Sig. (2-tailed) .000 .000 .000 .000
N 100 100 100 100 100
Melakukan
pembelian ulang
Pearson Correlation .432** .349
** .457
** 1 .698
**
Sig. (2-tailed) .000 .000 .000 .000
N 100 100 100 100 100
Keputusan
Pembelian
Pearson Correlation .737** .784
** .832
** .698
** 1
Sig. (2-tailed) .000 .000 .000 .000
N 100 100 100 100 100
**. Correlation is significant at the 0.01 level (2-tailed).
110
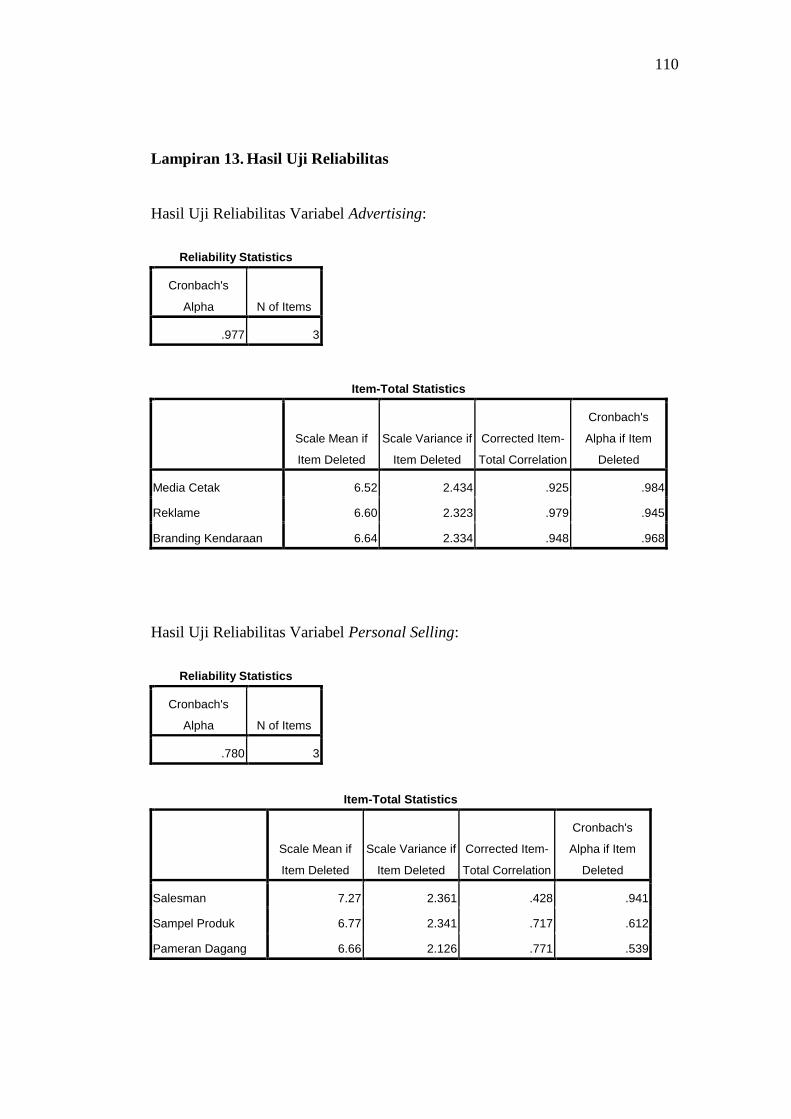
Lampiran 13. Hasil Uji Reliabilitas
Hasil Uji Reliabilitas Variabel Advertising:
Reliability Statistics
Cronbach's
Alpha N of Items
.977 3
Item-Total Statistics
Scale Mean if
Item Deleted
Scale Variance if
Item Deleted
Corrected Item-
Total Correlation
Cronbach's
Alpha if Item
Deleted
Media Cetak 6.52 2.434 .925 .984
Reklame 6.60 2.323 .979 .945
Branding Kendaraan 6.64 2.334 .948 .968
Hasil Uji Reliabilitas Variabel Personal Selling:
Reliability Statistics
Cronbach's
Alpha N of Items
.780 3
Item-Total Statistics
Scale Mean if
Item Deleted
Scale Variance if
Item Deleted
Corrected Item-
Total Correlation
Cronbach's
Alpha if Item
Deleted
Salesman 7.27 2.361 .428 .941
Sampel Produk 6.77 2.341 .717 .612
Pameran Dagang 6.66 2.126 .771 .539
111
Lampiran 13. (Lanjutan)
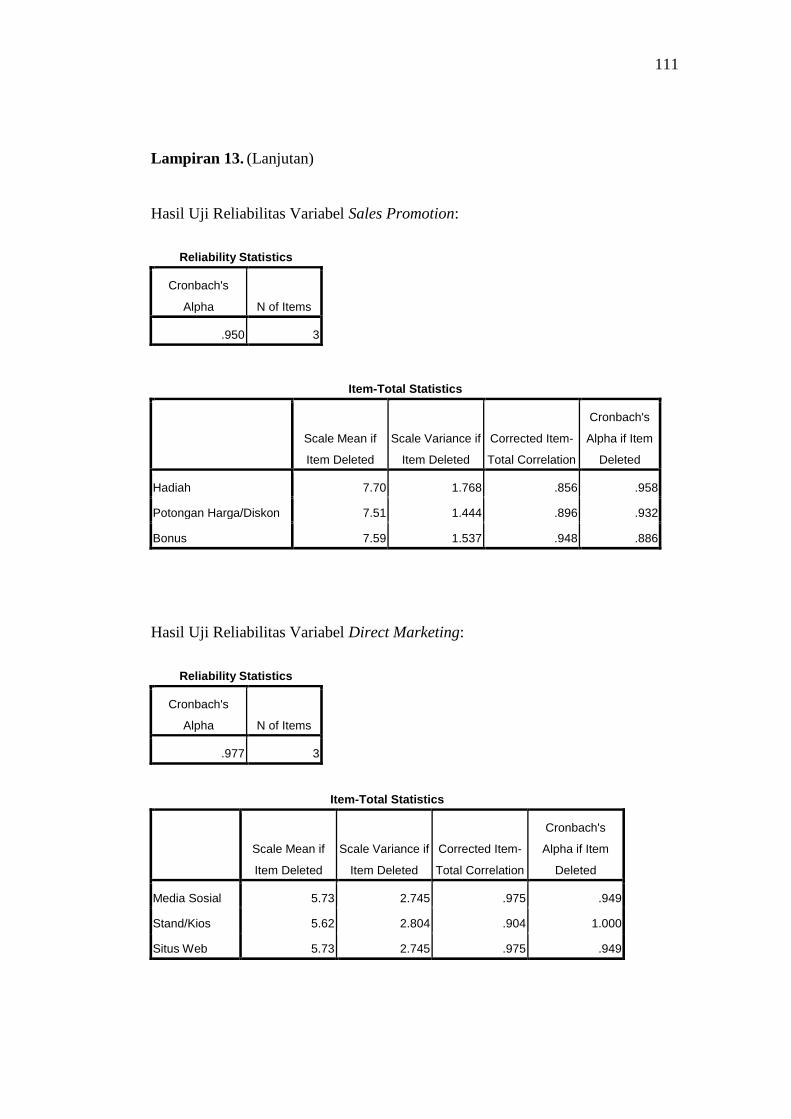
Hasil Uji Reliabilitas Variabel Sales Promotion:
Reliability Statistics
Cronbach's
Alpha N of Items
.950 3
Item-Total Statistics
Scale Mean if
Item Deleted
Scale Variance if
Item Deleted
Corrected Item-
Total Correlation
Cronbach's
Alpha if Item
Deleted
Hadiah 7.70 1.768 .856 .958
Potongan Harga/Diskon 7.51 1.444 .896 .932
Bonus 7.59 1.537 .948 .886
Hasil Uji Reliabilitas Variabel Direct Marketing:
Reliability Statistics
Cronbach's
Alpha N of Items
.977 3
Item-Total Statistics
Scale Mean if
Item Deleted
Scale Variance if
Item Deleted
Corrected Item-
Total Correlation
Cronbach's
Alpha if Item
Deleted
Media Sosial 5.73 2.745 .975 .949
Stand/Kios 5.62 2.804 .904 1.000
Situs Web 5.73 2.745 .975 .949
112
Lampiran 13. (Lanjutan)
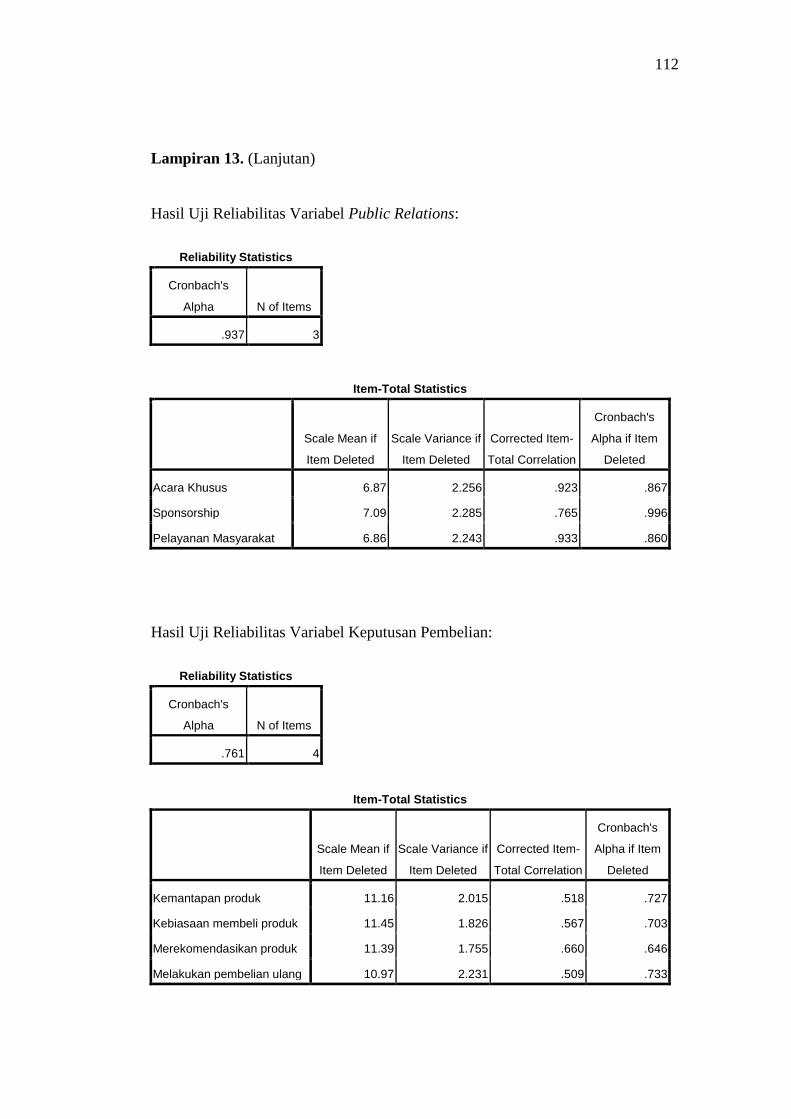
Hasil Uji Reliabilitas Variabel Public Relations:
Reliability Statistics
Cronbach's
Alpha N of Items
.937 3
Item-Total Statistics
Scale Mean if
Item Deleted
Scale Variance if
Item Deleted
Corrected Item-
Total Correlation
Cronbach's
Alpha if Item
Deleted
Acara Khusus 6.87 2.256 .923 .867
Sponsorship 7.09 2.285 .765 .996
Pelayanan Masyarakat 6.86 2.243 .933 .860
Hasil Uji Reliabilitas Variabel Keputusan Pembelian:
Reliability Statistics
Cronbach's
Alpha N of Items
.761 4
Item-Total Statistics
Scale Mean if
Item Deleted
Scale Variance if
Item Deleted
Corrected Item-
Total Correlation
Cronbach's
Alpha if Item
Deleted
Kemantapan produk 11.16 2.015 .518 .727
Kebiasaan membeli produk 11.45 1.826 .567 .703
Merekomendasikan produk 11.39 1.755 .660 .646
Melakukan pembelian ulang 10.97 2.231 .509 .733
113
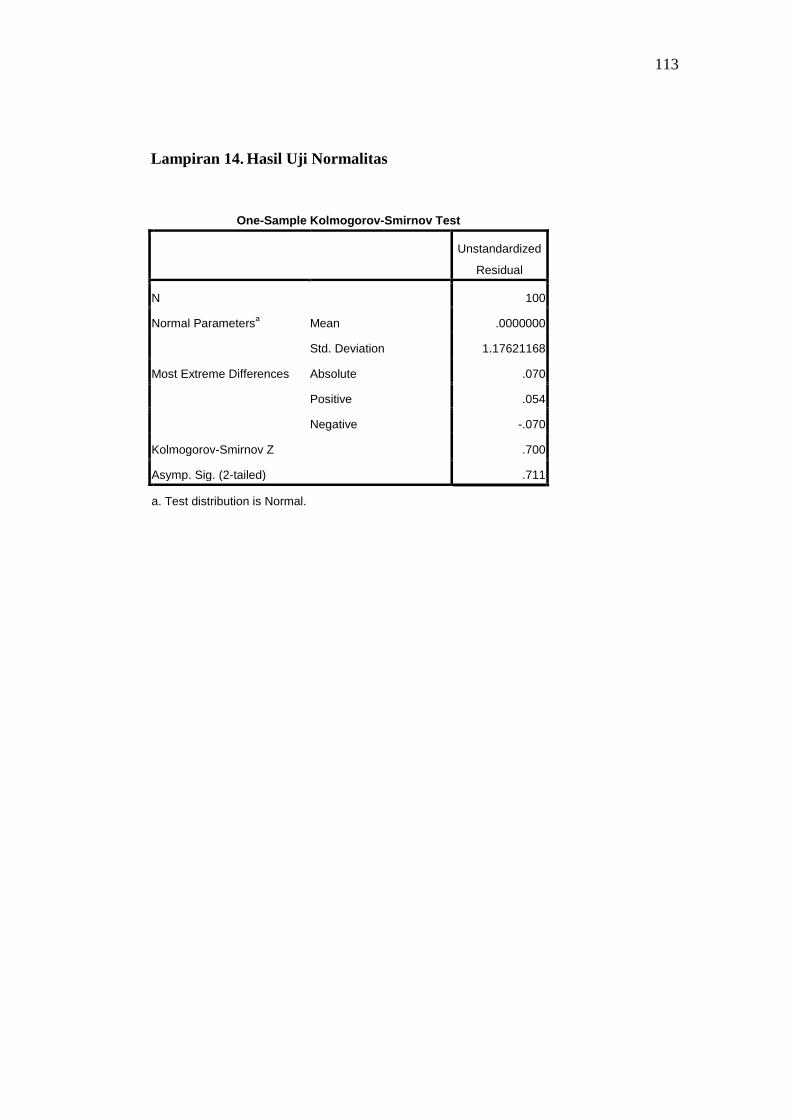
Lampiran 14. Hasil Uji Normalitas
One-Sample Kolmogorov-Smirnov Test
Unstandardized
Residual
N 100
Normal Parametersa Mean .0000000
Std. Deviation 1.17621168
Most Extreme Differences Absolute .070
Positive .054
Negative -.070
Kolmogorov-Smirnov Z .700
Asymp. Sig. (2-tailed) .711
a. Test distribution is Normal.
114
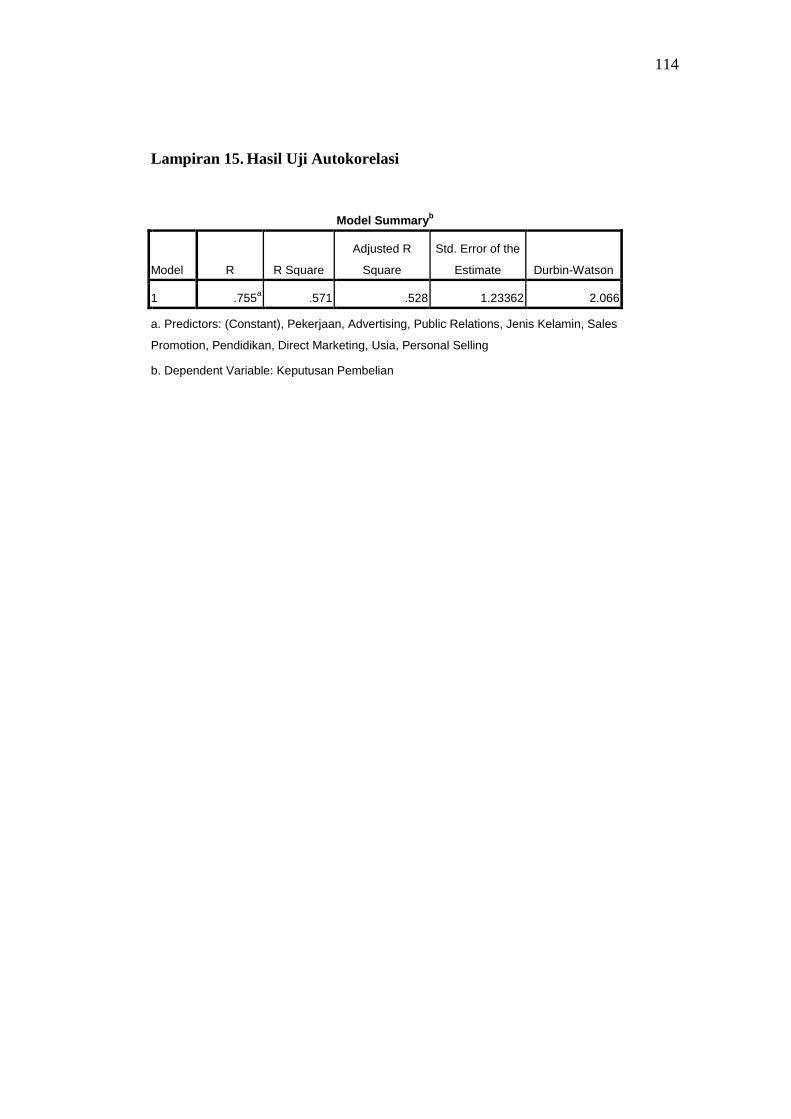
Lampiran 15. Hasil Uji Autokorelasi
Model Summaryb
Model R R Square
Adjusted R
Square
Std. Error of the
Estimate Durbin-Watson
1 .755a .571 .528 1.23362 2.066
a. Predictors: (Constant), Pekerjaan, Advertising, Public Relations, Jenis Kelamin, Sales
Promotion, Pendidikan, Direct Marketing, Usia, Personal Selling
b. Dependent Variable: Keputusan Pembelian

115
Lampiran 16. Hasil Uji Multikolinearitas
Coefficientsa
Model
Unstandardized Coefficients
Standardized
Coefficients
t Sig.
Collinearity Statistics
B Std. Error Beta Tolerance VIF
1 (Constant) 5.170 1.077
4.802 .000
Advertising .317 .062 .405 5.112 .000 .762 1.313
Personal Selling -.148 .118 -.177 -1.260 .211 .240 4.160
Sales Promotion .339 .116 .352 2.911 .005 .327 3.060
Direct Marketing .173 .062 .239 2.796 .006 .651 1.537
Public Relations .081 .066 .101 1.229 .222 .712 1.404
Jenis Kelamin .806 .288 .220 2.794 .006 .770 1.299
Usia .030 .011 .248 2.624 .010 .536 1.866
Pendidikan -.015 .136 -.010 -.113 .910 .590 1.696
Pekerjaan .647 .313 .175 2.064 .042 .665 1.504
a. Dependent Variable: Keputusan Pembelian
116
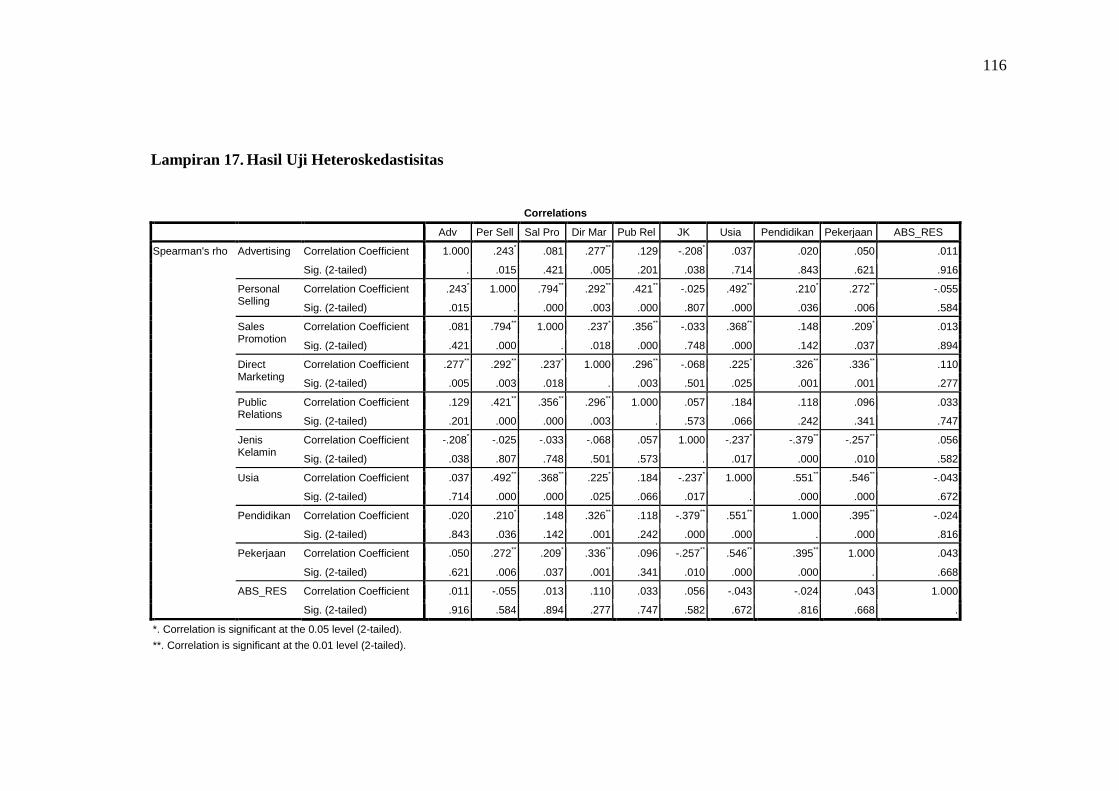
Lampiran 17. Hasil Uji Heteroskedastisitas
Correlations
Adv Per Sell Sal Pro Dir Mar Pub Rel JK Usia Pendidikan Pekerjaan ABS_RES
Spearman's rho Advertising Correlation Coefficient 1.000 .243* .081 .277
** .129 -.208
* .037 .020 .050 .011
Sig. (2-tailed) . .015 .421 .005 .201 .038 .714 .843 .621 .916
Personal Selling
Correlation Coefficient .243* 1.000 .794
** .292
** .421
** -.025 .492
** .210
* .272
** -.055
Sig. (2-tailed) .015 . .000 .003 .000 .807 .000 .036 .006 .584
Sales Promotion
Correlation Coefficient .081 .794** 1.000 .237
* .356
** -.033 .368
** .148 .209
* .013
Sig. (2-tailed) .421 .000 . .018 .000 .748 .000 .142 .037 .894
Direct Marketing
Correlation Coefficient .277** .292
** .237
* 1.000 .296
** -.068 .225
* .326
** .336
** .110
Sig. (2-tailed) .005 .003 .018 . .003 .501 .025 .001 .001 .277
Public Relations
Correlation Coefficient .129 .421** .356
** .296
** 1.000 .057 .184 .118 .096 .033
Sig. (2-tailed) .201 .000 .000 .003 . .573 .066 .242 .341 .747
Jenis Kelamin
Correlation Coefficient -.208* -.025 -.033 -.068 .057 1.000 -.237
* -.379
** -.257
** .056
Sig. (2-tailed) .038 .807 .748 .501 .573 . .017 .000 .010 .582
Usia Correlation Coefficient .037 .492** .368
** .225
* .184 -.237
* 1.000 .551
** .546
** -.043
Sig. (2-tailed) .714 .000 .000 .025 .066 .017 . .000 .000 .672
Pendidikan Correlation Coefficient .020 .210* .148 .326
** .118 -.379
** .551
** 1.000 .395
** -.024
Sig. (2-tailed) .843 .036 .142 .001 .242 .000 .000 . .000 .816
Pekerjaan Correlation Coefficient .050 .272** .209
* .336
** .096 -.257
** .546
** .395
** 1.000 .043
Sig. (2-tailed) .621 .006 .037 .001 .341 .010 .000 .000 . .668
ABS_RES Correlation Coefficient .011 -.055 .013 .110 .033 .056 -.043 -.024 .043 1.000
Sig. (2-tailed) .916 .584 .894 .277 .747 .582 .672 .816 .668 .
*. Correlation is significant at the 0.05 level (2-tailed).
**. Correlation is significant at the 0.01 level (2-tailed).
117
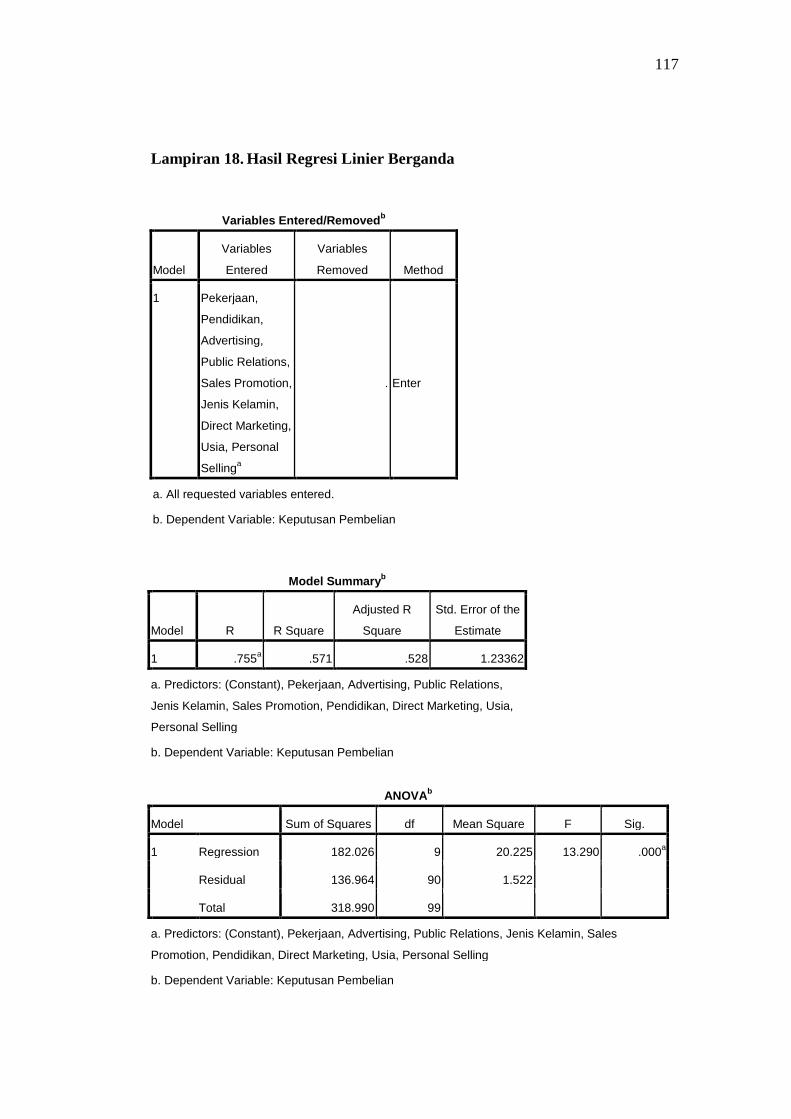
Lampiran 18. Hasil Regresi Linier Berganda
Variables Entered/Removedb
Model
Variables
Entered
Variables
Removed Method
1 Pekerjaan,
Pendidikan,
Advertising,
Public Relations,
Sales Promotion,
Jenis Kelamin,
Direct Marketing,
Usia, Personal
Sellinga
. Enter
a. All requested variables entered.
b. Dependent Variable: Keputusan Pembelian
Model Summaryb
Model R R Square
Adjusted R
Square
Std. Error of the
Estimate
1 .755a .571 .528 1.23362
a. Predictors: (Constant), Pekerjaan, Advertising, Public Relations,
Jenis Kelamin, Sales Promotion, Pendidikan, Direct Marketing, Usia,
Personal Selling
b. Dependent Variable: Keputusan Pembelian
ANOVAb
Model Sum of Squares df Mean Square F Sig.
1 Regression 182.026 9 20.225 13.290 .000a
Residual 136.964 90 1.522
Total 318.990 99
a. Predictors: (Constant), Pekerjaan, Advertising, Public Relations, Jenis Kelamin, Sales
Promotion, Pendidikan, Direct Marketing, Usia, Personal Selling
b. Dependent Variable: Keputusan Pembelian
118
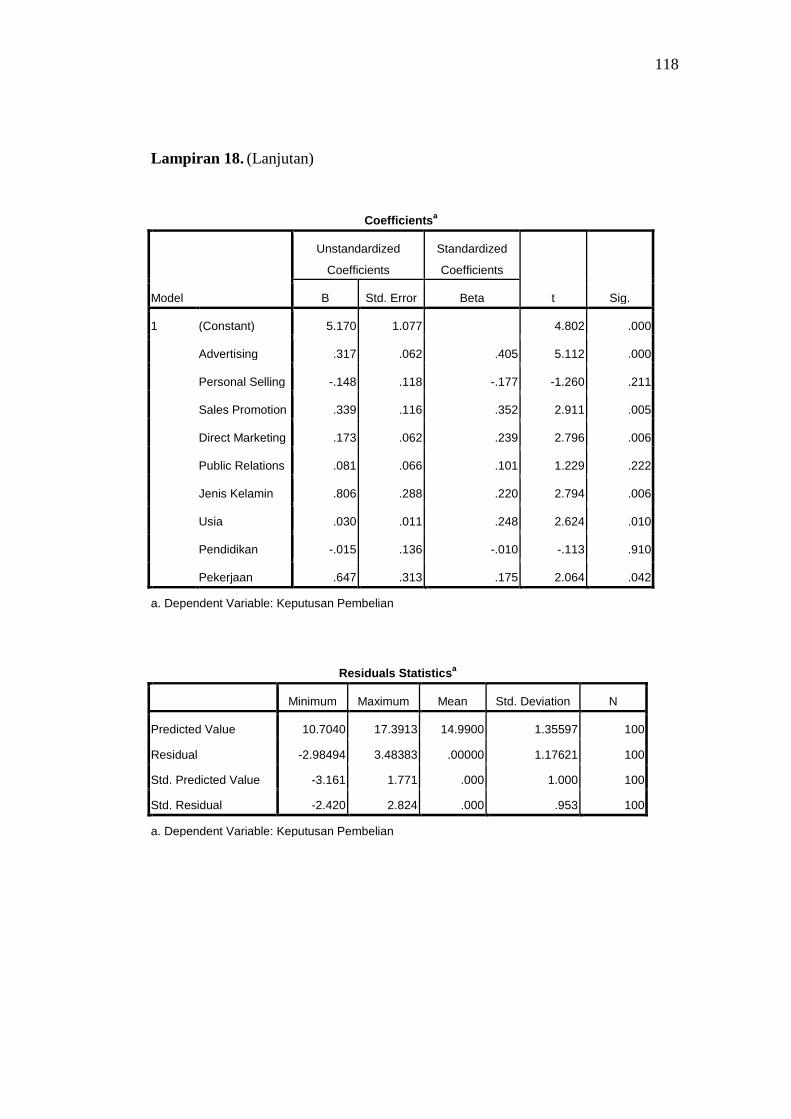
Lampiran 18. (Lanjutan)
Coefficientsa
Model
Unstandardized
Coefficients
Standardized
Coefficients
t Sig. B Std. Error Beta
1 (Constant) 5.170 1.077 4.802 .000
Advertising .317 .062 .405 5.112 .000
Personal Selling -.148 .118 -.177 -1.260 .211
Sales Promotion .339 .116 .352 2.911 .005
Direct Marketing .173 .062 .239 2.796 .006
Public Relations .081 .066 .101 1.229 .222
Jenis Kelamin .806 .288 .220 2.794 .006
Usia .030 .011 .248 2.624 .010
Pendidikan -.015 .136 -.010 -.113 .910
Pekerjaan .647 .313 .175 2.064 .042
a. Dependent Variable: Keputusan Pembelian
Residuals Statisticsa
Minimum Maximum Mean Std. Deviation N
Predicted Value 10.7040 17.3913 14.9900 1.35597 100
Residual -2.98494 3.48383 .00000 1.17621 100
Std. Predicted Value -3.161 1.771 .000 1.000 100
Std. Residual -2.420 2.824 .000 .953 100
a. Dependent Variable: Keputusan Pembelian