lampiran - core.ac.uk · prosedur pembuatan ekstrak daun salam ... letakkan objek glass diatas...
TRANSCRIPT
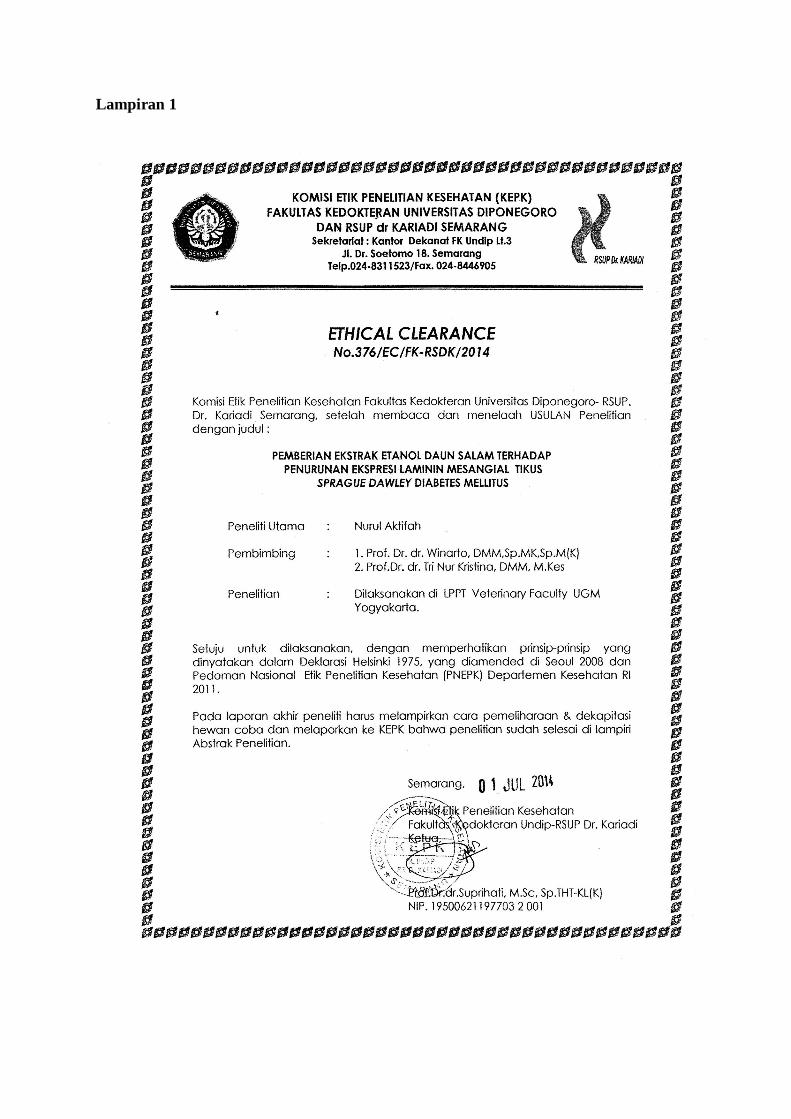
Lampiran 1
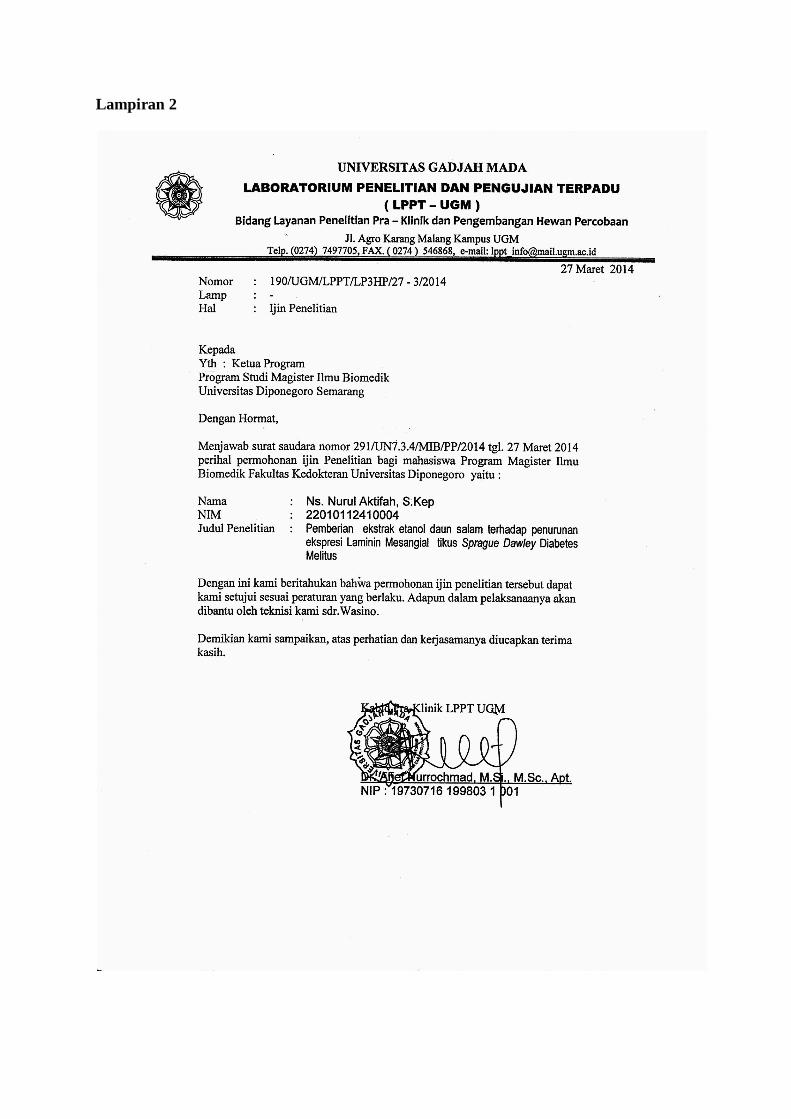
Lampiran 2
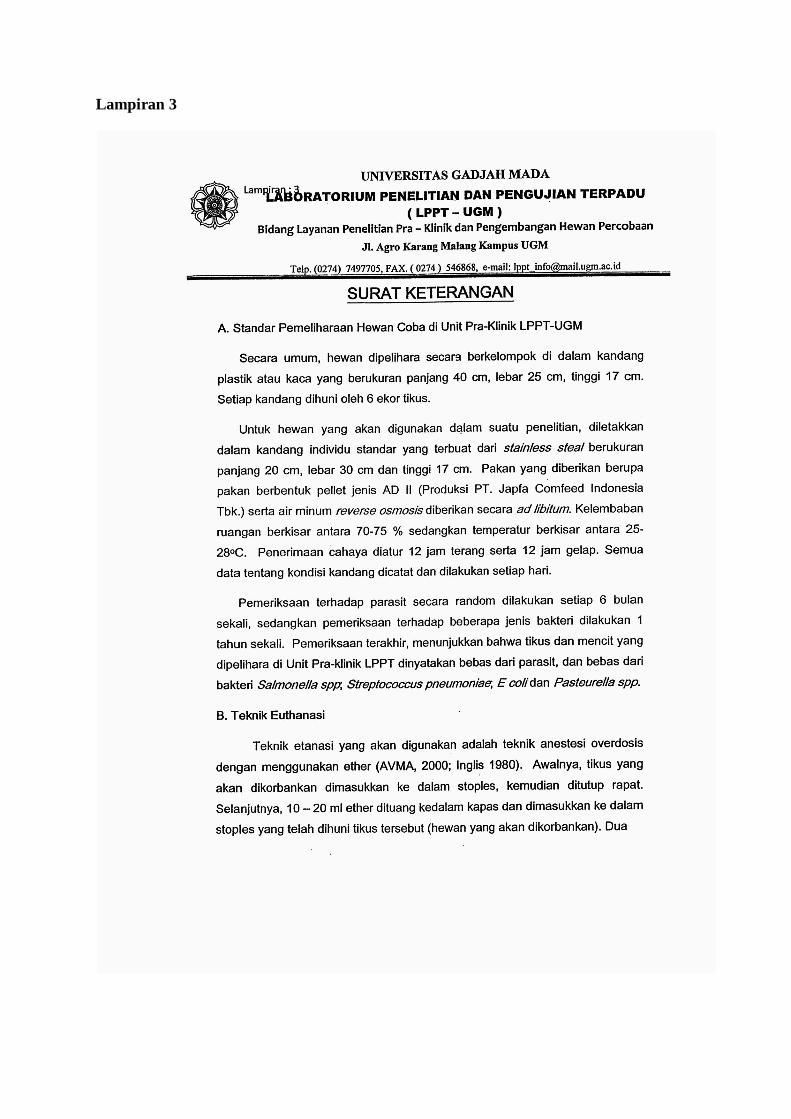
Lampiran 3

Lampiran 4

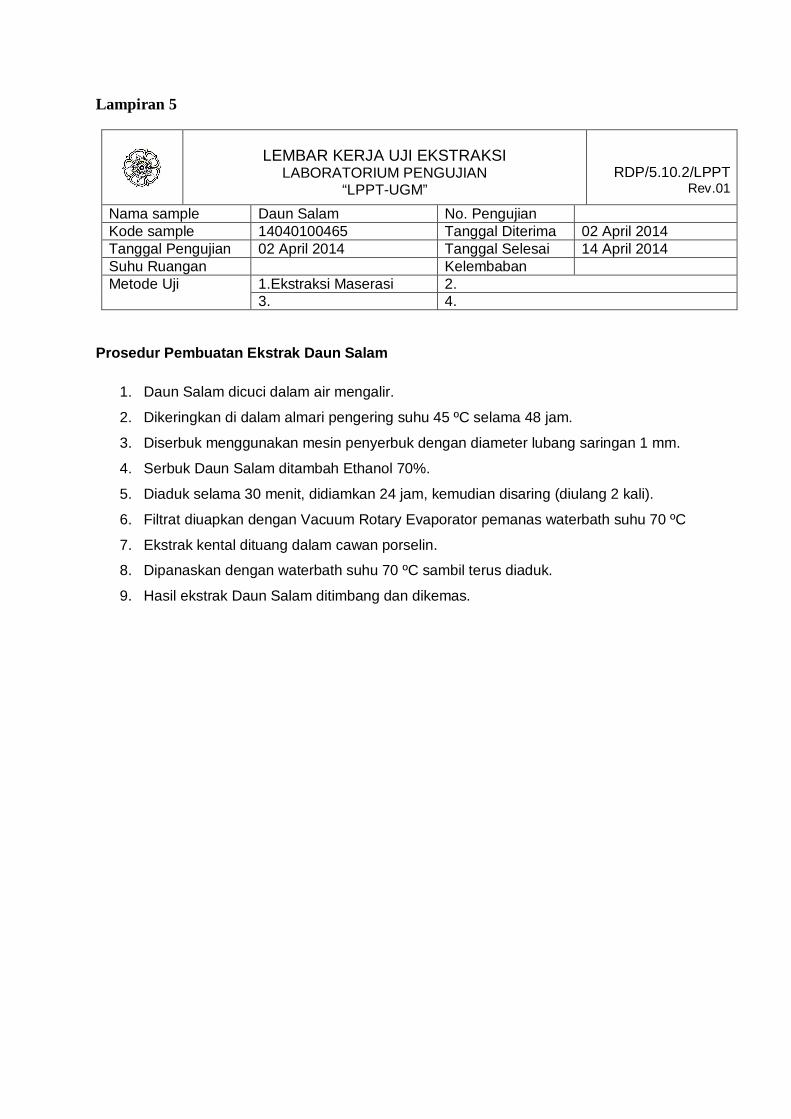
Lampiran 5
LEMBAR KERJA UJI EKSTRAKSI LABORATORIUM PENGUJIAN
“LPPT-UGM”
RDP/5.10.2/LPPT Rev.01
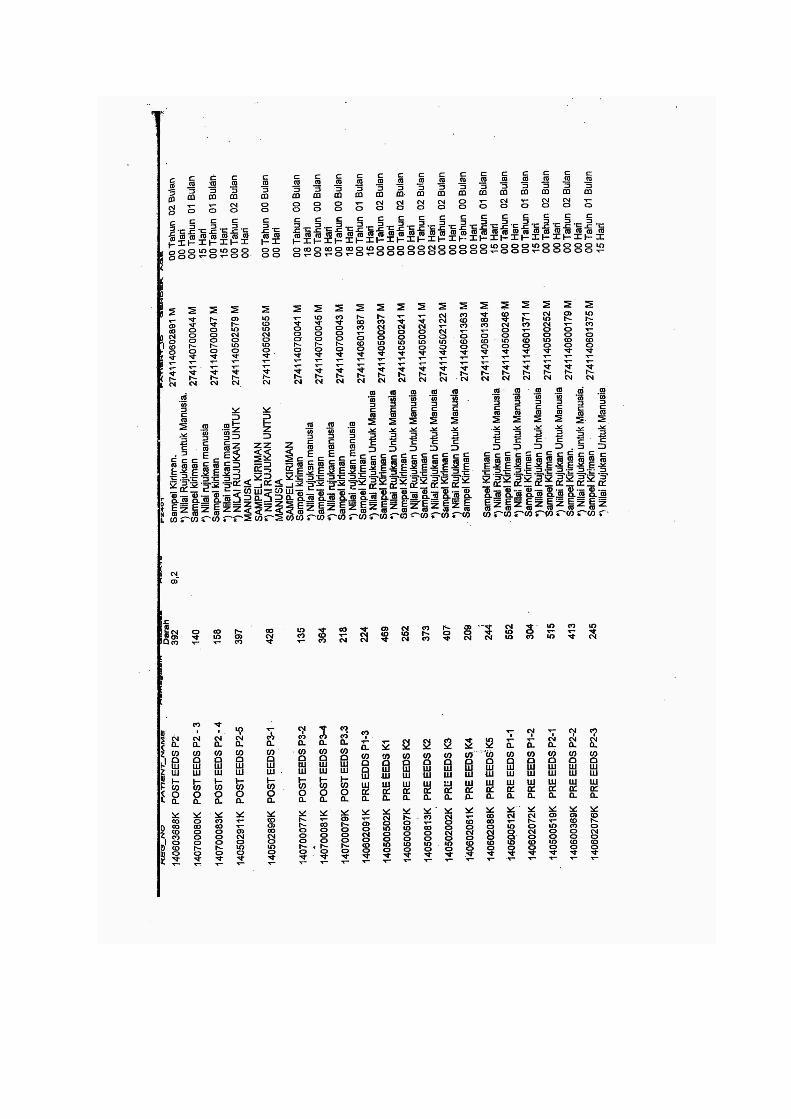
Nama sample Daun Salam No. Pengujian Kode sample 14040100465 Tanggal Diterima 02 April 2014 Tanggal Pengujian 02 April 2014 Tanggal Selesai 14 April 2014 Suhu Ruangan Kelembaban Metode Uji 1.Ekstraksi Maserasi 2. 3. 4.
Prosedur Pembuatan Ekstrak Daun Salam
1. Daun Salam dicuci dalam air mengalir. 2. Dikeringkan di dalam almari pengering suhu 45 ºC selama 48 jam. 3. Diserbuk menggunakan mesin penyerbuk dengan diameter lubang saringan 1 mm. 4. Serbuk Daun Salam ditambah Ethanol 70%. 5. Diaduk selama 30 menit, didiamkan 24 jam, kemudian disaring (diulang 2 kali). 6. Filtrat diuapkan dengan Vacuum Rotary Evaporator pemanas waterbath suhu 70 ºC 7. Ekstrak kental dituang dalam cawan porselin. 8. Dipanaskan dengan waterbath suhu 70 ºC sambil terus diaduk. 9. Hasil ekstrak Daun Salam ditimbang dan dikemas.
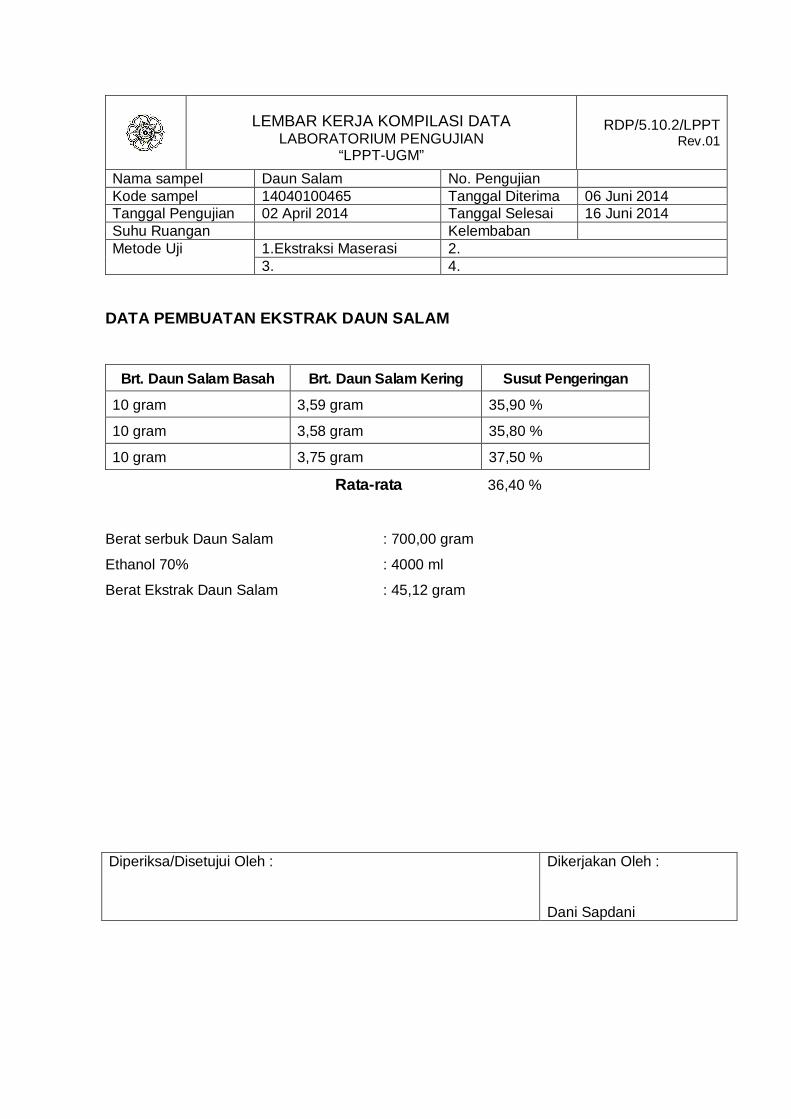
LEMBAR KERJA KOMPILASI DATA LABORATORIUM PENGUJIAN
“LPPT-UGM”
RDP/5.10.2/LPPT Rev.01
Nama sampel Daun Salam No. Pengujian Kode sampel 14040100465 Tanggal Diterima 06 Juni 2014 Tanggal Pengujian 02 April 2014 Tanggal Selesai 16 Juni 2014 Suhu Ruangan Kelembaban Metode Uji 1.Ekstraksi Maserasi 2. 3. 4.
DATA PEMBUATAN EKSTRAK DAUN SALAM
Brt. Daun Salam Basah Brt. Daun Salam Kering Susut Pengeringan
10 gram 3,59 gram 35,90 %
10 gram 3,58 gram 35,80 %
10 gram 3,75 gram 37,50 %
Rata-rata 36,40 %
Berat serbuk Daun Salam : 700,00 gram Ethanol 70% : 4000 ml Berat Ekstrak Daun Salam : 45,12 gram
Diperiksa/Disetujui Oleh :
Dikerjakan Oleh : Dani Sapdani
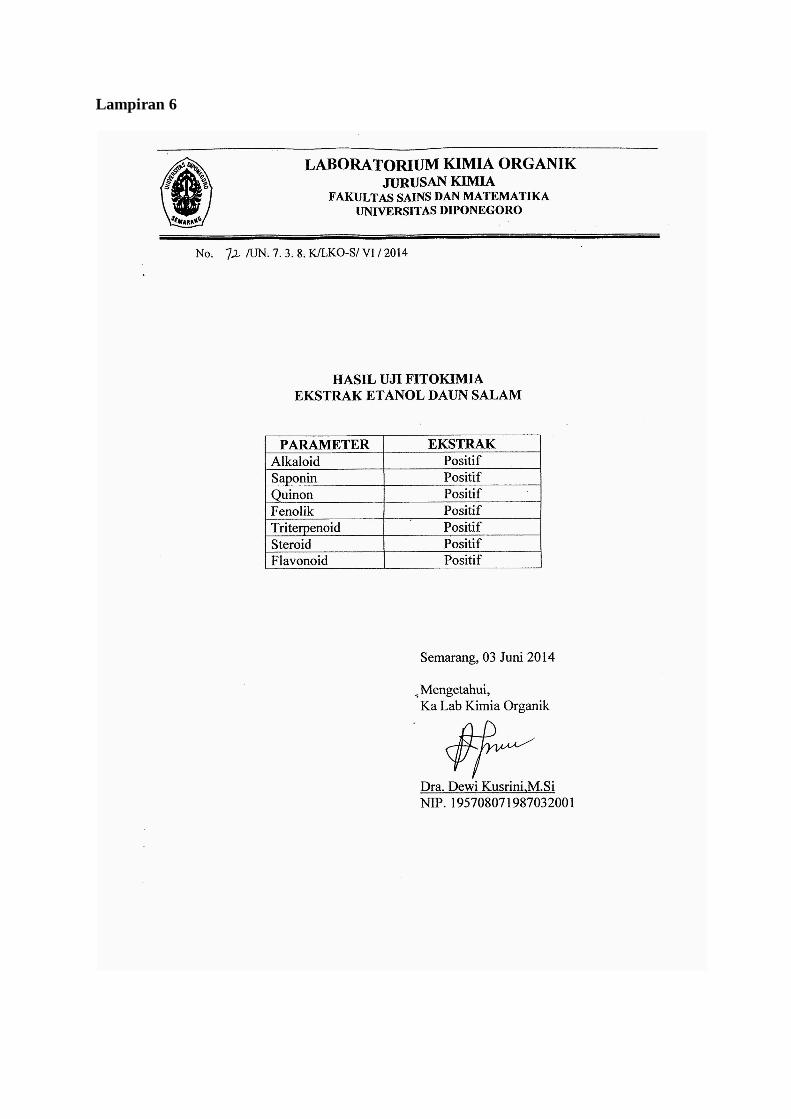
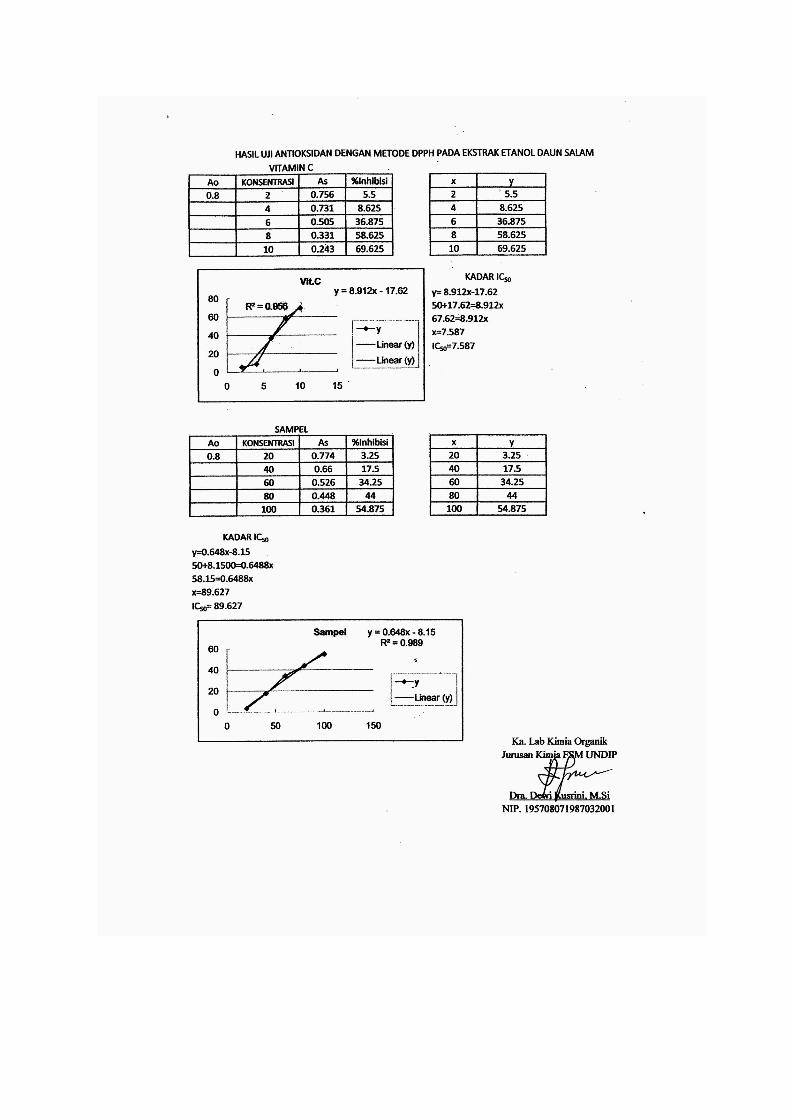
Lampiran 6
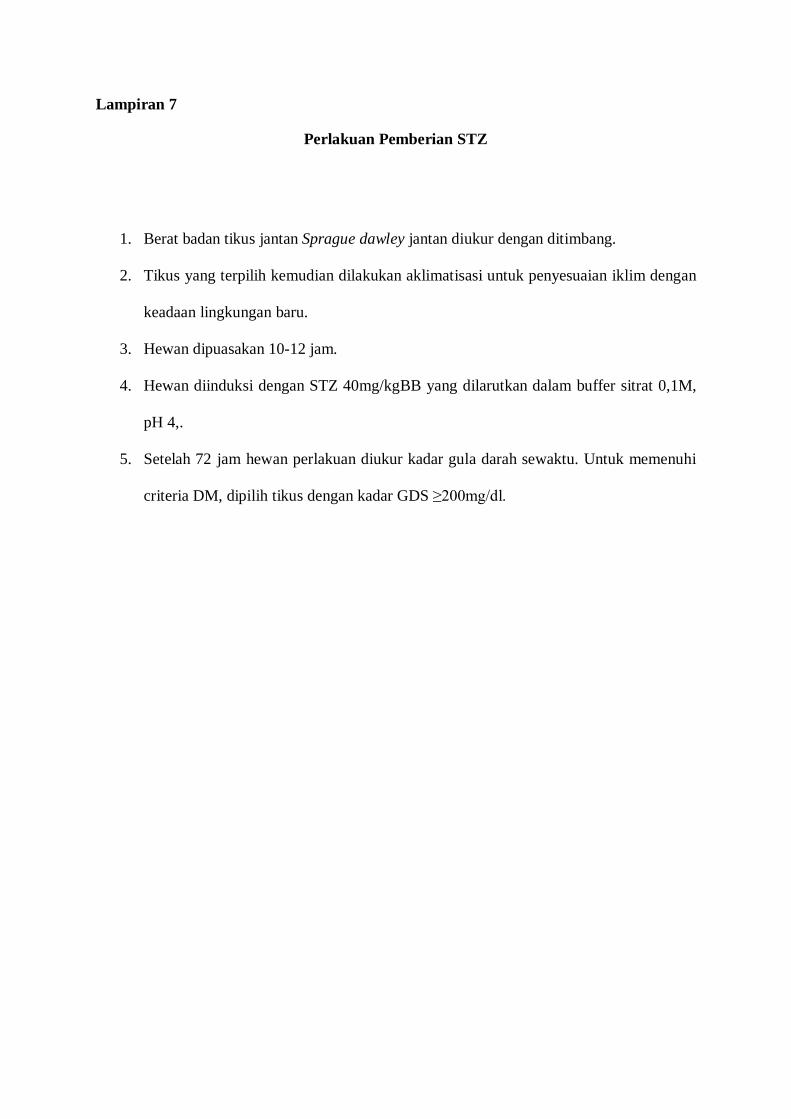
Lampiran 7
Perlakuan Pemberian STZ
1. Berat badan tikus jantan Sprague dawley jantan diukur dengan ditimbang.
2. Tikus yang terpilih kemudian dilakukan aklimatisasi untuk penyesuaian iklim dengan
keadaan lingkungan baru.
3. Hewan dipuasakan 10-12 jam.
4. Hewan diinduksi dengan STZ 40mg/kgBB yang dilarutkan dalam buffer sitrat 0,1M,
pH 4,.
5. Setelah 72 jam hewan perlakuan diukur kadar gula darah sewaktu. Untuk memenuhi
criteria DM, dipilih tikus dengan kadar GDS ≥200mg/dl.
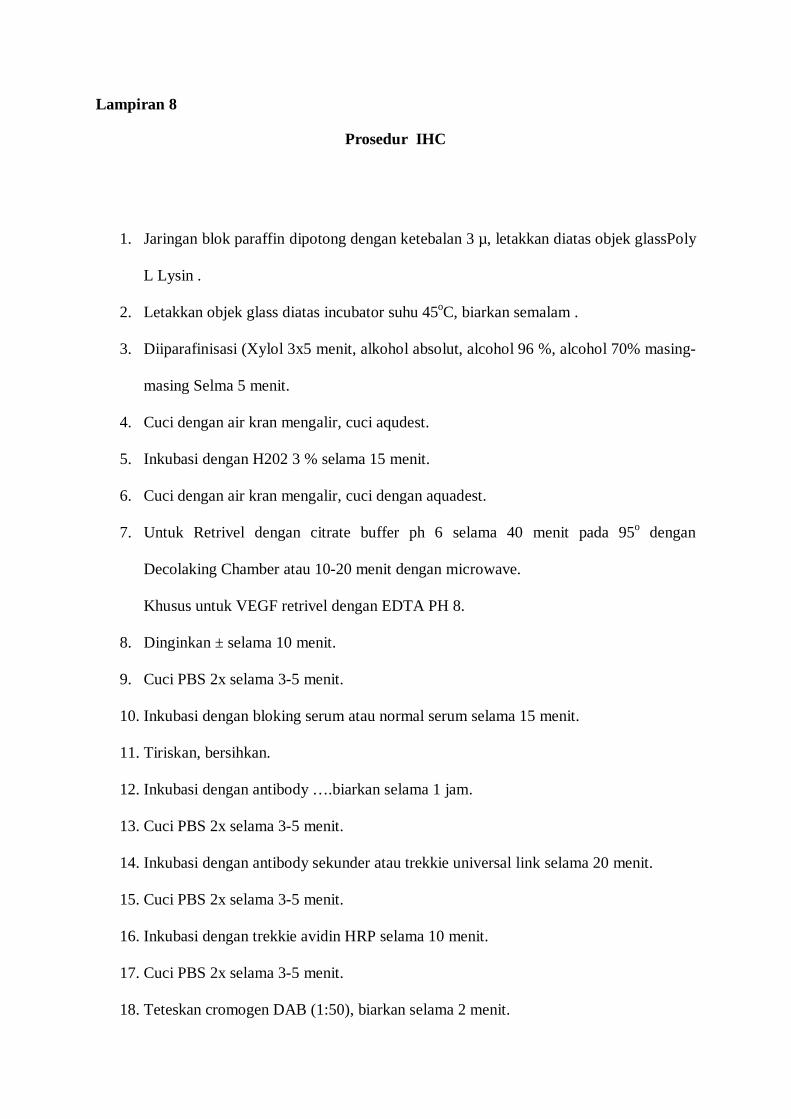
Lampiran 8
Prosedur IHC
1. Jaringan blok paraffin dipotong dengan ketebalan 3 µ, letakkan diatas objek glassPoly
L Lysin .
2. Letakkan objek glass diatas incubator suhu 45oC, biarkan semalam .
3. Diiparafinisasi (Xylol 3x5 menit, alkohol absolut, alcohol 96 %, alcohol 70% masing-
masing Selma 5 menit.
4. Cuci dengan air kran mengalir, cuci aqudest.
5. Inkubasi dengan H202 3 % selama 15 menit.
6. Cuci dengan air kran mengalir, cuci dengan aquadest.
7. Untuk Retrivel dengan citrate buffer ph 6 selama 40 menit pada 95o dengan
Decolaking Chamber atau 10-20 menit dengan microwave.
Khusus untuk VEGF retrivel dengan EDTA PH 8.
8. Dinginkan ± selama 10 menit.
9. Cuci PBS 2x selama 3-5 menit.
10. Inkubasi dengan bloking serum atau normal serum selama 15 menit.
11. Tiriskan, bersihkan.
12. Inkubasi dengan antibody ….biarkan selama 1 jam.
13. Cuci PBS 2x selama 3-5 menit.
14. Inkubasi dengan antibody sekunder atau trekkie universal link selama 20 menit.
15. Cuci PBS 2x selama 3-5 menit.
16. Inkubasi dengan trekkie avidin HRP selama 10 menit.
17. Cuci PBS 2x selama 3-5 menit.
18. Teteskan cromogen DAB (1:50), biarkan selama 2 menit.
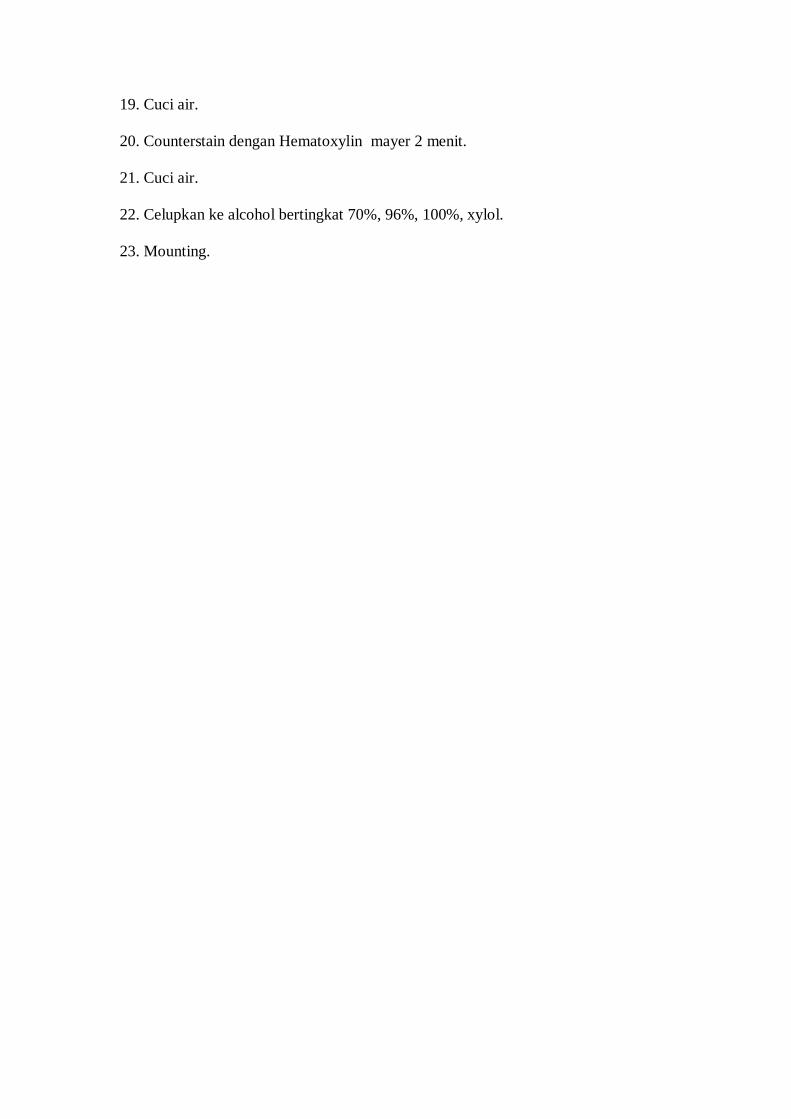
19. Cuci air.
20. Counterstain dengan Hematoxylin mayer 2 menit.
21. Cuci air.
22. Celupkan ke alcohol bertingkat 70%, 96%, 100%, xylol.
23. Mounting.
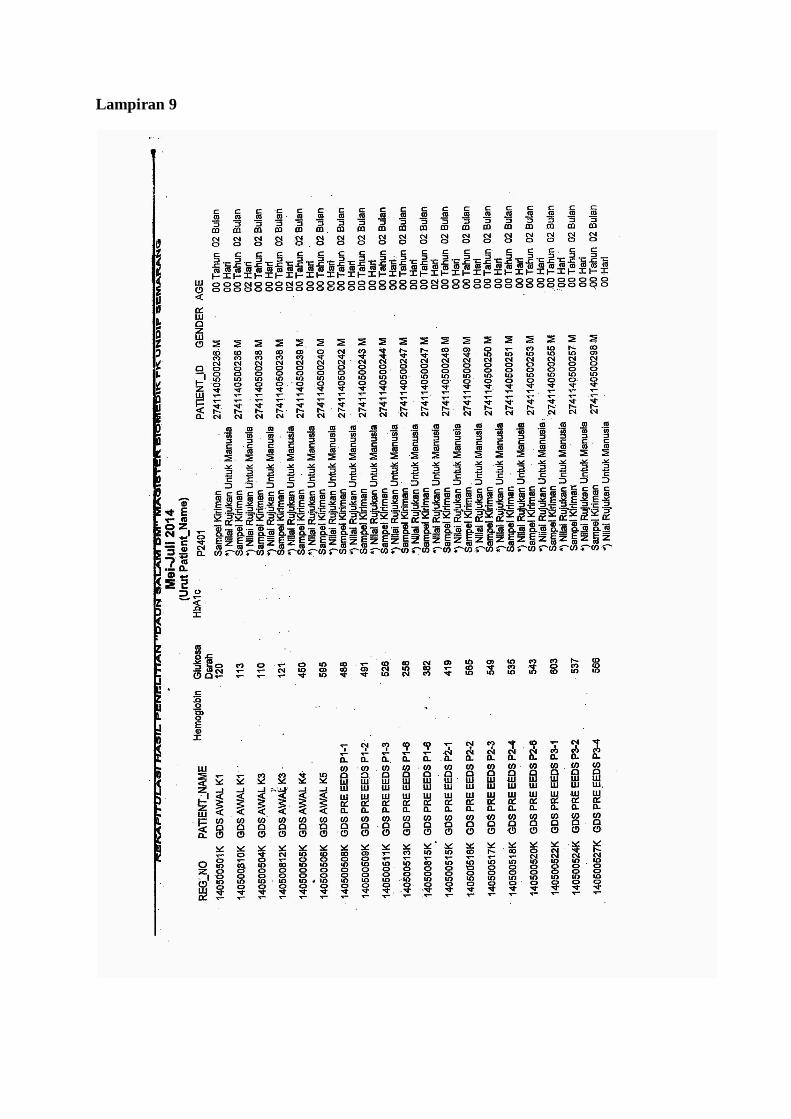
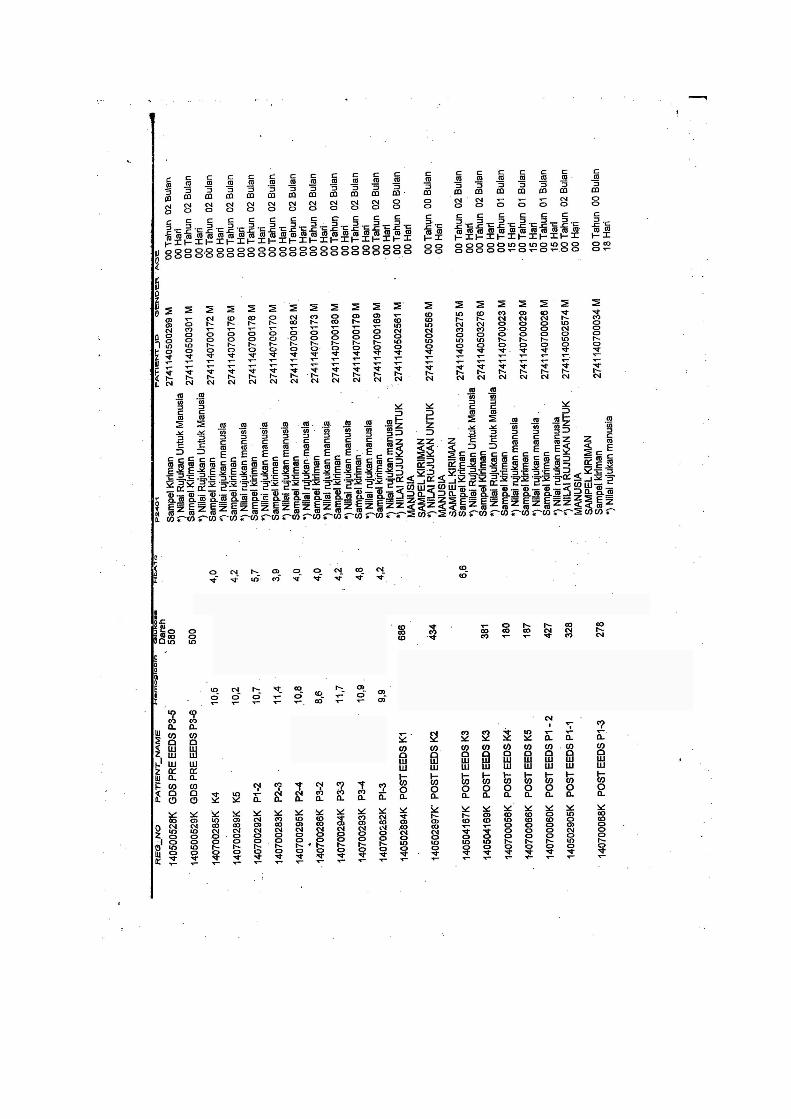
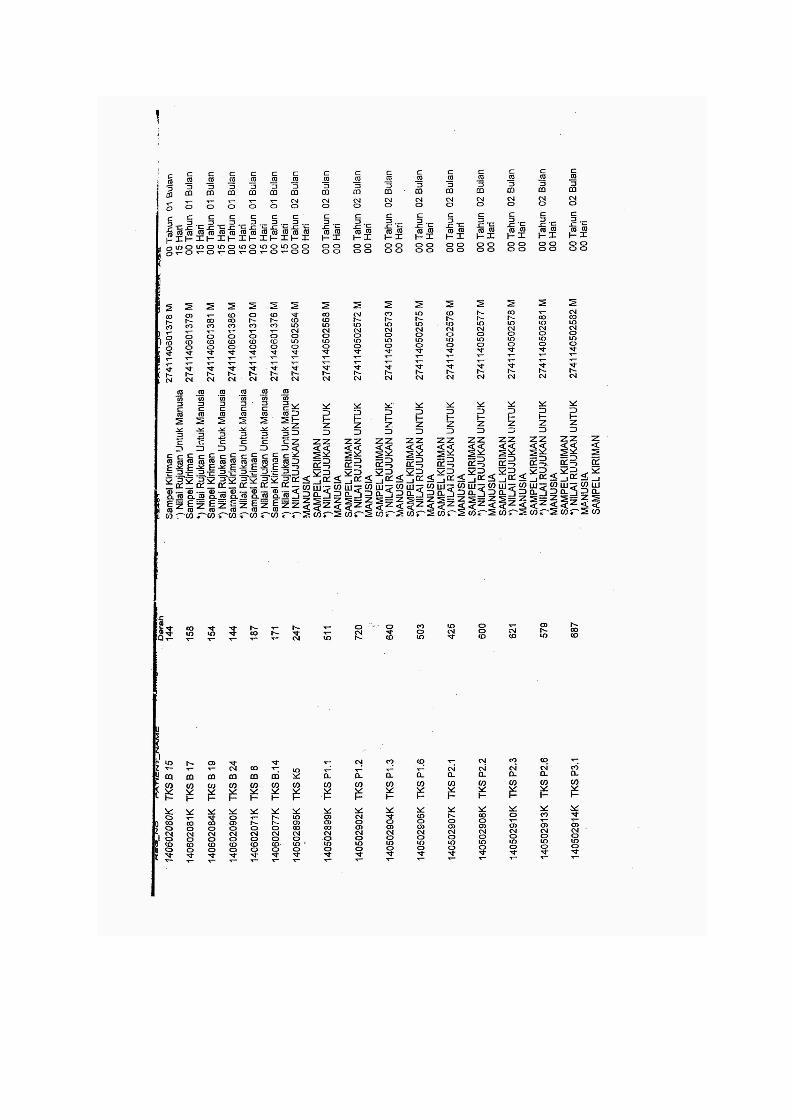
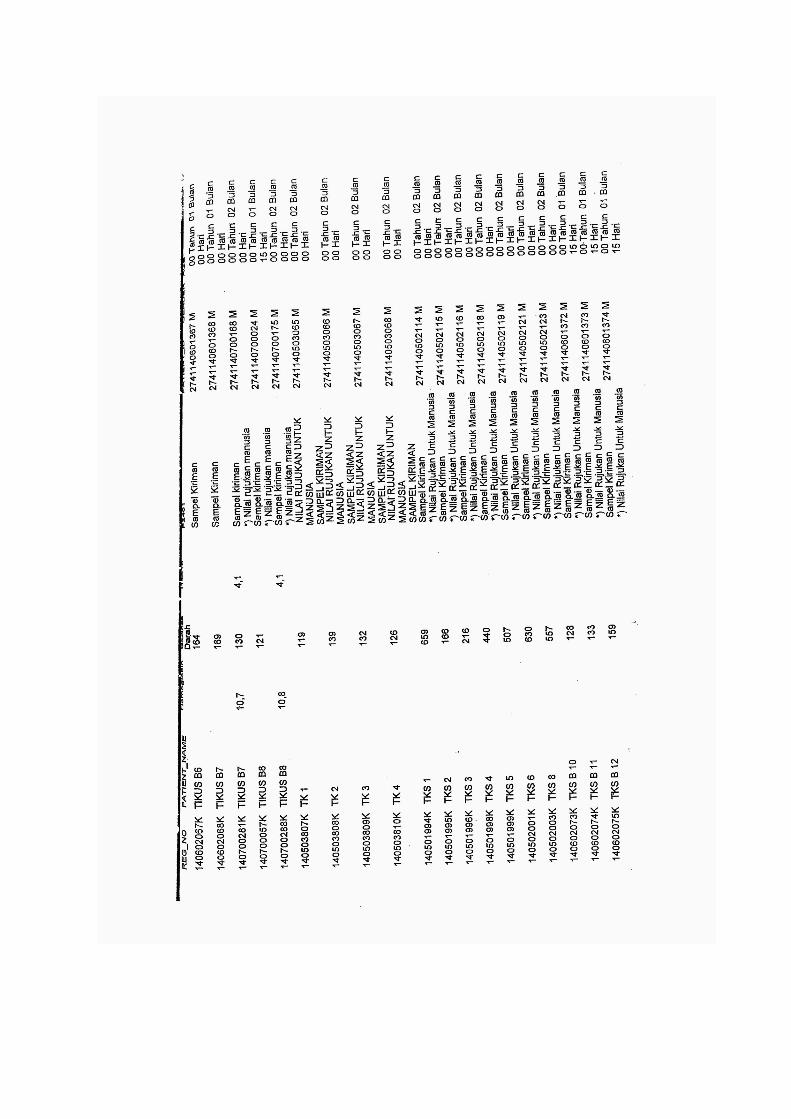
Lampiran 9
Lampiran 10
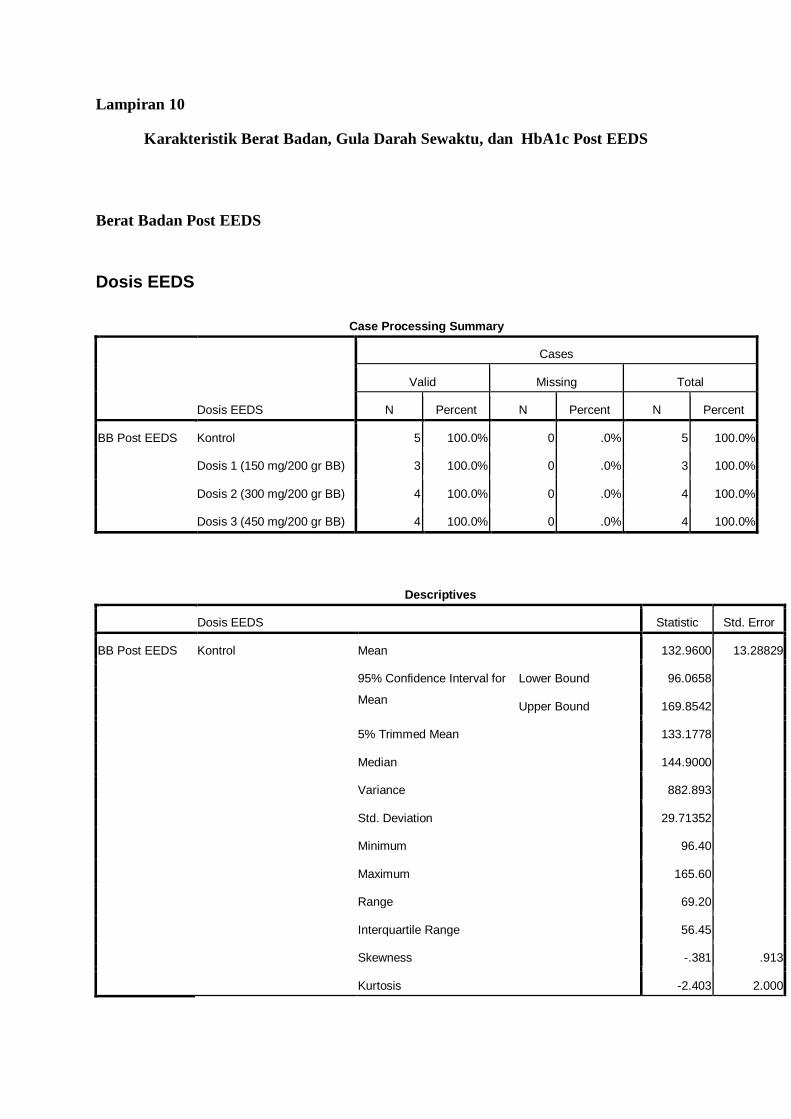
Karakteristik Berat Badan, Gula Darah Sewaktu, dan HbA1c Post EEDS
Berat Badan Post EEDS
Dosis EEDS
Case Processing Summary
Dosis EEDS
Cases
Valid Missing Total
N Percent N Percent N Percent
BB Post EEDS Kontrol 5 100.0% 0 .0% 5 100.0%
Dosis 1 (150 mg/200 gr BB) 3 100.0% 0 .0% 3 100.0%
Dosis 2 (300 mg/200 gr BB) 4 100.0% 0 .0% 4 100.0%
Dosis 3 (450 mg/200 gr BB) 4 100.0% 0 .0% 4 100.0%
Descriptives
Dosis EEDS Statistic Std. Error
BB Post EEDS Kontrol Mean 132.9600 13.28829
95% Confidence Interval for
Mean
Lower Bound 96.0658
Upper Bound 169.8542
5% Trimmed Mean 133.1778
Median 144.9000
Variance 882.893
Std. Deviation 29.71352
Minimum 96.40
Maximum 165.60
Range 69.20
Interquartile Range 56.45
Skewness -.381 .913
Kurtosis -2.403 2.000
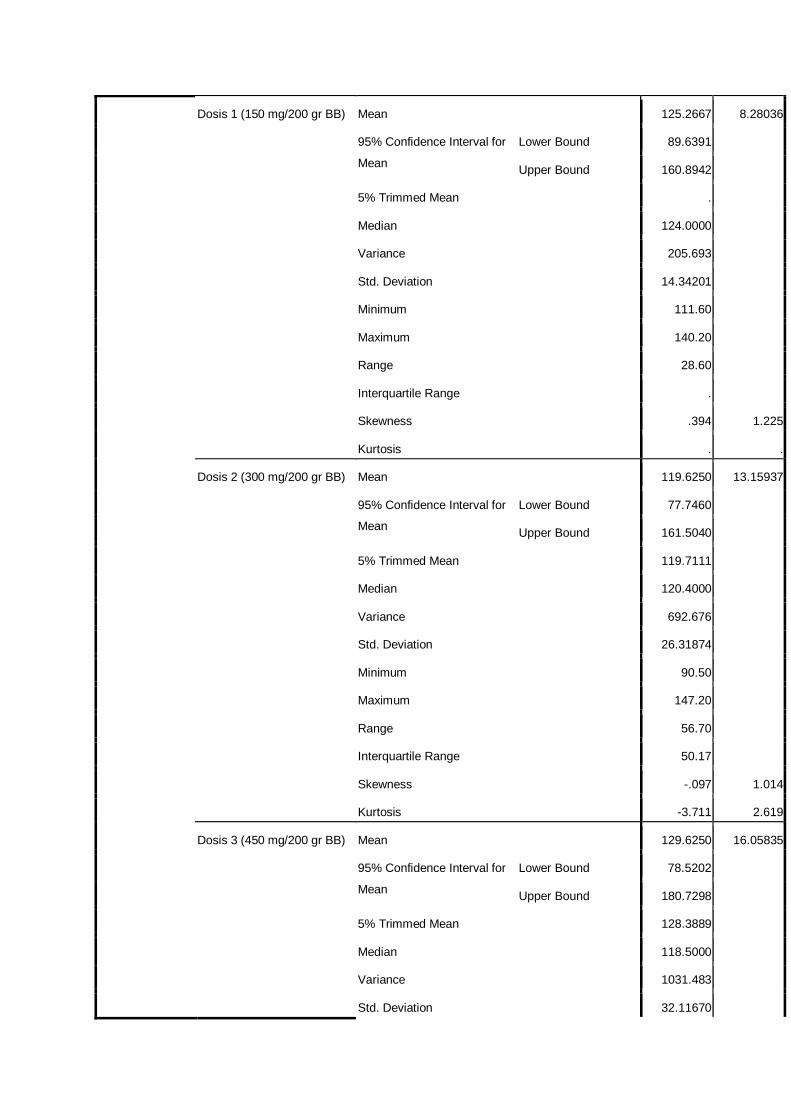
Dosis 1 (150 mg/200 gr BB) Mean 125.2667 8.28036
95% Confidence Interval for
Mean
Lower Bound 89.6391
Upper Bound 160.8942
5% Trimmed Mean .
Median 124.0000
Variance 205.693
Std. Deviation 14.34201
Minimum 111.60
Maximum 140.20
Range 28.60
Interquartile Range .
Skewness .394 1.225
Kurtosis . .
Dosis 2 (300 mg/200 gr BB) Mean 119.6250 13.15937
95% Confidence Interval for
Mean
Lower Bound 77.7460
Upper Bound 161.5040
5% Trimmed Mean 119.7111
Median 120.4000
Variance 692.676
Std. Deviation 26.31874
Minimum 90.50
Maximum 147.20
Range 56.70
Interquartile Range 50.17
Skewness -.097 1.014
Kurtosis -3.711 2.619
Dosis 3 (450 mg/200 gr BB) Mean 129.6250 16.05835
95% Confidence Interval for
Mean
Lower Bound 78.5202
Upper Bound 180.7298
5% Trimmed Mean 128.3889
Median 118.5000
Variance 1031.483
Std. Deviation 32.11670
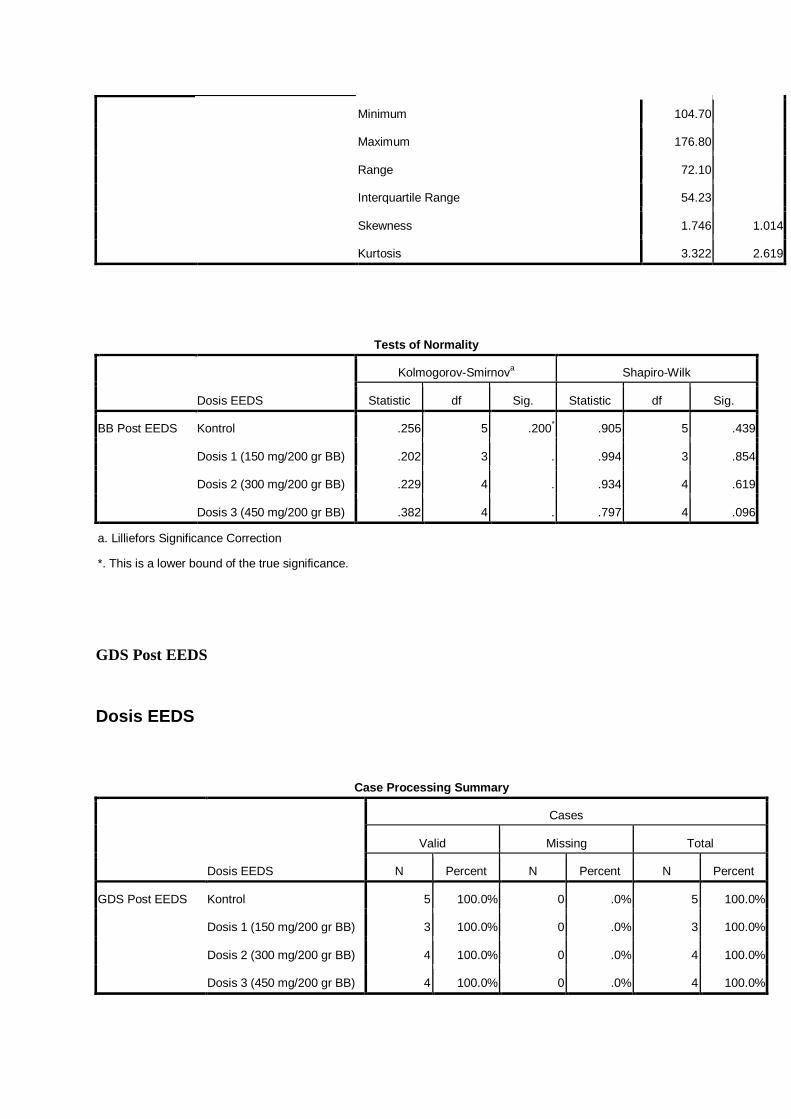
Minimum 104.70
Maximum 176.80
Range 72.10
Interquartile Range 54.23
Skewness 1.746 1.014
Kurtosis 3.322 2.619
Tests of Normality
Dosis EEDS
Kolmogorov-Smirnova Shapiro-Wilk
Statistic df Sig. Statistic df Sig.
BB Post EEDS Kontrol .256 5 .200* .905 5 .439
Dosis 1 (150 mg/200 gr BB) .202 3 . .994 3 .854
Dosis 2 (300 mg/200 gr BB) .229 4 . .934 4 .619
Dosis 3 (450 mg/200 gr BB) .382 4 . .797 4 .096
a. Lilliefors Significance Correction
*. This is a lower bound of the true significance.
GDS Post EEDS
Dosis EEDS
Case Processing Summary
Dosis EEDS
Cases
Valid Missing Total
N Percent N Percent N Percent
GDS Post EEDS Kontrol 5 100.0% 0 .0% 5 100.0%
Dosis 1 (150 mg/200 gr BB) 3 100.0% 0 .0% 3 100.0%
Dosis 2 (300 mg/200 gr BB) 4 100.0% 0 .0% 4 100.0%
Dosis 3 (450 mg/200 gr BB) 4 100.0% 0 .0% 4 100.0%
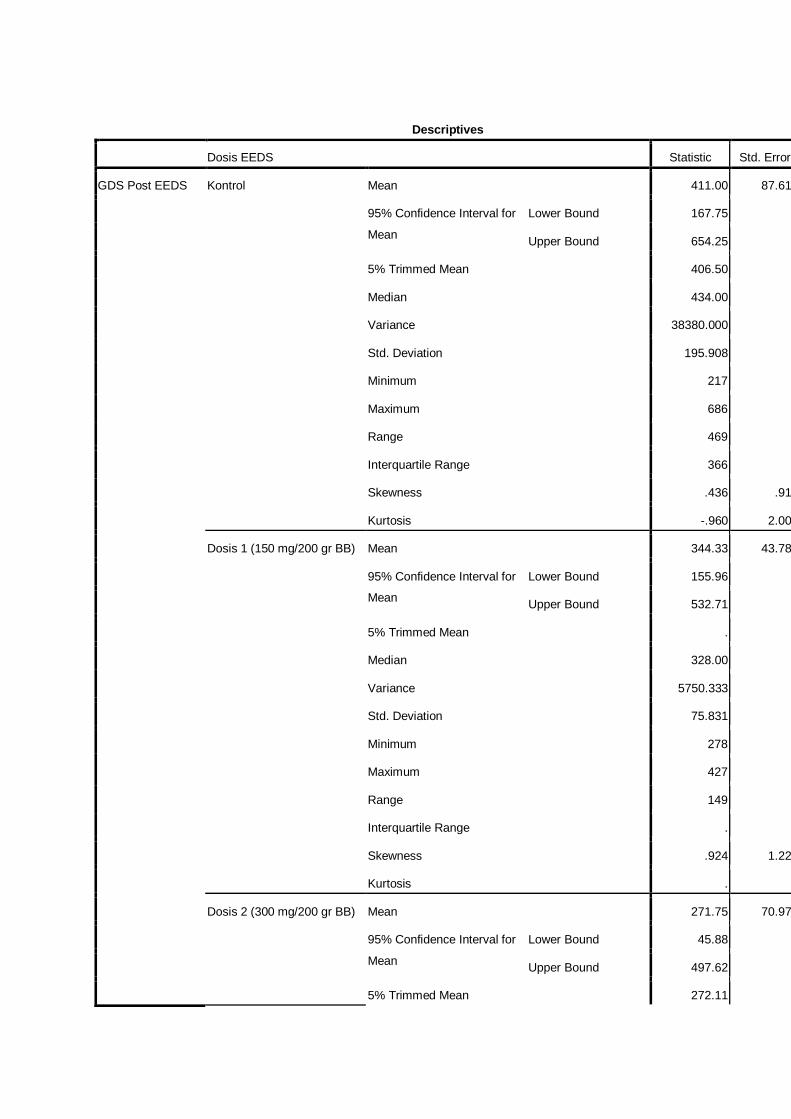
Descriptives
Dosis EEDS Statistic Std. Error
GDS Post EEDS Kontrol Mean 411.00 87.613
95% Confidence Interval for
Mean
Lower Bound 167.75
Upper Bound 654.25
5% Trimmed Mean 406.50
Median 434.00
Variance 38380.000
Std. Deviation 195.908
Minimum 217
Maximum 686
Range 469
Interquartile Range 366
Skewness .436 .913
Kurtosis -.960 2.000
Dosis 1 (150 mg/200 gr BB) Mean 344.33 43.781
95% Confidence Interval for
Mean
Lower Bound 155.96
Upper Bound 532.71
5% Trimmed Mean .
Median 328.00
Variance 5750.333
Std. Deviation 75.831
Minimum 278
Maximum 427
Range 149
Interquartile Range .
Skewness .924 1.225
Kurtosis .
Dosis 2 (300 mg/200 gr BB) Mean 271.75 70.972
95% Confidence Interval for
Mean
Lower Bound 45.88
Upper Bound 497.62
5% Trimmed Mean 272.11
Median 275.00
Variance 20148.250
Std. Deviation 141.945
Minimum 140
Maximum 397
Range 257
Interquartile Range 251
Skewness -.013 1.014
Kurtosis -5.914 2.619
Dosis 3 (450 mg/200 gr BB) Mean 286.25 66.878
95% Confidence Interval for
Mean
Lower Bound 73.41
Upper Bound 499.09
5% Trimmed Mean 286.78
Median 291.00
Variance 17890.917
Std. Deviation 133.757
Minimum 135
Maximum 428
Range 293
Interquartile Range 256
Skewness -.128 1.014
Kurtosis -3.239 2.619
Tests of Normality
Dosis EEDS
Kolmogorov-Smirnova Shapiro-Wilk
Statistic df Sig. Statistic df Sig.
GDS Post EEDS Kontrol .225 5 .200* .916 5 .503
Dosis 1 (150 mg/200 gr BB) .252 3 . .965 3 .642
Dosis 2 (300 mg/200 gr BB) .302 4 . .769 4 .057
Dosis 3 (450 mg/200 gr BB) .219 4 . .949 4 .708
a. Lilliefors Significance Correction
*. This is a lower bound of the true significance.
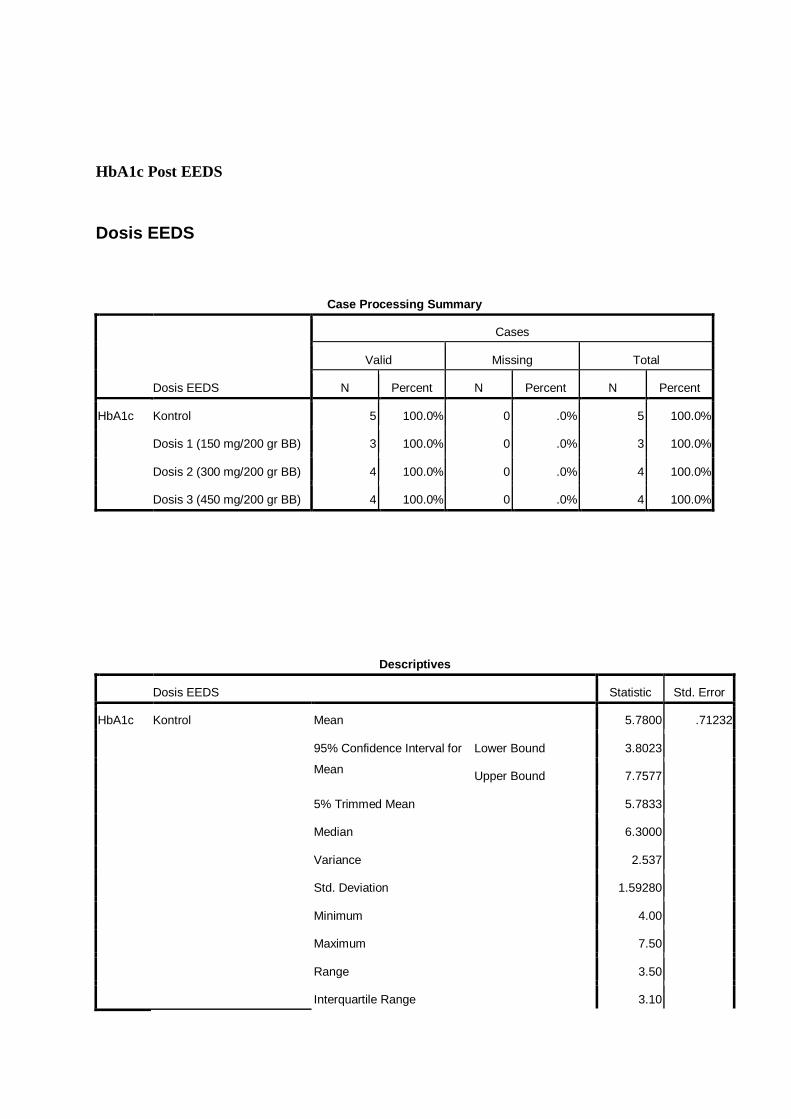
HbA1c Post EEDS
Dosis EEDS
Case Processing Summary
Dosis EEDS
Cases
Valid Missing Total
N Percent N Percent N Percent
HbA1c Kontrol 5 100.0% 0 .0% 5 100.0%
Dosis 1 (150 mg/200 gr BB) 3 100.0% 0 .0% 3 100.0%
Dosis 2 (300 mg/200 gr BB) 4 100.0% 0 .0% 4 100.0%
Dosis 3 (450 mg/200 gr BB) 4 100.0% 0 .0% 4 100.0%
Descriptives
Dosis EEDS Statistic Std. Error
HbA1c Kontrol Mean 5.7800 .71232
95% Confidence Interval for
Mean
Lower Bound 3.8023
Upper Bound 7.7577
5% Trimmed Mean 5.7833
Median 6.3000
Variance 2.537
Std. Deviation 1.59280
Minimum 4.00
Maximum 7.50
Range 3.50
Interquartile Range 3.10
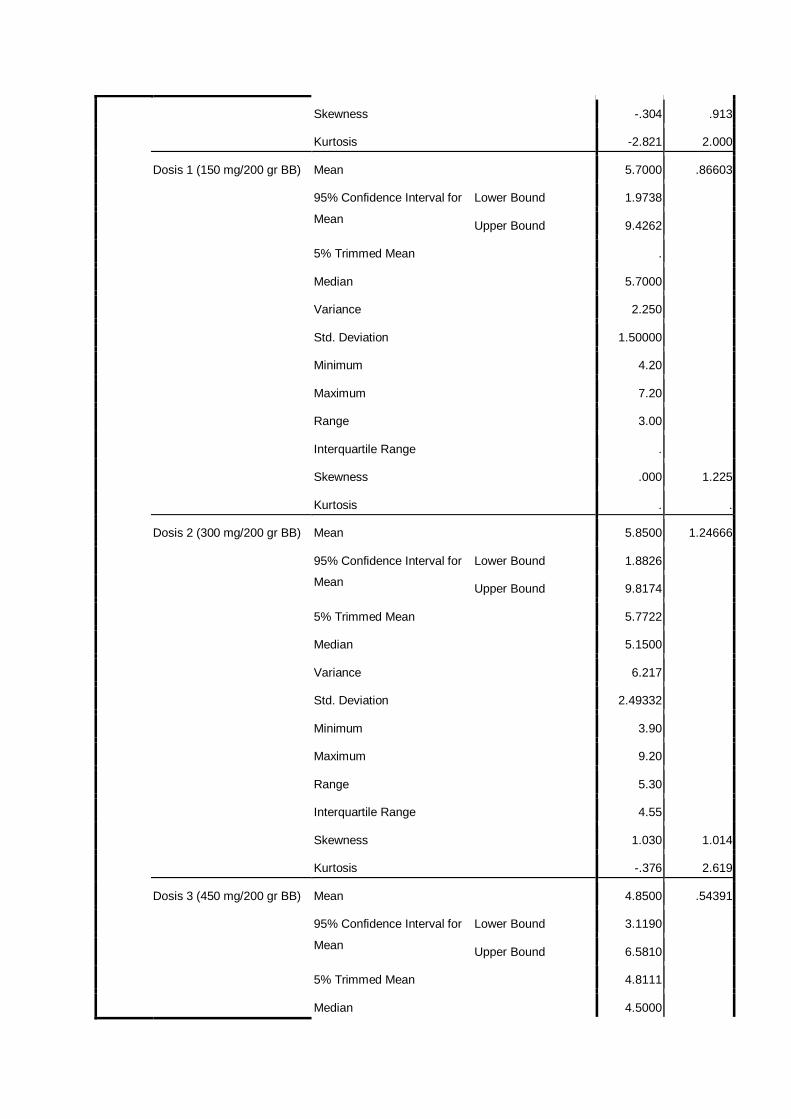
Skewness -.304 .913
Kurtosis -2.821 2.000
Dosis 1 (150 mg/200 gr BB) Mean 5.7000 .86603
95% Confidence Interval for
Mean
Lower Bound 1.9738
Upper Bound 9.4262
5% Trimmed Mean .
Median 5.7000
Variance 2.250
Std. Deviation 1.50000
Minimum 4.20
Maximum 7.20
Range 3.00
Interquartile Range .
Skewness .000 1.225
Kurtosis . .
Dosis 2 (300 mg/200 gr BB) Mean 5.8500 1.24666
95% Confidence Interval for
Mean
Lower Bound 1.8826
Upper Bound 9.8174
5% Trimmed Mean 5.7722
Median 5.1500
Variance 6.217
Std. Deviation 2.49332
Minimum 3.90
Maximum 9.20
Range 5.30
Interquartile Range 4.55
Skewness 1.030 1.014
Kurtosis -.376 2.619
Dosis 3 (450 mg/200 gr BB) Mean 4.8500 .54391
95% Confidence Interval for
Mean
Lower Bound 3.1190
Upper Bound 6.5810
5% Trimmed Mean 4.8111
Median 4.5000
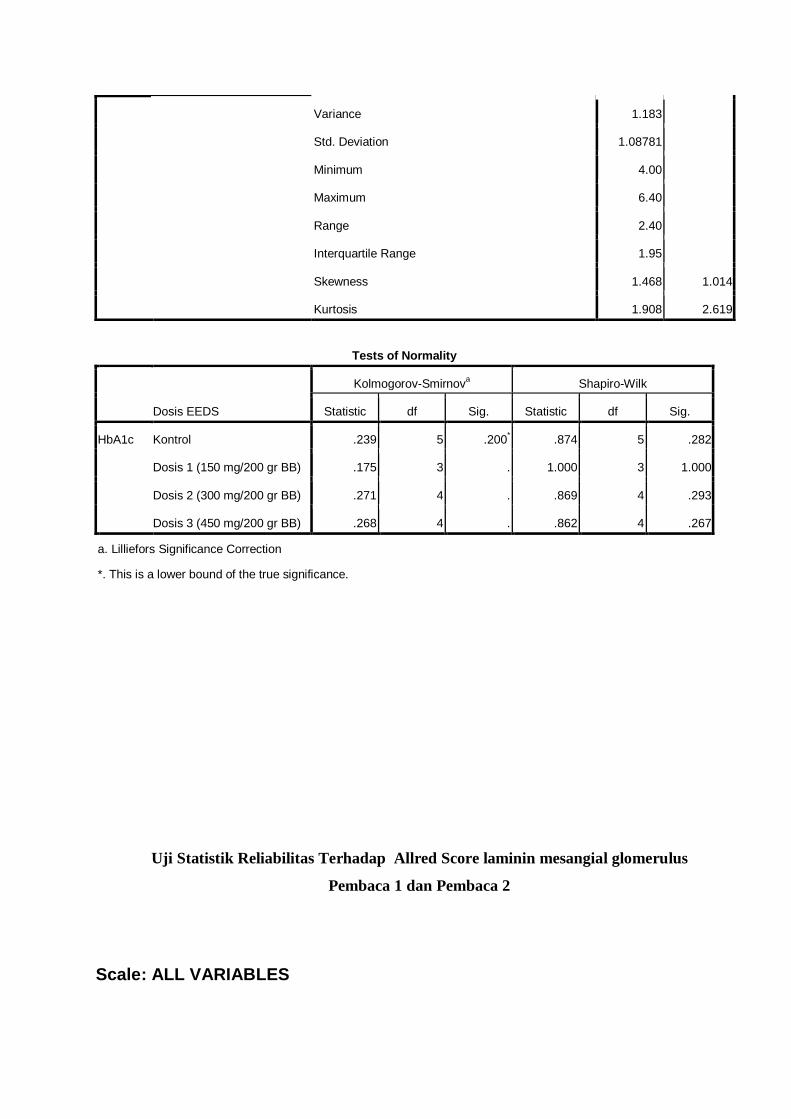
Variance 1.183
Std. Deviation 1.08781
Minimum 4.00
Maximum 6.40
Range 2.40
Interquartile Range 1.95
Skewness 1.468 1.014
Kurtosis 1.908 2.619
Tests of Normality
Dosis EEDS
Kolmogorov-Smirnova Shapiro-Wilk
Statistic df Sig. Statistic df Sig.
HbA1c Kontrol .239 5 .200* .874 5 .282
Dosis 1 (150 mg/200 gr BB) .175 3 . 1.000 3 1.000
Dosis 2 (300 mg/200 gr BB) .271 4 . .869 4 .293
Dosis 3 (450 mg/200 gr BB) .268 4 . .862 4 .267
a. Lilliefors Significance Correction
*. This is a lower bound of the true significance.
Uji Statistik Reliabilitas Terhadap Allred Score laminin mesangial glomerulus
Pembaca 1 dan Pembaca 2
Scale: ALL VARIABLES
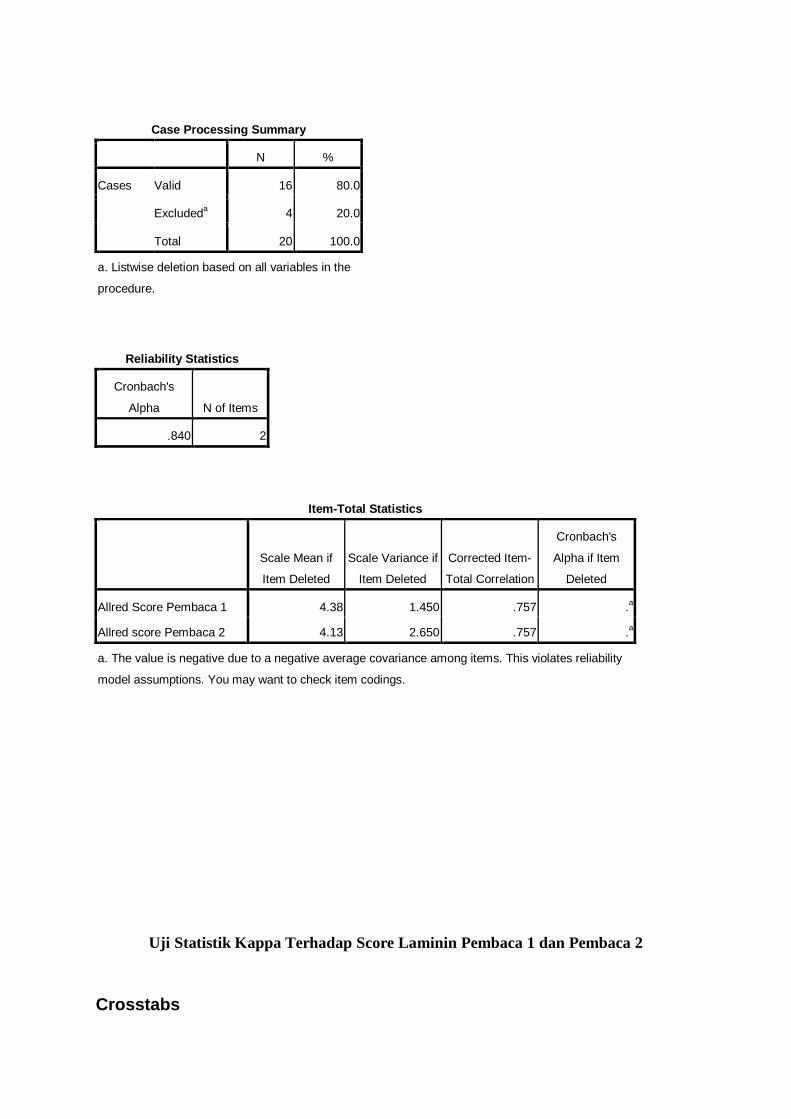
Case Processing Summary
N %
Cases Valid 16 80.0
Excludeda 4 20.0
Total 20 100.0
a. Listwise deletion based on all variables in the
procedure.
Reliability Statistics
Cronbach's
Alpha N of Items
.840 2
Item-Total Statistics
Scale Mean if
Item Deleted
Scale Variance if
Item Deleted
Corrected Item-
Total Correlation
Cronbach's
Alpha if Item
Deleted
Allred Score Pembaca 1 4.38 1.450 .757 .a
Allred score Pembaca 2 4.13 2.650 .757 .a
a. The value is negative due to a negative average covariance among items. This violates reliability
model assumptions. You may want to check item codings.
Uji Statistik Kappa Terhadap Score Laminin Pembaca 1 dan Pembaca 2
Crosstabs
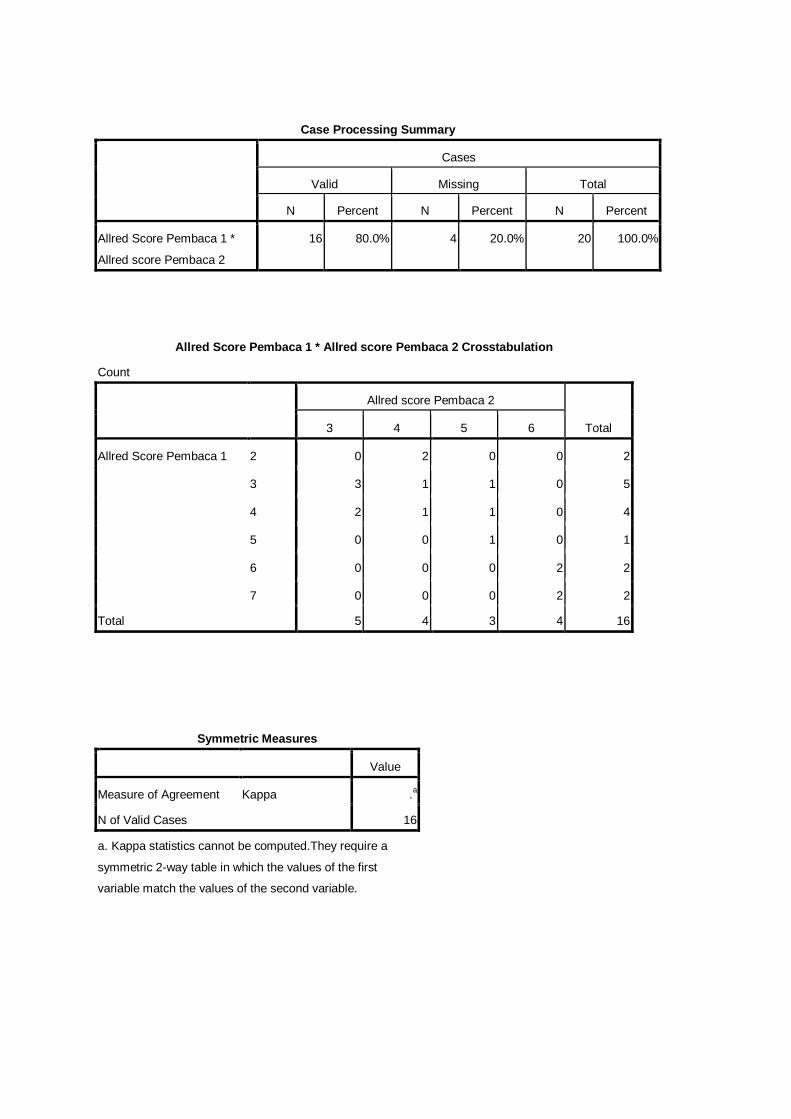
Case Processing Summary
Cases
Valid Missing Total
N Percent N Percent N Percent
Allred Score Pembaca 1 *
Allred score Pembaca 2
16 80.0% 4 20.0% 20 100.0%
Allred Score Pembaca 1 * Allred score Pembaca 2 Crosstabulation
Count
Allred score Pembaca 2
Total 3 4 5 6
Allred Score Pembaca 1 2 0 2 0 0 2
3 3 1 1 0 5
4 2 1 1 0 4
5 0 0 1 0 1
6 0 0 0 2 2
7 0 0 0 2 2
Total 5 4 3 4 16
Symmetric Measures
Value
Measure of Agreement Kappa .a
N of Valid Cases 16
a. Kappa statistics cannot be computed.They require a
symmetric 2-way table in which the values of the first
variable match the values of the second variable.
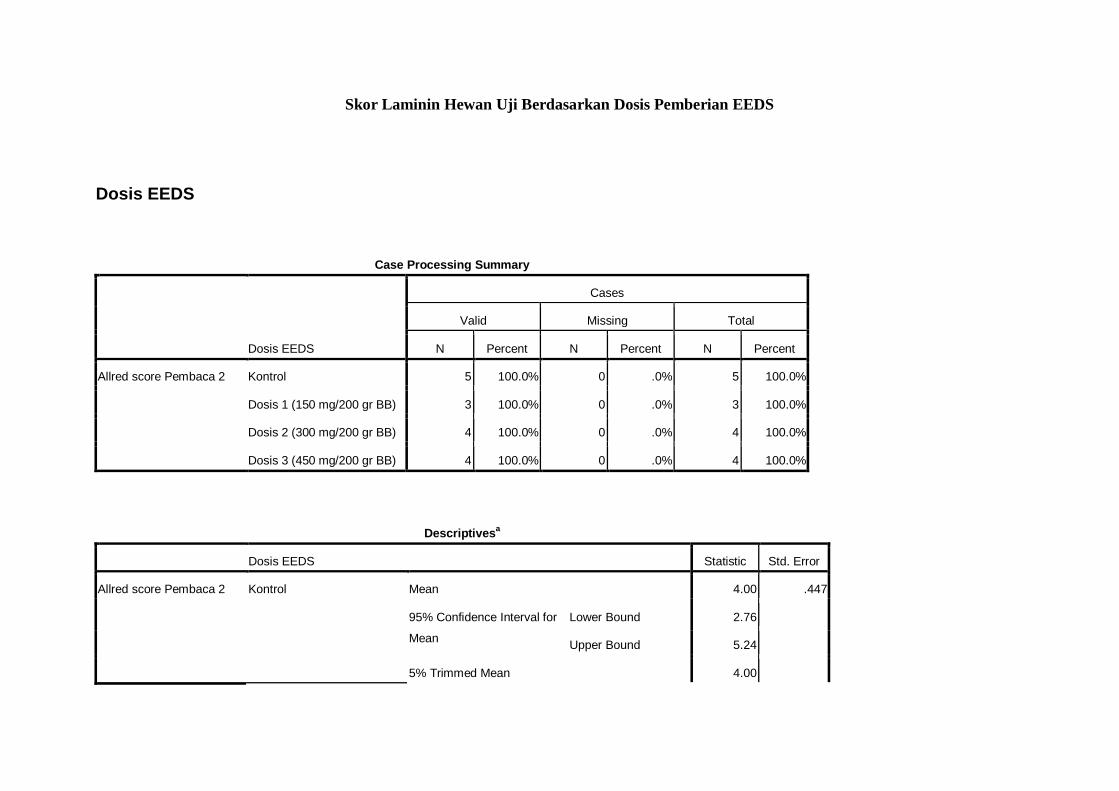
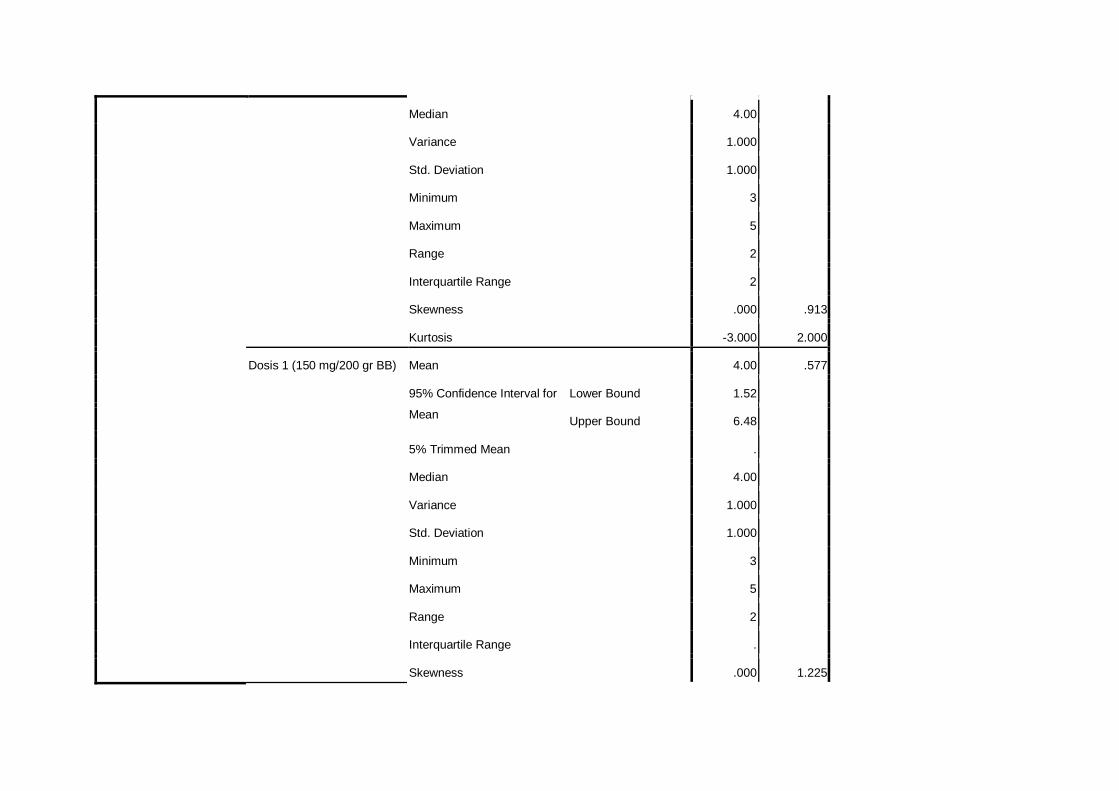
Skor Laminin Hewan Uji Berdasarkan Dosis Pemberian EEDS
Dosis EEDS
Case Processing Summary
Dosis EEDS
Cases
Valid Missing Total
N Percent N Percent N Percent
Allred score Pembaca 2 Kontrol 5 100.0% 0 .0% 5 100.0%
Dosis 1 (150 mg/200 gr BB) 3 100.0% 0 .0% 3 100.0%
Dosis 2 (300 mg/200 gr BB) 4 100.0% 0 .0% 4 100.0%
Dosis 3 (450 mg/200 gr BB) 4 100.0% 0 .0% 4 100.0%
Descriptivesa
Dosis EEDS Statistic Std. Error
Allred score Pembaca 2 Kontrol Mean 4.00 .447
95% Confidence Interval for
Mean
Lower Bound 2.76
Upper Bound 5.24
5% Trimmed Mean 4.00
Median 4.00
Variance 1.000
Std. Deviation 1.000
Minimum 3
Maximum 5
Range 2
Interquartile Range 2
Skewness .000 .913
Kurtosis -3.000 2.000
Dosis 1 (150 mg/200 gr BB) Mean 4.00 .577
95% Confidence Interval for
Mean
Lower Bound 1.52
Upper Bound 6.48
5% Trimmed Mean .
Median 4.00
Variance 1.000
Std. Deviation 1.000
Minimum 3
Maximum 5
Range 2
Interquartile Range .
Skewness .000 1.225
Kurtosis . .
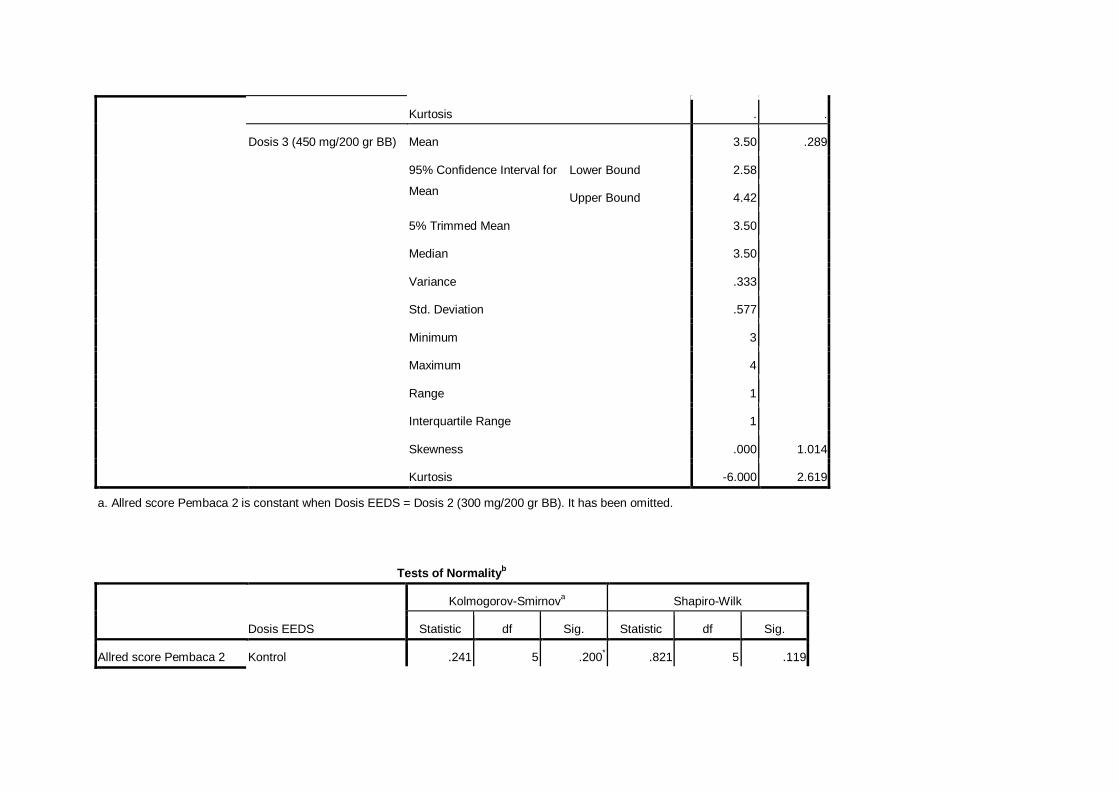
Dosis 3 (450 mg/200 gr BB) Mean 3.50 .289
95% Confidence Interval for
Mean
Lower Bound 2.58
Upper Bound 4.42
5% Trimmed Mean 3.50
Median 3.50
Variance .333
Std. Deviation .577
Minimum 3
Maximum 4
Range 1
Interquartile Range 1
Skewness .000 1.014
Kurtosis -6.000 2.619
a. Allred score Pembaca 2 is constant when Dosis EEDS = Dosis 2 (300 mg/200 gr BB). It has been omitted.
Tests of Normalityb
Dosis EEDS
Kolmogorov-Smirnova Shapiro-Wilk
Statistic df Sig. Statistic df Sig.
Allred score Pembaca 2 Kontrol .241 5 .200* .821 5 .119
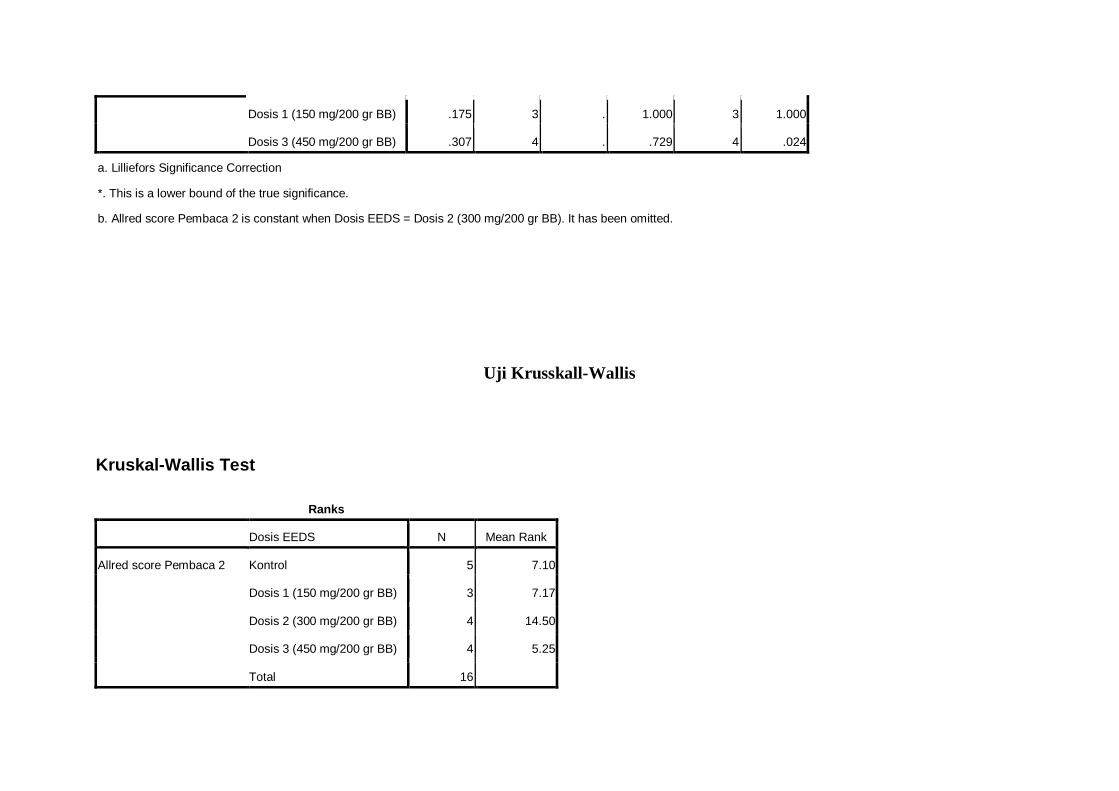
Dosis 1 (150 mg/200 gr BB) .175 3 . 1.000 3 1.000
Dosis 3 (450 mg/200 gr BB) .307 4 . .729 4 .024
a. Lilliefors Significance Correction
*. This is a lower bound of the true significance.
b. Allred score Pembaca 2 is constant when Dosis EEDS = Dosis 2 (300 mg/200 gr BB). It has been omitted.
Uji Krusskall-Wallis
Kruskal-Wallis Test
Ranks
Dosis EEDS N Mean Rank
Allred score Pembaca 2 Kontrol 5 7.10
Dosis 1 (150 mg/200 gr BB) 3 7.17
Dosis 2 (300 mg/200 gr BB) 4 14.50
Dosis 3 (450 mg/200 gr BB) 4 5.25
Total 16
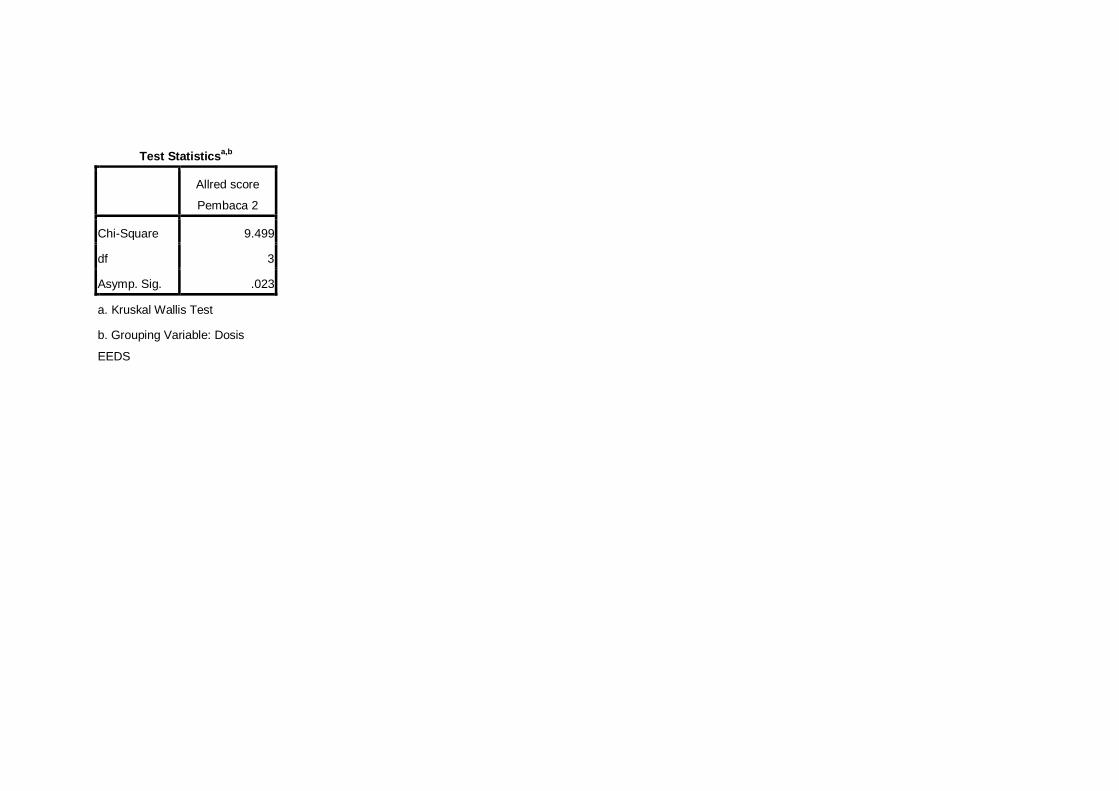
Test Statisticsa,b
Allred score
Pembaca 2
Chi-Square 9.499
df 3
Asymp. Sig. .023
a. Kruskal Wallis Test
b. Grouping Variable: Dosis
EEDS
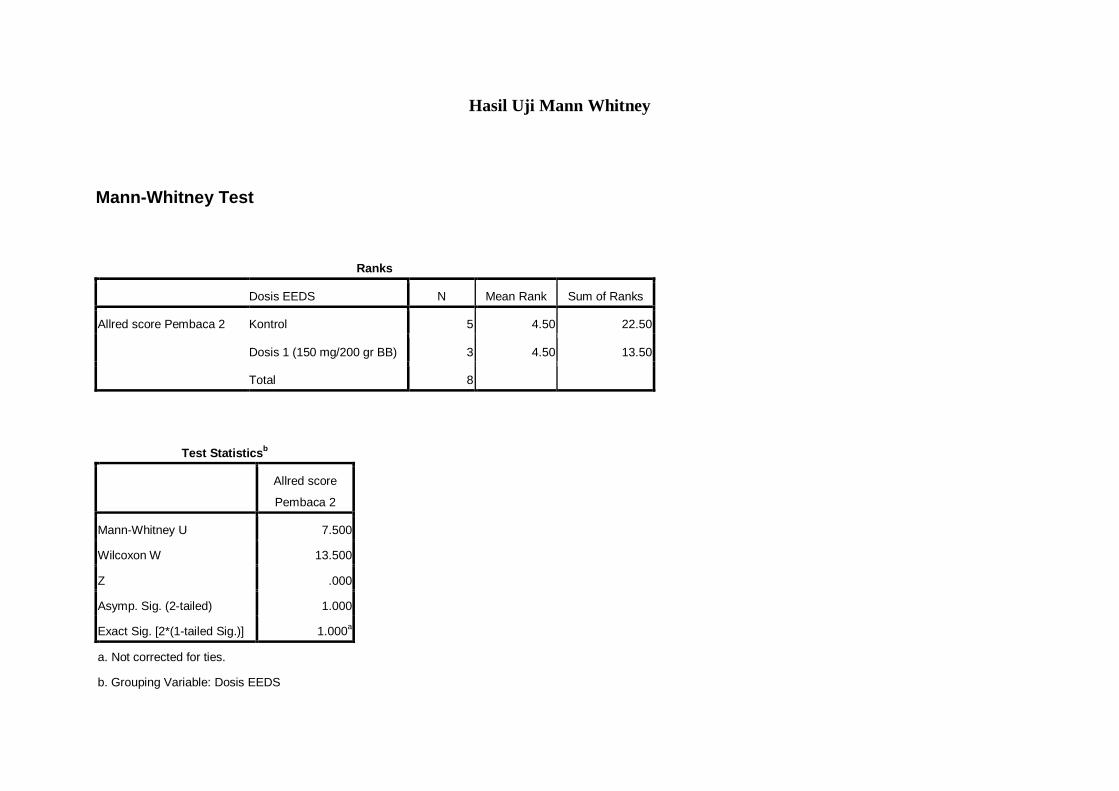
Hasil Uji Mann Whitney
Mann-Whitney Test
Ranks
Dosis EEDS N Mean Rank Sum of Ranks
Allred score Pembaca 2 Kontrol 5 4.50 22.50
Dosis 1 (150 mg/200 gr BB) 3 4.50 13.50
Total 8
Test Statisticsb
Allred score
Pembaca 2
Mann-Whitney U 7.500
Wilcoxon W 13.500
Z .000
Asymp. Sig. (2-tailed) 1.000
Exact Sig. [2*(1-tailed Sig.)] 1.000a
a. Not corrected for ties.
b. Grouping Variable: Dosis EEDS
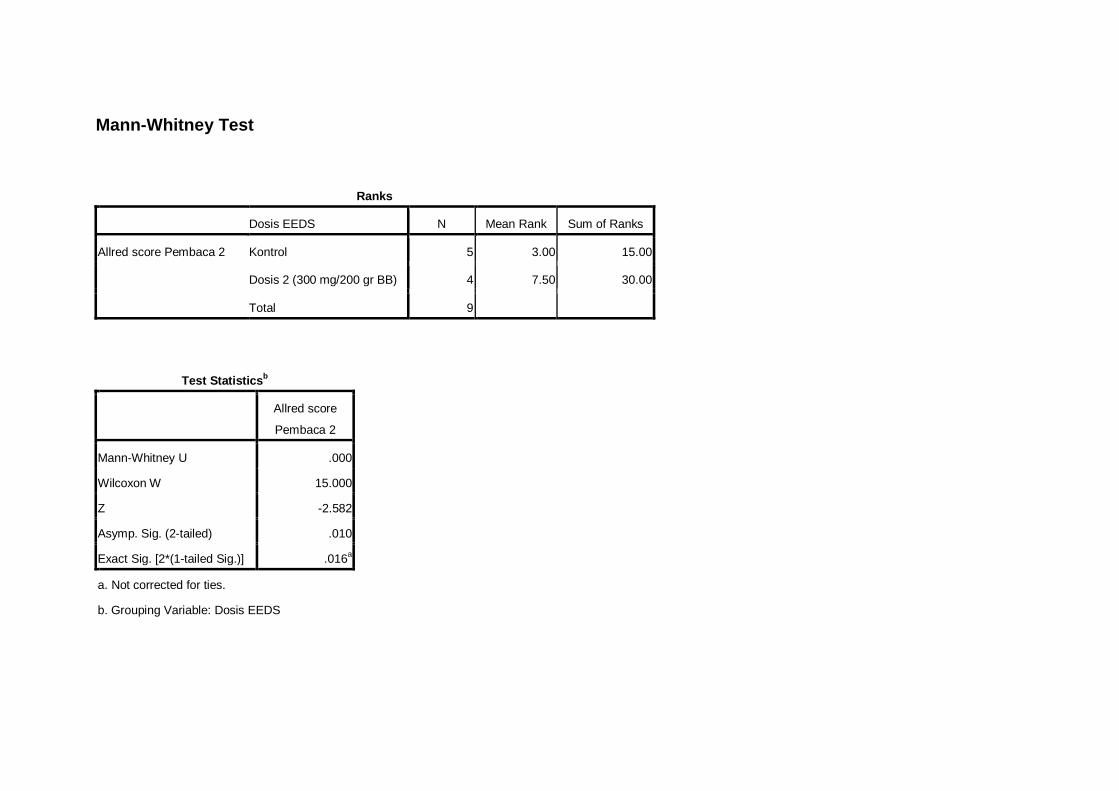
Mann-Whitney Test
Ranks
Dosis EEDS N Mean Rank Sum of Ranks
Allred score Pembaca 2 Kontrol 5 3.00 15.00
Dosis 2 (300 mg/200 gr BB) 4 7.50 30.00
Total 9
Test Statisticsb
Allred score
Pembaca 2
Mann-Whitney U .000
Wilcoxon W 15.000
Z -2.582
Asymp. Sig. (2-tailed) .010
Exact Sig. [2*(1-tailed Sig.)] .016a
a. Not corrected for ties.
b. Grouping Variable: Dosis EEDS
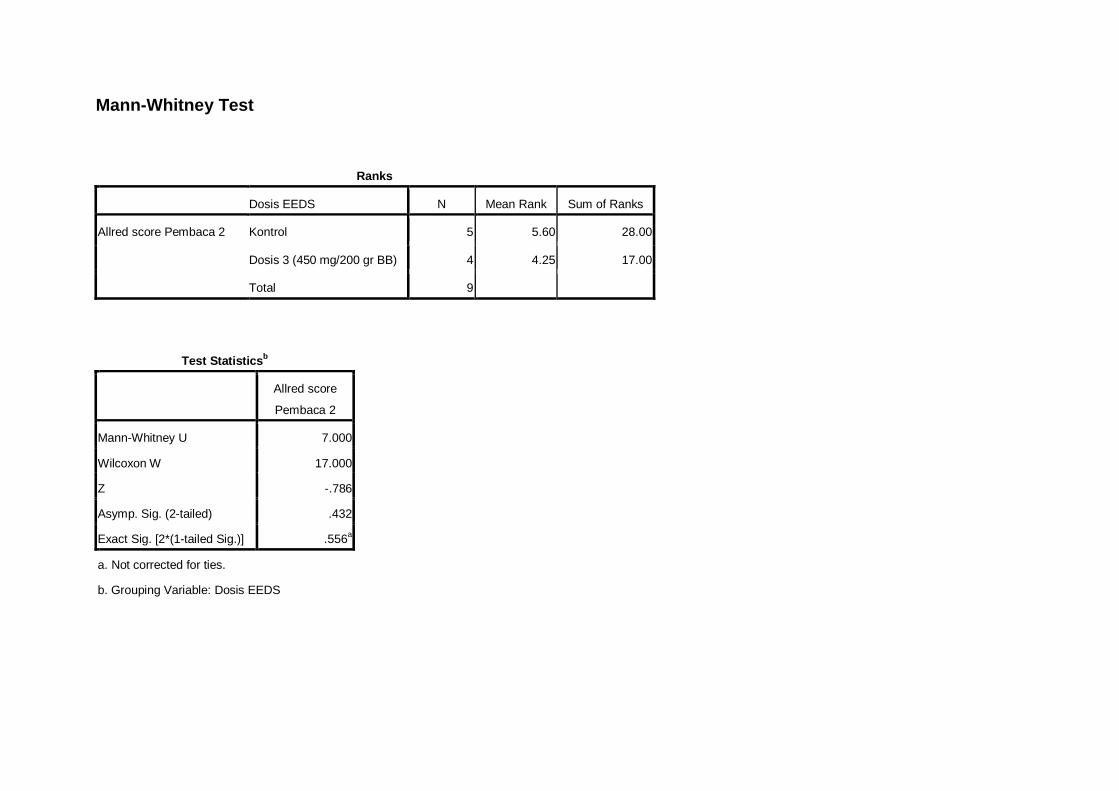
Mann-Whitney Test
Ranks
Dosis EEDS N Mean Rank Sum of Ranks
Allred score Pembaca 2 Kontrol 5 5.60 28.00
Dosis 3 (450 mg/200 gr BB) 4 4.25 17.00
Total 9
Test Statisticsb
Allred score
Pembaca 2
Mann-Whitney U 7.000
Wilcoxon W 17.000
Z -.786
Asymp. Sig. (2-tailed) .432
Exact Sig. [2*(1-tailed Sig.)] .556a
a. Not corrected for ties.
b. Grouping Variable: Dosis EEDS
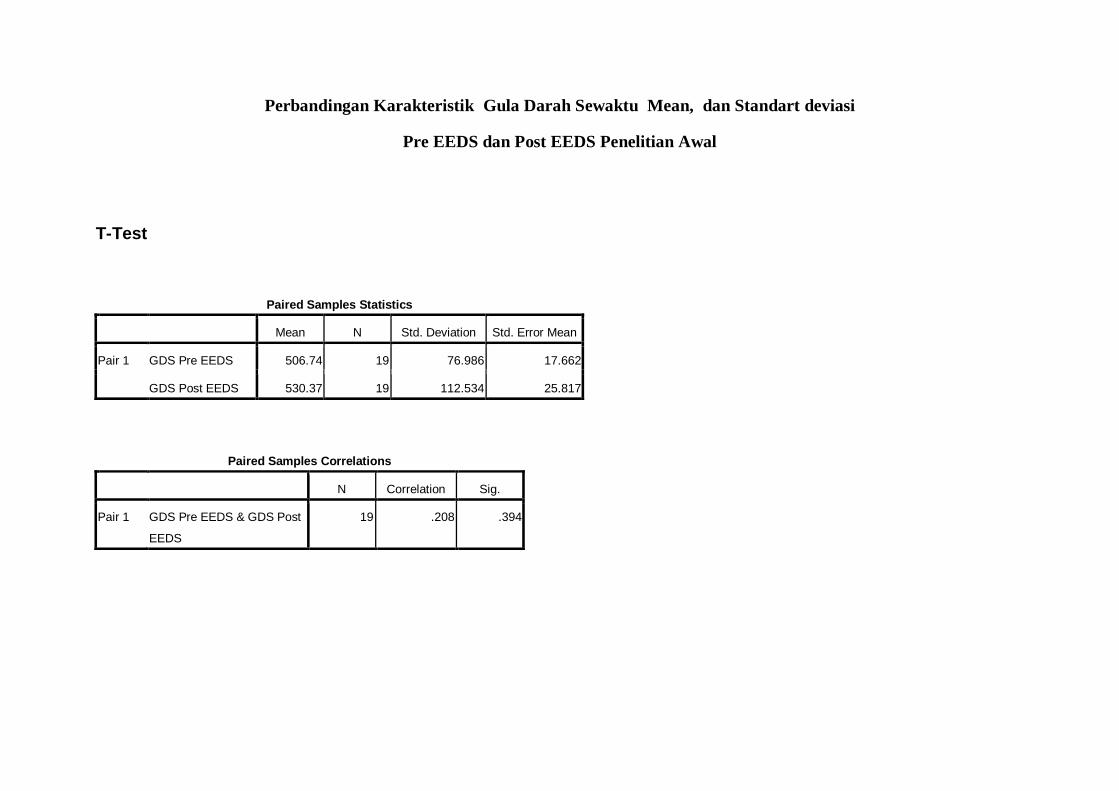
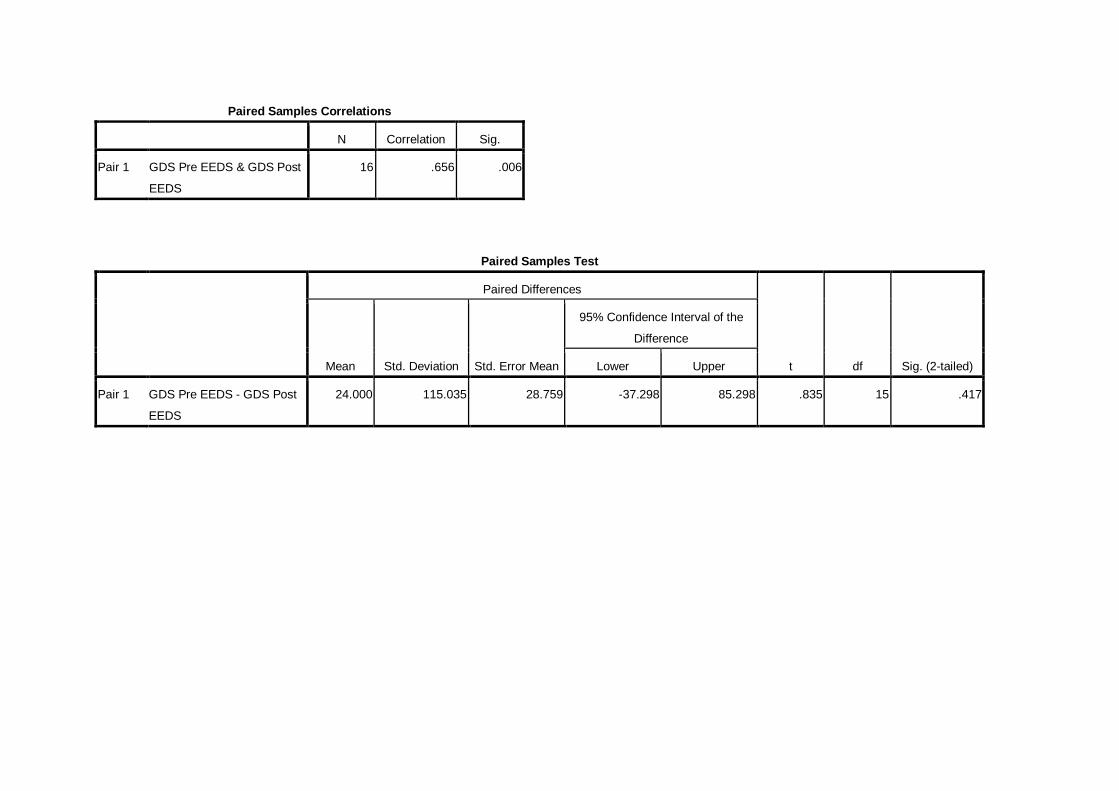
Perbandingan Karakteristik Gula Darah Sewaktu Mean, dan Standart deviasi
Pre EEDS dan Post EEDS Penelitian Awal
T-Test
Paired Samples Statistics
Mean N Std. Deviation Std. Error Mean
Pair 1 GDS Pre EEDS 506.74 19 76.986 17.662
GDS Post EEDS 530.37 19 112.534 25.817
Paired Samples Correlations
N Correlation Sig.
Pair 1 GDS Pre EEDS & GDS Post
EEDS
19 .208 .394
Paired Samples Test
Paired Differences
t df Sig. (2-tailed)
Mean Std. Deviation Std. Error Mean
95% Confidence Interval of the
Difference
Lower Upper
Pair 1 GDS Pre EEDS - GDS Post
EEDS
-23.632 122.455 28.093 -82.653 35.390 -.841 18 .411
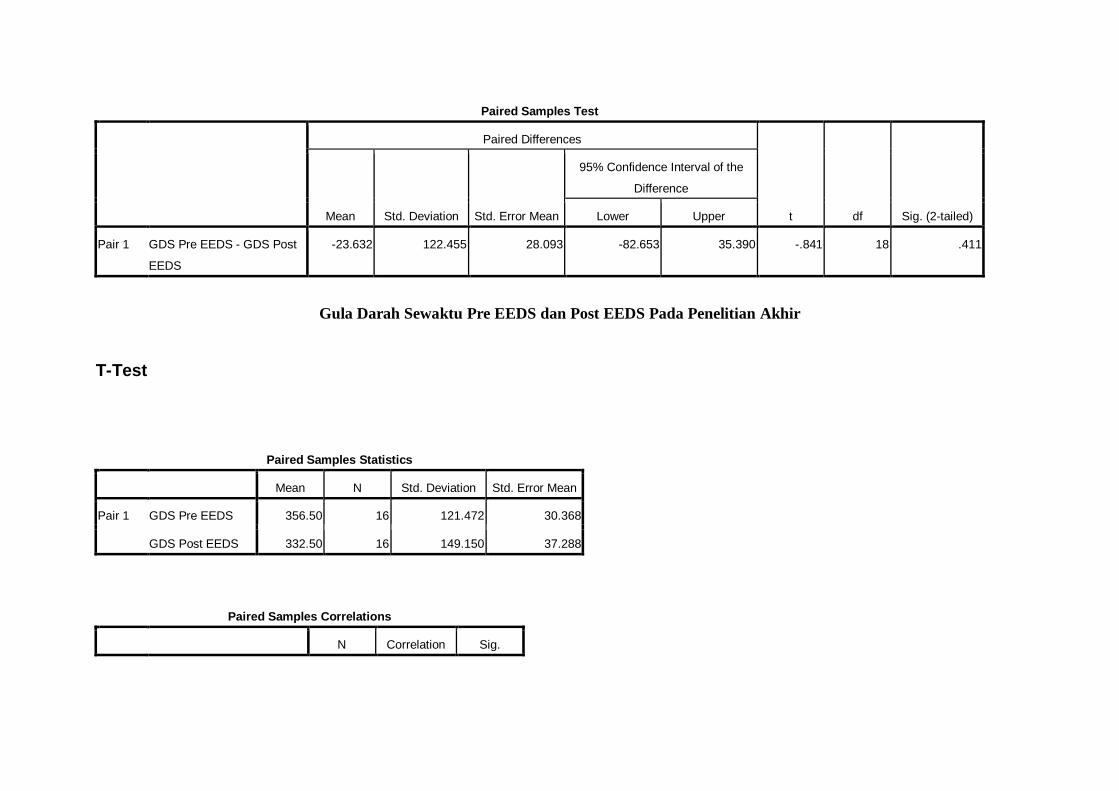
Gula Darah Sewaktu Pre EEDS dan Post EEDS Pada Penelitian Akhir
T-Test
Paired Samples Statistics
Mean N Std. Deviation Std. Error Mean
Pair 1 GDS Pre EEDS 356.50 16 121.472 30.368
GDS Post EEDS 332.50 16 149.150 37.288
Paired Samples Correlations
N Correlation Sig.
Paired Samples Correlations
N Correlation Sig.
Pair 1 GDS Pre EEDS & GDS Post
EEDS
16 .656 .006
Paired Samples Test
Paired Differences
t df Sig. (2-tailed)
Mean Std. Deviation Std. Error Mean
95% Confidence Interval of the
Difference
Lower Upper
Pair 1 GDS Pre EEDS - GDS Post
EEDS
24.000 115.035 28.759 -37.298 85.298 .835 15 .417
Lampiran 11