bab v simpulan dan saran 5.1 simpulan - …repository.wima.ac.id/9813/6/bab 5.pdf · sediaan yaitu...
TRANSCRIPT
130
BAB V
SIMPULAN DAN SARAN
5.1 Simpulan
1. Formula sabun transparan yang memberikan aktivitas antioksidan
tertinggi adalah formula 3 yang mengandung ekstrak labu kuning
sebanyak 20% dengan aktivitas antioksidan sebesar 169,91%
2. Peningkatan konsentrasi perasan/sari buah labu kuning (Cucurbita
moschata) (2%, 10% dan 20%) berpengaruh pada mutu fisik
sediaan yaitu pH, kadar air, jumlah asam lemak, kadar alkali/asam
lemak bebas dan lemak tak tersabunkan serta efektivitas sediaan
yaitu aksi pembersihan, stabilitas dan tinggi busa serta aktivitas
antioksidan yang dihasilkan.
5.2 Saran
Pada penelitian selanjutnya disarankan untuk menambahkan
surfaktan penstabil busa, misalnya Cocamid DEA untuk meningkatkan
stabilitas busa sehingga dapat bertahan lebih lama serta melakukan uji
stabilitas terhadap kadar air sediaan selama penyimpanan. Selain itu dapat
digunakan pengalkali/basa lain dalam pembuatan sabun seperti TEA
sehingga pH sediaan tidak terlalu tinggi.
131
DAFTAR PUSTAKA
Aalbersberg, B. 1991, ‘Carotene analysis’, New Zealand Institute for Crop
& Food Research, Proceedings of the 3rd OCEANIAFOODS
Conference, Auckland, New Zealand, pp. 91-114.
Aarti, S. and Mohile, R. B. 2003, ‘Effect of mineral oil, sunflower oil, and
coconut oil on prevention of hair damage’, Journal of Cosmetic
Science, 54:173-192.
Abdalla, A. E. and Roozen, J. P. 1999, ‘Effect of plant extracts on the oxidative stability of sunflower oil and emulsion’, Food Chemistry,
64:323-329.
Achmad, R. 2004, Kimia Lingkungan, Universitas Negeri Jakarta, Jakarta,
hal. 111.
Adams, G. G., Imran, S., Wang, S., Mohammad, A., Kok, S., Gray, D. A.,
Channell, G. A., Morris, G. A. and Harding, S. E. 2011, ‘The
hypoglycemic effect of pumpkins as anti-diabetic and functional
medicines’, Food Research International, 44:862-867.
Adams, R. 1999, ’Laundry bars and detergent pastes: worldwide outlook’,
Detergents Congresses, Proceedings of the 4th World Conference
on Detergents: Strategies for the 21st Century, Cahn, A. (ed.), Montreux, Switzerland, p. 119.
Adlhani, E. 2014, ‘Penapisan kandungan fitokimia pada buah labu kuning’,
Jurnal Teknologi dan Industri, 3(1):11-16.
Agero, A. L. and Verallo-Rowell, V. M. 2004, ‘A randomized double-blind
controlled trial comparing extra virgin coconut oil with mineral oil
as a moisturizer for mild to moderate xerosis’, Dermatitis,
15(3):109-116
Agustian, R., Yudiati, E. dan Sedjati, S. 2013, ‘Uji toksisitas ekstrak
pigmen kasar mikroalga Spirulina platensis dengan metode uji
BSLT (Brine Shrimp Lethality Test)’, Journal of Marine Research,
2(1):25-31.

132
Alam, M. N., Bristi, N. J. and Rafiquzzaman, M. 2012, ‘Review on in vivo
and in vitro methods evaluation of antioxidant activity’, Saudi
Pharmaceutical Journal, 21:143-152.
Andi. 2005, Virgin Coconut Oil, Cetakan I, Agromedia Pustaka, Tangerang.
Andriani, K. 2014, ‘Pengaruh suhu dan waktu penyimpanan terhadap
perubahan warna, kekuatan parfum, kadar air, alkali bebas, asam
lemak bebas dan bilangan peroksida pada sabun mandi dan sabun
cuci padat’, Skripsi, Sarjana Teknik Kimia, Universitas Sumatera
Utara, Medan.
Anggraini, T., Ismanto, S. D. and Dahlia. 2015, ‘The making of transparent
soap from green tea extract’, International Journal on Advanced
Science Engineering Information Technology, 5(4):349-356.
Antille, C., Tran, C., Sorg, O., Saurat, J. H. 2004, ‘Topical β-carotene is
converted toretinyl esters in human skin ex vivo and mouse skin in
vivo’, 13:558-561.
Antolovich, M., Prenzel, P. D., Patsalides, E., McDonalds, S., Robards, K.
2002, ‘Methods for testing antioxidant activity’, Analyst, 127:183-
198.
Asian and Pacific Coconut Community (APCC). 2007, Standard for virgin
coconut oil.
Atmoko, Y. D. 2005, ‘Kajian penambahan ekstrak mentimun (Cucumis satibus L.) terhadap karakteristik sabun mandi opaque, Skripsi,
Sarjana Teknologi Pertanian, Institut Pertanian Bogor, Bogor.
Azizah, A. H., Wee, K. C., Azizah, O., Azizah, M. 2009, ‘Effect of boiling
and stir frying on total phenolics, carotenoids and radical
scavenging activity of pumpkin (Cucurbita moschata)’,
International Food Research Journal, 16:45-51.
Badan Pengawas Obat dan Makanan Republik Indonesia (BPOM RI). 2012,
Pedoman Teknologi Formulasi Sediaan Berbasis Ekstrak, BPOM
RI, Jakarta.
133
Badan Standardisasi Nasional (BSN). 1994, Standar Nasional Indonesia
(SNI): Sabun Mandi, Badan Standardisasi Nasional, Jakarta.
Backer, C. A. and Brick. R. C. B. Van de. 1963, Flora of Java, volume I,
Gronigen, P. Noordhoff.
Barel, A. O., Paye, M. and Maibach, H. I. 2009, Handbook of Cosmetic
Science and Technology, 3rd ed., Informa Health Care Inc, New
York.
Barja, G. 2002, ‘Endogenous oxidative stress: relationship to aging,
longevity and caloric restriction’, Ageing Research Reviewes, 1:97-111.
Beveridge, T. and Rao, M. A. 2009, ‘Juice extraction from apples and other
fruits andvegetables’, Critical Reviews in Food Science and
Nutrition, 37(5):449-469.
Biesiada, A., Nawirska, A., Kucharska, A. and Sokoletowska, A. 1962,
‘Chemical composition of pumpkin fruit depending on cultivar and
storage’, Ecological Chemistry and Engineering, 18:9-18.
Boiteux, L. S., Nascimento, W. M., Fonseca, M. E. N., Lana, M. M., Reis,
A., Mendoca, J. L., Lopes, J. F., Reifscheiderf, J. B. 2007,
‘Brasileirinha: pumpkin cultivar (Cucurbita moschata) of bicolor
fruit with ornamental value and suitability for green consumption’,
Hortic. Brasil., 25:103-106.
Bondi, C. A. M., Marks, J. L., Worblewski, L. B., Raatikainen, H. S.,
Lenox, S. R., Gebhardt, K. E. 2015, ‘Human and environmental
toxicity of sodium lauryl sulfate (SLS): evidence for safe use in
household cleaning products, Environmental Health Insights, 9:27-
32.
Brady, J. E. 1999, Kimia Universitas: Asas dan Struktur, Binarupa Aksara,
Jakarta.
134
Brand-Williams, W., Cuvelier, M. E. and Berset, C. 1995, ‘Use of a free
radical method to evaluate antioxidant activity’, Lebensmittel-
Wissenschaft & Technologie, 28(10:25-30.
Britton, G., Liaaen-Jensen, S. and Pfander, H. 1995, Carotenoids: Isolation
and Analysis, volume 1A, Birkhauser Verlag, Berlin, pp. 81-84.
Brotodjojo, L. C., 2010, Semua Serba Labu Kuning, Gramedia Pustaka Utama, Jakarta.
Butler, H. 1993, ‘Historical Background’ in Butler, H. (ed.) Poucher’s
Perfumes, Cosmetics and Soaps, 9th ed., Chapman & Hall, London.
Camera, E., Mastrofrancesco, A., Fabbri, C., Daubrawa, F., Picardo, M.,
Sies, H. 2009, ‘Astaxanthin, canthaxanthin and beta-carotene
differently affect UVA-induced oxidative damage and expression
of oxidative stress-responsive enzymes’, Clinical and
Experimental Dermatology, 18:222–231.
Cavitch, S. M. 2001, Choosing Your Oils, Properties of Fatty Acids, diakses
pada 15 November 2016,
http://user.silverlink.net/~timer/soapdesign.html.
Cho, S., Lee, D. H., Won C-H., Kim, S. M., Lee, S., Lee, M. J., Chung, J. H. 2010, ‘Differential effects of low-dose and high-dose beta-
carotene supplementation on the signs of photoaging and type I
procollagen gene expression in human skin in vivo’, Dermatology,
221(2):160-171.
Committee for Human Medicinal Products. 2015, Background review for
sodium lauryl sulfate used as an excipient, European Medicines
Agency.
Corazza, M., Lauriola, M. M., Zappaterra, M., Bianchi, A., Virgili, A. 2009,
'Surfactants, skin cleansing protagonists', Review Article.
Cosmetic Ingredient Review (CIR) Expert Panel. 1983, ‘Final report on the
safety assessment of sodium lauryl sulfate and ammonium lauryl sulfate’, Journal of The American College of Toxicology, 2(7):127-
181.
135
Cosmetic Ingredient Review (CIR) Expert Panel. 1987, ‘Final report on the
safety assessment of oleic acid, lauric acid, palmitic acid, myristic
acid, and stearic acid, Journal of The American College of
Toxicology, 6(3):321-401.
Darvin, M. E., Sterry, W., Lademann, J., Vergou, T. 2011, ‘The role of
carotenoids in human skin’, Molecules, 16:10491-10506.
Departemen Kesehatan Republik Indonesia (Depkes RI), 1977, Materia
Medika Indonesia, Cetakan I, Depkes RI, Jakarta.
Departemen Kesehatan Republik Indonesia (Depkes RI), 1979, Farmakope Indonesia, ed. III., Depkes RI, Jakarta.
Departemen Kesehatan Republik Indonesia (Depkes RI), 1985,
Formularium Kosmetika Indonesia, Cetakan I, Depkes RI, Jakarta.
Departemen Kesehatan Republik Indonesia (Depkes RI). 1991, Peraturan
Menteri Kesehatan Republik Indonesia Nomor
140/Menkes/PER/III/1991 tentang Peraturan Pemerintah Wajib
Daftar AlatKesehatan, Kosmetika dan Perbekalan Kesehatan
Rumah Tangga, Depkes RI, Jakarta.
Departemen Kesehatan Republik Indonesia (Depkes RI), 1995, Farmakope
Indonesia, ed. IV., Depkes RI, Jakarta.
Departemen Kesehatan Republik Indonesia (Depkes RI), 2008, Farmakope
Herbal Indonesia, ed. I., Depkes RI, Jakarta.
Departemen Kesehatan Republik Indonesia (Depkes RI), 2014, Farmakope
Indonesia, ed. V., Depkes RI, Jakarta.
Department of Trade and Industry (DTI) Philippines. 2004, Philippines
National Standards.
Direktorat Jenderal Pengawasan Obat dan Makanan Republik Indonesia
(Ditjen POM RI). 2000, Parameter Standar Umum Ekstrak
Tumbuhan Obat, Departemen Kesehatan Republik Indonesia,
Jakarta.
136
Discontinued Beauty. 2013. Sexy Hair Pumpkin Moisture Balance Body
Wash 10.2 oz, diaksespada 25 Januari 2016,
http://www.discontinuedbeauty.com/sexy-hair-concepts/sexy-bath-
body/sexy-hair-pumpkin-moisture-balance-body-wash-102oz?lang
uage=en¤cy=USD.
Effendi, A. M., Winarni dan Sumarni, W. 2012, ‘Optimasi penggunaan
enzim bromelin dari sari bonggol nanas dalam pembuatan minyak
kelapa’, Indonesian Journal of Chemical Science, 1(1):1-6.
Eleiwa, N. Z. H., Bakr, R. O. and Mohamed, S. A. 2014, ‘Phytochemical and pharmacological screening of seeds and fruits pulp of
Cucurbita moschata Duchesne cultivated in Egypt’, International
Journal of Pharmacognosy and Phytochemistry, 29(1):1226-1236.
European Food Safety Authority (EFSA). 2012, ‘Scientific opinion on the
safety and efficacy of beta-carotene as a feed additive for all
animal species and categories’, EFSA Journal, 10(6):1-33.
Fachmi, C. 2008, ‘Pengaruh penambahan gliserin dan sukrosa terhadap
mutu sabun transparan’, Skripsi, Sarjana Teknologi Pertanian,
Institut Pertanian Bogor, Bogor.
Food and Drug Administration (FDA). 1993, FDA’s Cosmetics Handbook.
U.S. Government Printing Office, Washington DC.
Fu, C., Shi, H. and Li, Q. 2006, ‘A review on pharmacological activities and utilization technologies of pumpkin’, Plant Food for Human
Nutrition, 61:73-80.
Gandjar, I. G. dan Rohman, A. 2007, Kimia Farmasi Analisis, Pustaka
Pelajar, Yogyakarta.
Godic, A., Poljsak, B., Adamic, M., Dahmane, R. 2014, ‘The role of
antioxidants in skin cancer prevention and treatment’, Oxidative
Medicine and Cellular Longevity, 1-6.
Gordon, M. H., Pokorny, J., Yanishlieve, N., Gordon, M. 2001,
Antioxidants in Food, CRC Press, New York.
Govindani, H., Dey, A., Deb L., Rout, S. P., Parial, S. D., Jain, A. 2012,
‘Protective role of methanolic and aqueous extracts of Cucurbita moschata Linn. fruits in inflammation and drug induced gastric

137
ulcer in wister rats’, International Journal of PharmTech
Research, 4(4):1758-1765.
Greenwald, M. B. Y., Ben-Sasson, S., Bianco-Peled, H., Kohen, R. 2016,
‘Skin redox balance maintenance: the need for an nrf2-activator
delivery system’, Cosmetics, 3(1):1-28.
Guarte, R. C., Muhlbauer, W. and Kellert, M. 1996, ‘Drying characteristics
of copra and quality of copra and coconut oil’, Postharvest Biology
and Technology, 9: 361-372.
Hadia, P. R. 2006, ‘Komposisi dan evaluasi hasil pembuatan sabun padat virgin coconut oil (VCO) dengan sari jeruk nipis (Citrus
aurantifolia S.), Skripsi, Sarjana Teknik Kimia, Universitas
Andalas, Padang.
Hambali, E., Ani, S. dan Mira, R. 2005, Membuat Sabun Transparan Untuk
Gift dan Kecantikan, Penebar Plus, Jakarta.
Hambali, E., Suryani, A. dan Rifai, M. 2005, Membuat Sabun Transparan
untuk Gift dan Kecantikan, Penebar Swadaya, Jakarta.
Handayani, H. K. 2008, ‘Pengaruh peningkatan konsentrasi ekstrak etanol
96% biji alpukat (Persea americana Mill) terhadap formulasi sabun
padat transparan’, Skripsi, Sarjana Farmasi, Universitas Islam
Negeri Syarif Hidayatullah, Jakarta.
Harborne, J. B. 1987, Metode Fitokimia, edisi II, diterjemahkan oleh Padmawinata, K. dan Soediro, I., Penerbit ITB, Bandung.
Hendrasty, H. K. 2003, Teknologi Pengolahan Pangan: Tepung Labu
Kuning, Kanisius, Yogyakarta.
Hidaka, T., Anno, T. and Nakatsu, S. 1987, ‘The composition and vitamin
A value of the carotenoids of pumpkins of different colors’,
Journal of Food Biochemistry, 11:59-68.
Hill, J. C. 2005, High Unsaponifiables and Methods of Using The Same,
diakses pada 15 April 2016,
https://patentscope.wipo.int/search/en/detail.jsf?docId=WO201214
8706.
138
Hinneberg, I, Dorman, D. H. J., Hiltunen, R. 2006, ‘Antioxidant activities
of extracts from selected culinary herbs and spices’, Food
Chemistry, 97:122–129.
Hui, Y. H. and Evranuz, E. O (eds.) 2016, Handbook of Vegetable
Preservation and Processing, 2nd ed., USA, CRC Press, pp. 672,
675.
Hutapea, J. R. 1994, Inventaris Tanaman Obat Indonesia Jilid III,
Departemen Kesehatan RI dan Badan Penelitian dan
Pengembangan Kesehatan, Jakarta.
Igarashi, T., Nishino, K. and Nayar, S. K. 2005, ‘The appearance of human
skin’, Technical Report CUCS-024-025, Columbia University,
New York.
Igfar, A. 2012, ‘Pengaruh penambahan tepung labu kuning (Cucurbita
moschata) dan tepung terigu terhadap pembuatan biskuit’, Skripsi,
Sarjana Teknologi Pangan, Universitas Hasanuddin, Makassar.
Izham, M. 2013, ‘How statistics impact pharmacy practice’, CPPD at
NCCR, Qatar University.
Jellinek, J. S. 1970, Formulation and Function of Cosmetic, Wiley
Interscience, New York.
Jones, D. S. 2010, Statistik Farmasi, Diterjemahkan oleh Ramadaniati, H.
U., Penerbit Buku Kedokteran EGC, Jakarta.
Juansah, J., Dahlan, K. dan Huriati, F. 2009, ‘Peningkatan mutu sari buah
nanas dengan memanfaatkan sistem filtrasi aliran dead-end dari
membrane selulosa asetat’, Makara Sains, 13(1):94-100.
Jurn, K. 2016, Autumn Harvest Soap with Organic Pumpkin Puree,
diaksespada 25 Januari 2016,
https://www.etsy.com/listing/285414919/autumn-harvest-soap-
with-organic-pumpkin?.
Kadam, P. V., Patil, M. J. 2013, ‘Pharmacognostic study of Cucurbita
moschata (Cucurbitaceae)’, Pharmacognosy Journal, 1-3.
139
Kamikaze, D. 2002, ‘Studi awal pembuatan sabun menggunakan campuran
lemak abdomen sapi dan curd susu kafir, Skripsi, Sarjana
Peternakan, Institut Pertanian Bogor, Bogor.
Kartika, B. 1991, ‘Uji mutu pangan’, Proyek Peningkatan Perguruan
Tinggi Universitas Gajah Mada, Yogyakarta, hal. 107-111, 199.
Kedare, S. B. and Singh, R. P. 2011, ‘Genesis and development of DPPH
method of antioxidant assay’, Journal of Food Science and
Technology, 48(4):412-422.
Ketaren, S. 1986, Pengantar Teknologi Minyak dan Lemak Pangan, Universitas Indonesia Press, Jakarta.
Ketaren, S. 2008, Minyak dan Lemak Pangan, Cetakan I, Universitas
Indonesia Press, Jakarta.
Khopkar, S. M. 2010, Konsep Dasar Kimia Analitik, Universitas Indonesia
Press, Jakarta.
Kim, M. Y., Kim, E. J., Kim, Y., Choi, C., Lee, B. 2012, ‘Comparison of
the chemical compositions and nutritive values of various pumpkin
(Cucurbitaceae) species and parts’, Nutrition Research and
Practice, 6(1):21-27.
Kostalova, Z., Hromadkova, Z., Ebringerova, A., Polovka, M., Michaelsen,
T. E. and Paulsen, B. S. 2013, ‘Polysaccharides from the Styrian
oil pumpkin with antioxidant and complement-fixing activity’, Industrial Crops and Products, 41: 127-133.
Kurniawan, C. 2012, ‘Kajian penurunan beta karoten selama pembuatan
flakes ubi jalar (Ipomoea Batatas Lam) dalam berbagai suhu
pemanggangan’, Jurnal Teknologi Pangan, FTP IPB, Bogor.
Kurniawan, D. W. dan Sulaiman, T. N. S. 2009, Teknologi Sediaan
Farmasi, Graha Ilmu, Yogyakarta.
Lakey, R. T. 1941, The Chemistry and Manufacture of Cosmetics, D.Van
Nonstrand Company Inc., Michigan.

140
Lanigan, R. S. and Yamarik, T. A. (eds.) 2002, Final report on the safety
assessment of EDTA, calcium disodium EDTA, diammonium
EDTA, dipotassium EDTA, disodium EDTA, TEA-EDTA,
tetrasodium EDTA, Tripotassium EDTA, Trisodium EDTA,
HEDTA, and Trisodium HEDTA, International Journal of
Toxicology, 21:95-142.
Lee, C. M., Soin, H. K., Einarson, T. R. 2004, ‘Statistics in the Pharmacy
Literature’, The Annals of Pharmacotherapy, 38:1412-1418.
Lide, D. R. 2007, CRC Handbook of Chemistry and Physics, 88th ed., CRC Press, Boca Raton, pp. 3-482.
Lipsy, P. 2010, Thin Layer Chromatography Characterization of the Active
Ingredients in Excedrin and Anacin, Stevens Institute of
Technology, USA.
Madey, D. L. and Pinnell, S. R. 2001, ‘Using topical antioxidants to protect
against photodamage and improve skin care’ Operative Techniques
in Oculoplastic, Orbital and Reconstructive Surgery, 4(2):62-64.
Marina, A. M., Che Man, Y. B. and Amin, I. 2009, ‘Virgin coconut oil:
emerging functional food oil’, Trends in Food Science and
Technology, 20:481-487.
Martin, A., Swarbrick, J. dan Cammarata, A. 1990, Farmasi Fisik,
diterjemahkan oleh Yoshita, UI-Press, Jakarta.
Masaki, H. 2010. ‘Role of antioxidants in the skin: Anti-aging effects’,
Journal of Dermatological Science, 58:85-90.
Maulana, M. 2010, ‘Pengaruh suhu dan waktu penyimpanan sabun mandi
batang kecantikan dan sabun mandi batang kesehatan terhadap
kadar air, kadar alkali bebas NaOH, asam lemak bebas dan kadar
garam NaCl’, Skripsi, Sarjana Teknik Kimia, Universitas Sumatera
Utara, Medan.
Mieke, 2016. Hatha Harvest Soap Organic Pumpkin Puree, diaksespada 25
Januari 2016, https://www.etsy.com/listing/257364459/hatha-
harvest-soap-organic-pumpkin-puree?.
141
Mishra, D. 2013, Preparation of Soap Using Different Types of Oils and
Exploring Its Properties, Department of Chemical Engineering,
National Institute of Technology Rourkela.
Mitsui, T. 1997, New Cosmetic Science, Elsivier Science, Netherland.
Molyneux, P. 2004, ‘The use of the stable free radical
diphenylpicrylhydrazyl (DPPH) for estimating antioxidant
activity’, Songklanakarin Journal of Science and Technology,
26(2):211-219.
Montenegro, L. 2014, ‘Nanocarriers for skin delivery of cosmetic antioxidants’, Journal of Pharmacy & Pharmacognosy Research,
2(4):73-92.
Morrissey, P. A. dan O'Brien, N. M. 1998, ‘Dietary antioxidants in health
and disease’, International Dairy Journal, 8: 463-472.
Mueller, L. and Boehm, V. 2011, ‘Antioxidant activity of β-carotene
compounds in different in vitro assays’, Molecules, 16:1055-1069.
Murkovic, M., Mulleder, U. and Neunteufl, H. 2002, ‘Carotenoid content in
different varieties of pumpkin’, Journal of Food Composition and
Analysis, 15:633-638.
Nawar, W. F. 1996, ‘Lipids’ in: Fennema, O. (ed.), Food chemistry, 3rd ed.,
Marcel Dekker, Inc., New York, pp. 225–320.
Nawirska-Olszanska, A., Kita, A., Biesiada, A., Sokol-Letowska A. and
Kucharska, A. Z. 2013. ‘Characteristics of antioxidant activity and
composition of pumpkin seed oils in 12 cultivars’, Food
Chemistry, 139:155-161.
Noelia J. V., Roberto, M. J. M., Jesus Z. M. J. de and Alberto, G. I. J. 2011,
‘Physicochemical, technological properties and health-benefits of
Cucurbita moschata Duchense vs. Cehualca’, Review Food
Research International, 44:2587–2593.
Norshazila, S., Irwandi, J., Othman, R. and Zuhanis, H. H. Y. 2014,
‘Carotenoid content in different locality of pumpkin (Cucurbita
142
moschata) in Malaysia’, International Journal of Pharmacy and
Pharmaceutical Science, 6(3): 29-32.
O’Brien, R. D. 2004, Fats and Oils: Formulating and Processing for
Applications, CRC Press, New York.
Obon, J. M., Castellar, M. R., Alacid, M. and Fernández-López, J. A. 2009,
‘Production of a red-purple foodcolorant from Opuntia stricta
fruits by spray drying and its application in food model systems’,
Journal of Food Engineering, (90):471–479.
Oghome, P., Eke, M. U. and Kamalu, C. I. O. 2012, ‘Characterization of fatty acid used in soap manufacturing in Nigeria: laundry, toilet,
medicated and antiseptic soap’, International Journal of Modern
Engineering Research, 2(4):2930-2934.
Owen, T. 1996, Fundamentals of UV-Visible Spectroscopy, Hewlett-
Packard, Germany.
Pambudi, D. R. 2013, ‘Formulasi sediaan sabun mandi transparan minyak
atsiri jeruk purut (Citrus hystrix DC.) dengan kokamidopropil
betain sebagai surfaktan’, Naskah Publikasi, Sarjana Farmasi,
Universitas Muhammadiyah Surakarta.
Parasuram, K. S. 1995, Soap and Detergents, Publishing Company, New
Delhi, hal. 9-11, 103-107.
Pathak, Y. (ed.). 2009, Handbook of Nutraceuticals: Ingredients, Formulations and Applications, volume I, CRC Press, USA.
Percival, M. 1998, ‘Antioxidants’, Clinical Nutrition Insights, hal. 1–4.
Pietta, P. G. 2000, ‘Flavonoids as antioxidants’, Journal of Natural
Products, 63:1035-1042.
Poucher, W. A. 1974, Modern Cosmetics: Perfumes, Cosmetics and Soaps,
7th ed., Chapman and Hall, London.
Pranoto, S. 2001, ‘Pengaruh penambahan coconut dietanolamida dan
cocamidopropil betain terhadap stabilitas busa sediaan sabun
mandi susu’, Skripsi, Sarjana Farmasi, Universitas Katolik Widya
Mandala, Surabaya.
143
Prastiwi, S. 2005, ‘Penetapan kadar karoten dalam wortel (Daucus carota
L.) yang ditanam di desa nangkajajar, pasuruan dan desa junggo,
kota Batu secara spektrofotometri’, Skripsi, Sarjana Farmasi,
Universitas Katolik Widya Mandala, Surabaya.
Purwiyatno, H. 2013, ‘Freeze drying technology: for better quality and
flavor of dried products’, Food review Indonesia, 8(2).
Putri, I. P. S. 2013, ‘Formulasi dan uji stabilitas fisik sabun padat transparan
dari fraksi diklorometana ekstrak metanol kulit buah manggis
(Garcinia mangostana L.) sebagai antioksidan’,Skripsi, Sarjana Farmasi, Universitas Indonesia.
Qisti, R. 2009, ‘Sifat kimia sabun transparan dengan penambahan madu
pada konsentrasi yang berbeda, Skripsi, Sarjana Peternakan,
Institut Pertanian Bogor, Bogor.
Que, F., Mao, L., Fang, X., Wu, T. 2008, ‘Comparison of hot air-drying and
freeze-drying on the physicochemical properties and antioxidant
activities of pumpkin (Cucurbita moschata Duch.) flours’,
International Journal of Food Science and Technology, 43:1195–
1201.
Rabiskova, M., Bautzova, T., Dvorackova, K., Spilkova, J. 2009,
‘Beneficial effects of rutin, quercitrin and quercetin on
inflammatory bowel disease’, Ceska Slovenska Farmacie, 58:47-54.
Reiger, M. M. (ed.) 2000, Harry’s Cosmeticology, 8th ed., Boston, Chemical
Publishing Co., p. 120.
Rios, A. O. and Antunes, L. M. G. 2009, ‘Carotenoids protection against
free radicals generated in the treatment of cancer with cisplatin’,
Rev. Aliment. e Nutri., 20:342-350.
Robinson, R. W. and Decker-Walters, D. S. 1997, Cucurbits. CAB
International, New York.
Robinson, V. C., Bergfeld, W. F., Belsito, D. V., Hill, R. A., Klaassen, C.
D., Marks, J. G., Shank, R. C., Slaga, T. J., Snyder, P. W.,
Andersen, F. A. 2010, ‘Final report of the amended safety assessment of sodium laureth sulfate and related salts of sulfated

144
ethoxylated alcohols’, International Journal of Toxicology,
29(3):151S-161S.
Rocky Mointain Soap Co. 2016, Pumpkin Soap, diakses pada 25 Januari
2016, https://www.rockymountainsoap.com/products/pumpkin-
soap.
Rodriguez-Amaya, D. B., Kimura, M., Amaya-Farfan, J. 2008, Brazilian
sources of carotenoids, DF: Ministerio do Meio Ambiente,
Brasilia.
Romm, S. 1992, The Changing Face of Beauty, Mosby-Yearbook, St. Louis.
Rosen, M. J. 1978, Surfactans and Interfacial Phenomena, John Wiley and
Sons, New York, pp. 16-17, 83, 113.
Rouessac, F. and Rouessac, A., 2007, Chemical Analsis Modern
Instrumention Methods and Techniques, 2nd ed., Wiley, England.
Rowe, R. C., Sheskey, P. J. and Quinn, M. E. 2009, Handbook of
Pharmaceutical Excipients, 6th ed., London, Pharmaceutical Press.
Roy, J. G., Bobbit, J. M. and Arthur, E. S. 1991, Pengantar Kromatografi,
Penerbit ITB, Bandung.
Safitri, R. 2011, ‘Penggunaan buah labu kuning (Cucurbita moschata
Durch) dalam sediaan krim pelembab’, Skripsi, Sarjana Farmasi,
Universitas Sumatera Utara, Medan.
Sagar, V. R. and Suresh, K. P. 2010, ‘Recent advances in drying and
dehydration of fruits and vegetables’, Journal of Food Science and
Technology, (47):15-26.
Saudian Arabian Standard Organization (SASO). 2008, Standard of
Gliserin Soap, Transparent Soap, and Non Transparent Soap.
SASO, Saudi Arabia.
Sastrohamidjojo, H. 1991, Kromatografi, Liberty, Yogyakarta.
145
Schmid-Wendtner, M. H. and Korting, H. C. 2006, ‘The pH of the skin
surface and its impact on the barrier function’, Skin Pharmacology
and Physiology, 19:296-302.
Sendra, J. M., Sentandreu, E., Navarro, J. L. 2006, ‘Reduction kinetics of
the free stable radical 2, 2-diphenyl-1-picrylhydrazyl (DPPH•) for
determination of the antiradical activity of citrus juices’, European
Food Research and Technology, 223:615–624.
Shi, X., Wu, H., Shi, J., Xue, S. J., Wang, D., Wang, W., Cheng, A., Gong,
Z., Chen, X. and Wang, C. 2013, ‘Effect of modifier on the composition and antioxidant activity of carotenoid extracts from
pumpkin (Cucurbita maxima) by supercritical CO2’, LWT Food
Science and Technology, 51:433-440.
Shrivastava, S. B. 1982, Soap, Detergent and Perfume Industry, Small
Industry Research Institute, New Delhi.
Sierra, Z. N. and Balleza, C. F. 1972, ‘Proximate analysis of the coconut
endosperm at progressive stages of development’, Annual Report
1971-1972, National Institute of Science and Technology.
Sies, H. and Stahl, W. ‘Carotenoids and UV protection’, Photochemical and
Photobiological Sciences, 3(8):749-752.
Simo, A., Kawal, N., Paliyath, G., Bakovic, M. 2014, ‘Botanical
antioxidants for skin health in the world of cosmeceuticals’, International Journal of Advanced Nutritional and Health Science,
2(1):67-88.
Singh, J. 2008, ‘Maceration, percolation and infusion techniques for the
extraction of medicinal and aromatic plants’ in Handa, S. S.,
Khanuja, S. P. S., Longo, G., Rakesh D. D. (eds.) Extraction
Technologies for Medicinal and Aromatic Plants, International
Centre for Science and High Technology, Trieste, pp. 67-82.
Soerarti, W. dan Tutik, P. 2004, ‘Penambahan asam glikolat terhadap
efektifitas sediaan tabir surya kombinasi anti UV-A dan anti UV-B
dalam basis gel’, Majalah Airlangga Surabaya, 3(4).
146
Soewarna, T. S. 1985, Penilaian Organoleptis, Bharatara Karya Aksara,
Jakarta.
Song, Y., Yang, Y., Zhang, Y., Duan, L., Zhou, C., Ni, Y.,Liao, X., Li, Q.
and Hu, X. 2013, ‘Effect of acetylation on antioxidant and
cytoprotective activity of polysaccharides isolated from pumpkin
(Cucurbita pepo, lady godiva)’, Carbohydrate Polymerase,
98:686-691.
Spears, K. 2000, ‘Analytical methods’ in Butler, H. (ed.) Poucher's
Perfumes, Cosmetics and Soaps, Kluwer Academic Publishers, London.
Spitz, L. 1996, Soap and Detergents: A Theoretical and Practical Review,
AOCS Press, Illinois.
Stahl, E. 1985, Analisis Obat secara Kromatografi dan Mikroskopi,
diterjemahkan oleh Padmawinata, K. dan Soediro, I., ITB Press,
Bandung.
Steenis, C. G. G. J. van, den Hoed, G., Bloembergen, S. dan Eyma, P. J.
2008, Flora: Untuk Sekolah di Indonesia, Cetakan XII,
Diterjemahkan oleh Surjowinoto, dkk, Pradnya Paramita, Jakarta,
hal. 378-379.
Stephen, B. 2004, Intisari Kimia Organik, Hipokrates, Jakarta.
Steve. 2008, Saponification Table Plus The Characteristics of Oils in Soap, diakses pada 20 Mei 2016, http://www.soap-making-
resource.com/saponification-table.html.
Suprapti, M. L. 2005a, Aneka Awetan Kering dan Dodol Waluh, Kanisius,
Yogyakarta, hal. 10-17.
Suprapti, M. L. 2005b, Aneka Olahan Beligu dan Labu, Kanisius,
Yogyakarta, hal. 14-22.
Suprapti, M. L. 2005c, Kuaci dan Manisan Waluh, Kanisius, Yogyakarta,
hal. 10-17.

147
Suprapti, M. L. 2005d, Selai dan Cake Waluh, Kanisius, Yogyakarta, hal.
17.
Supriyono, T. 2008, ‘Kandungan beta karoten, polifenol total dan aktivitas
”merantas” radikal bebas kefir susu kacang hijau (Vigna radiata)
oleh pengaruh jumlah starter (Lactobacillus bulgaricus dan
Candida kefir) dan konsentrasi glukosa, Tesis, Pascasarjana,
Universitas Diponegoro, Semarang.
Suryaningsih, D. 2006, ‘Pengaruh konsentrasi sodium PEG-7-olive oil
carboxylate (olivem 400) terhadap efektivitas sediaan virginity liquid soap yang mengandung ekstrak daun Piper betle Linn.
(sirih)’, Skripsi, Sarjana Farmasi, Universitas Katolik Widya
Mandala, Surabaya.
Swern, D. 1979, Bailey’s Industrial Oil and Fat Products, volume I, 4th ed.,
John Wiley and Sons, New York.
Syukur, S. 2004, ‘Bioteknologi virgin voconut oil, peningkatan kesehatan
total dan pengentasan kemiskinan masyarakat pedesaan’ Seminar
dan Workshop Terpadu Lembaga Pengabdian Masyarakat Unand,
Padang, hal 1-15.
Taylor, M. J. and Brant, J. 2002, ‘Trends in world cucurbit production: 1991
to 2001’, in Maynard, D. N. (ed.) Cucurbitaceae, ASHS Press,
Alexandria, VA, pp: 373-379.
The Soap and Detergent Association. 1994, Soaps and Detergents, SDA,
Washington.
Thiele J. J., Schroeter, C., Hsieh, S. N., Podda, M., Packer, L. 2001, ‘The
antioxidant network of the stratum corneum’, Current Problems in
Dermatology, 29:26–42.
Three Sisters Apotechary. 2014, Harvest Pumpkin and Cinnamon Bar Soap
4,75 oz, diakses pada 25 Januari 2016,
http://www.soapcauldron.com/harvest-pumpkin-cinnamon-soap-4-
75-oz.html.
Timmreck, T. C. 2004. Epidemiologi Suatu Pengantar, edisi II, EGC,
Jakarta.

148
Tranggono, R. I. dan Latifah, F. 2007, Buku Pegangan Ilmu Pengetahuan
Kosmetik, Gramedia, Jakarta.
Umbach, W. 1998, Cosmetic and Toiletries Development, Production and
Use, Ellis Horword, New York, pp. 92 – 94.
US Department of Agriculture (USDA). 2016, National Nutrient Database
for Standard Reference, Release 28, Nutrient Data Laboratory,
USDA Agricultural Research Service, Washington DC.
Villarino, B. J., Dy, L. M. and Lizada, C. C. 2007, ‘Descriptive sensory
evaluation of virgin coconut oil and refined, bleached and deodorized coconut oil’ LWT-Food Science and Technology,
40:193-199.
Vivian, O. P., Nathan, O., Aloys, O., Mesopirr, L., Omwoyo, W. N. 2014,
‘Assessment of the physicochemical properties of selected
commercial soaps manufactured and sold in Kenya’, Open Journal
of Applied Sciences, 4:443-440.
Voight, R. 1995, Buku Pelajaran Teknologi Farmasi, edisi V,
Diterjemahkan oleh Soewandhi, N. S., Gadjah Mada University
Press, Yogyakarta.
Wahyuni, D. T. dan Widjanarko, S. B. 2015, ‘Pengaruh jenis pelarut dan
lama ekstraksi terhadap ekstrak karotenoid labu kuning dengan
metode gelombang ultrasonik’, Jurnal Pangan dan Agroindustri, 3(2): 390 – 401.
Wang, P. and Zhao, Q. Y. 1998, ‘Nutrient ingredient, medicinal value and
exploitative prospects of pumpkin’, Journal of ChangJiang
Vegetables, 7:1–4.
Wang, P., Liu, J. C. and Zhao, Q. Y. 2002, ‘Studies on nutrient composition
and utilization of pumpkin fruit’, Journal of Inner Mongolia
Agricultural University, 23:52–54.
Wasitaatmadja, S. M. 1997, Penuntun Ilmu Kosmetik Medik, Penerbit
Universitas Indonesia (UI-Press), Jakarta.

149
Whitaker, T. W. and Davis, G. N. 1962, Cucurbits, Interscience Publisher
Inc., New York.
Widayati, E. dan Damayanti, W. P. 2007, Aneka Panganan Labu Kuning,
Trubus Agrisarana, Surabaya.
Widiyanti, Y. 2009, ‘Kajian pengaruh jenis minyak terhadap mutu sabun
transparan’, Skripsi, Sarjana Teknologi Pertanian, Institut
Pertanian Bogor, Bogor.
Wilkinson, J. B. and Moore, R. J. 1982, Harry’s Cosmeticology, 7th ed.,
George Godwin, London.
Willcox, M. 2000, ‘Soap’ in Butler, H. (ed.) Poucher's Perfumes, Cosmetics
and Soaps, Kluwer Academic Publishers, London, pp. 453-465.
Williams, D. F. and Schimtt, W. H. 1992, Chemistry and Technology of the
Cosmetics and Toiletries Industry, 2nd ed., Chesebrough Ponds,
New York.
Winarsi, H. 2007, Antioksidan Alami dan Radikal Bebas, Kanisius,
Yogyakarta, pp. 11-20,79-82,147-161.
Wortzman, M. S., Scott, R. A., Wong, P. S., Lowe, N. J., Breeding, J. 1983,
‘Soap and detergent bar rinsability’, Journal of the Society of
Cosmetic Chemists, 37:89-97.
Yulita, A. C. 2013, ‘Pembuatan sari buah belimbing manis (Averrhoa
carambola Linn) dengan memanfaatkan kerusakan sel akibat metode pembekuan lambat dan thawing, Skripsi, Sarjana
Teknologi Pangan, Universitas Brawijaya.
Zapsalis, C. and Beck, R. 1996, Food Chemistry and Nutritional
Biochemistry, Macmillan Publishing Company, New York.
Zhao, J., Liu, W., Chen, D., Song, Y., Zhang, Y., Ni, Y. and Li, Q. 2015,
‘Physicochemical and antioxidant properties of different pumpkin
cultivars grown in China’, Advance Journal of Food Science and
Technology, 9(4):308-316.

150
Zhang, F., Jiang, Z. M. and Zhang, E. M. 2000, ‘Pumpkin function
properties and application in food industry’, Science and
Technology of Food Industry, 21:62–64.
Zhang, X. J., Liu, Y. S. and Yao, W. 2002, ‘Dynamic changes of pectin
substance in different pumpkin varieties during the development of
fruits’, Scientia Agricultura Sinica, 35:1154–1158.
Zhang, Y. J. and Sheng, X. C. 2003, ‘The medicinal value and its
development prospect of pumpkin’, Journal of China Institute of
Metrology, 14:204–206.

151
LAMPIRAN A
HASIL STANDARISASI PARAMETER NON SPESIFIK DAN
SPESIFIK EKSTRAK LABU KUNING (CUCURBITA MOSCHATA)
A1. STANDARISASI NON SPESIFIK
1. Kadar air
Rep.
Berat cawan
konstan (g) Berat
ekstrak (g)
Berat cawan +
ekstrak konstan (g) Kadar air
(%) W1 W2 W1 W2
1 28,5314 28,5283 10,0845 37,5691 37,5666 10,37
2 32,0591 32,0549 10,2115 41,1788 41,1732 10,71
3 26,9107 26,9066 10,0943 36,0027 35,9949 9,97
X ± SD 10,35 ± 0,37
Contoh perhitungan (replikasi I)
Kadar air (%) =
Berat ekstrak – {(berat cawan + ekstrak konstan ) – berat cawan konstan }
Berat ekstrak x 100%
= 10,0845 –(37,5666 – 28,5283)
10,0845 x 100%
= 10,37%
2. Kadar abu total
Rep.
Berat krus
konstan (g) Berat
ekstrak (g)
Berat krus + abu
konstan (g) Kadar abu
total (%) W1 W2 W1 W2
1 29,167 29,152 2,825 29,250 29,222 2,48
2 30,186 30,169 2,884 30,274 30,243 2,57
3 23,243 23,232 2,733 23,371 23,307 2,74
X ± SD 2,60 ± 0,14
Contoh perhitungan (replikasi I)
Kadar abu total (%) = (berat krus + abu konstan ) – berat krus konstan
Berat ekstrak x 100%
= 29,222 – 29,152
2,825 x 100%
= 2,48%
152
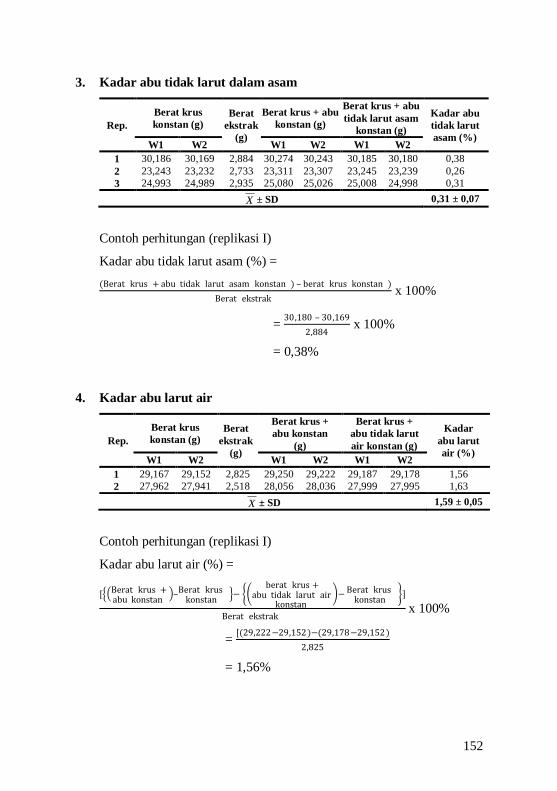
3. Kadar abu tidak larut dalam asam
Rep.
Berat krus
konstan (g) Berat
ekstrak
(g)
Berat krus + abu
konstan (g)
Berat krus + abu
tidak larut asam
konstan (g)
Kadar abu
tidak larut
asam (%) W1 W2 W1 W2 W1 W2
1 30,186 30,169 2,884 30,274 30,243 30,185 30,180 0,38
2 23,243 23,232 2,733 23,311 23,307 23,245 23,239 0,26
3 24,993 24,989 2,935 25,080 25,026 25,008 24,998 0,31
X ± SD 0,31 ± 0,07
Contoh perhitungan (replikasi I)
Kadar abu tidak larut asam (%) =
(Berat krus + abu tidak larut asam konstan ) – berat krus konstan )
Berat ekstrak x 100%
= 30,180 – 30,169
2,884 x 100%
= 0,38%
4. Kadar abu larut air
Rep.
Berat krus
konstan (g) Berat
ekstrak
(g)
Berat krus +
abu konstan
(g)
Berat krus +
abu tidak larut
air konstan (g)
Kadar
abu larut
air (%) W1 W2 W1 W2 W1 W2
1 29,167 29,152 2,825 29,250 29,222 29,187 29,178 1,56
2 27,962 27,941 2,518 28,056 28,036 27,999 27,995 1,63
X ± SD 1,59 ± 0,05
Contoh perhitungan (replikasi I)
Kadar abu larut air (%) =
[ Berat krus + abu konstan
–Berat krus konstan
− berat krus +
abu tidak larut air konstan
− Berat krus konstan
]
Berat ekstrak x 100%
= [(29,222−29,152)−(29,178−29,152)
2,825
= 1,56%

153
A2. STANDARISASI SPESIFIK
1. pH
Rep. pH
1 5,83
2 5,71
3 5,72
X ± SD 5,75 ± 0,06
2. Kadar sari larut air
Rep.
Berat cawan
konstan (g)
Berat
ekstrak
konstan
(g)
Berat cawan +
ekstrak konstan
(g) Kadar sari
larut air (%)
W1 W2 W1 W2
1 33,2805 33,2747 5,0649 33,8446 33,8413 55,93
2 42,3542 42,3512 5,0813 42,8963 42,8918 53,20
3 58,4738 58,4681 5,0844 58,9862 58,9805 50,39
X ± SD 53,17 ± 2,77
Contoh perhitungan (replikasi I)
Kadar sari larut air (%) =
(berat cawan + ekstrak konstan ) – berat cawan konstan )
Berat ekstrak x 100% x FP
= 33,8413 – 33,2747
5,0649 x 100% x
100
20
= 55,93%
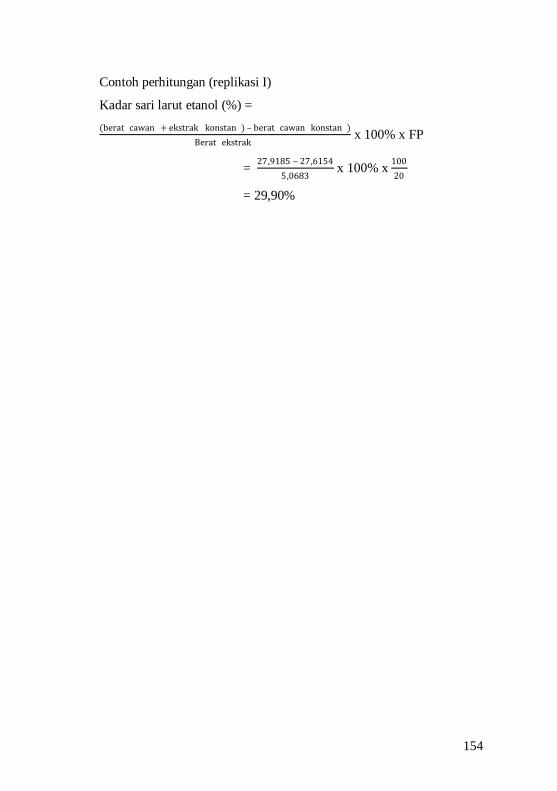
3. Kadar sari larut etanol
Rep. Berat cawan
konstan (g)
Berat
ekstrak
konstan
(g)
Berat cawan +
ekstrak konstan
(g)
Kadar sari
larut etanol
(%) W1 W2 W1 W2
1 27,6183 27,6154 5,0683 27,9204 27,9185 29,90
2 31,7919 31,7868 5,0193 32,1106 32,1091 32,11
3 43,0810 43,0746 5,0383 43,4322 43,3200 24,35
X ± SD 28,79 ± 3,99
154
Contoh perhitungan (replikasi I)
Kadar sari larut etanol (%) =
(berat cawan + ekstrak konstan ) – berat cawan konstan )
Berat ekstrak x 100% x FP
= 27,9185 – 27,6154
5,0683 x 100% x
100
20
= 29,90%

155
LAMPIRAN B
PERHITUNGAN PEROLEHAN RENDEMEN
Berat simplisia segar = 7750 gram
Berat ekstrak kental = 683,5 gram
%Rendemen Perolehan = 𝐵𝑒𝑟𝑎𝑡 𝑒𝑘𝑠𝑡𝑟𝑎𝑘 𝑘𝑒𝑛𝑡𝑎𝑙 (𝑔𝑟𝑎𝑚 )
𝐵𝑒𝑟𝑎𝑡 𝑠𝑖𝑚𝑝𝑙𝑖𝑠𝑖𝑎 𝑠𝑒𝑔𝑎𝑟 (𝑔𝑟𝑎𝑚 ) 𝑥 100%
= 683,5
7750 𝑥 100%
= 8,82%
156
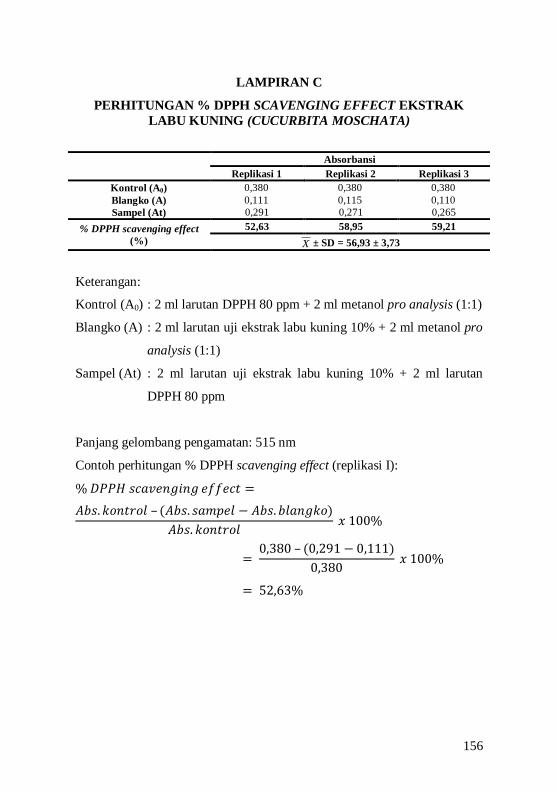
LAMPIRAN C
PERHITUNGAN % DPPH SCAVENGING EFFECT EKSTRAK
LABU KUNING (CUCURBITA MOSCHATA)
Absorbansi
Replikasi 1 Replikasi 2 Replikasi 3
Kontrol (A0) 0,380 0,380 0,380
Blangko (A) 0,111 0,115 0,110
Sampel (At) 0,291 0,271 0,265
% DPPH scavenging effect
(%)
52,63 58,95 59,21
X ± SD = 56,93 ± 3,73
Keterangan:
Kontrol (A0) : 2 ml larutan DPPH 80 ppm + 2 ml metanol pro analysis (1:1)
Blangko (A) : 2 ml larutan uji ekstrak labu kuning 10% + 2 ml metanol pro
analysis (1:1)
Sampel (At) : 2 ml larutan uji ekstrak labu kuning 10% + 2 ml larutan
DPPH 80 ppm
Panjang gelombang pengamatan: 515 nm
Contoh perhitungan % DPPH scavenging effect (replikasi I):
% 𝐷𝑃𝑃𝐻 𝑠𝑐𝑎𝑣𝑒𝑛𝑔𝑖𝑛𝑔 𝑒𝑓𝑓𝑒𝑐𝑡 =
𝐴𝑏𝑠.𝑘𝑜𝑛𝑡𝑟𝑜𝑙 – (𝐴𝑏𝑠. 𝑠𝑎𝑚𝑝𝑒𝑙 − 𝐴𝑏𝑠.𝑏𝑙𝑎𝑛𝑔𝑘𝑜)
𝐴𝑏𝑠. 𝑘𝑜𝑛𝑡𝑟𝑜𝑙 𝑥 100%
= 0,380 – (0,291 − 0,111)
0,380 𝑥 100%
= 52,63%
157
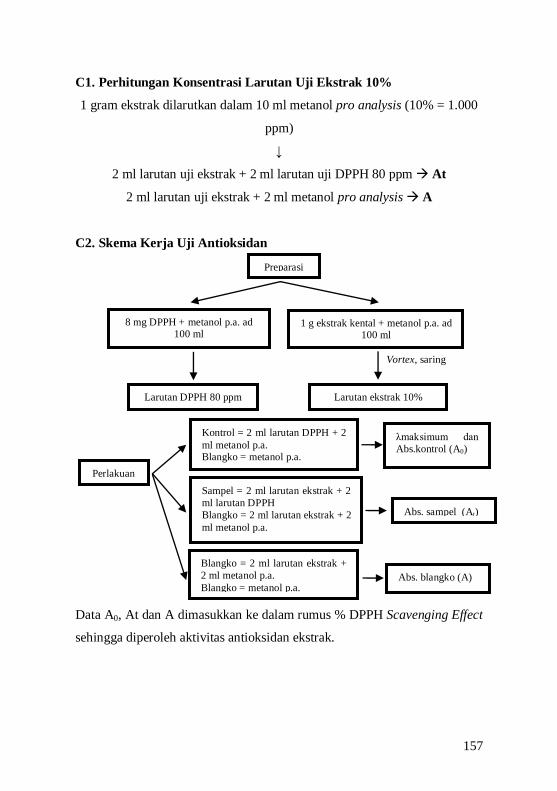
C1. Perhitungan Konsentrasi Larutan Uji Ekstrak 10%
1 gram ekstrak dilarutkan dalam 10 ml metanol pro analysis (10% = 1.000
ppm)
↓
2 ml larutan uji ekstrak + 2 ml larutan uji DPPH 80 ppm At
2 ml larutan uji ekstrak + 2 ml metanol pro analysis A
C2. Skema Kerja Uji Antioksidan
Data A0, At dan A dimasukkan ke dalam rumus % DPPH Scavenging Effect
sehingga diperoleh aktivitas antioksidan ekstrak.
Vortex, saring
Blangko = 2 ml larutan ekstrak +
2 ml metanol p.a.
Blangko = metanol p.a.
Larutan DPPH 80 ppm
8 mg DPPH + metanol p.a. ad 100 ml
Kontrol = 2 ml larutan DPPH + 2
ml metanol p.a. Blangko = metanol p.a.
Larutan ekstrak 10%
1 g ekstrak kental + metanol p.a. ad 100 ml
λmaksimum dan
Abs.kontrol (A0)
Sampel = 2 ml larutan ekstrak + 2
ml larutan DPPH
Blangko = 2 ml larutan ekstrak + 2
ml metanol p.a.
Perlakuan
Preparasi
Abs. sampel (At)
Abs. blangko (A)
158
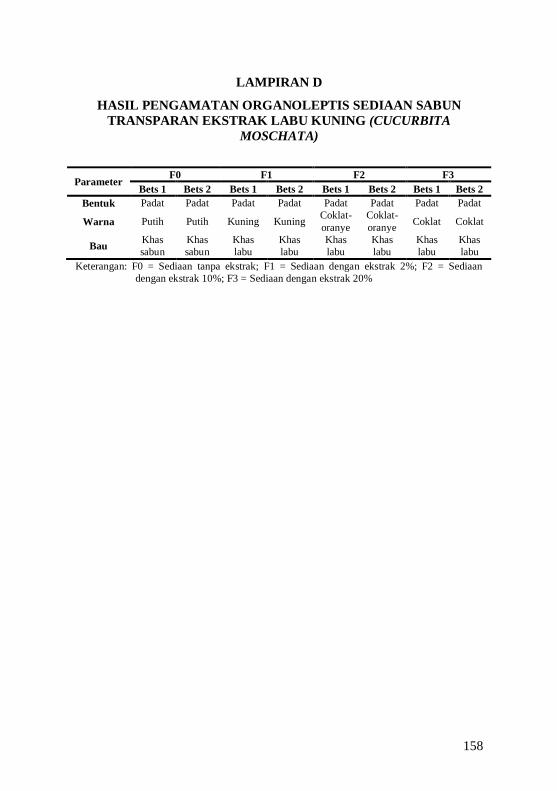
LAMPIRAN D
HASIL PENGAMATAN ORGANOLEPTIS SEDIAAN SABUN
TRANSPARAN EKSTRAK LABU KUNING (CUCURBITA
MOSCHATA)
Parameter F0 F1 F2 F3
Bets 1 Bets 2 Bets 1 Bets 2 Bets 1 Bets 2 Bets 1 Bets 2
Bentuk Padat Padat Padat Padat Padat Padat Padat Padat
Warna Putih Putih Kuning Kuning Coklat-
oranye
Coklat-
oranye Coklat Coklat
Bau Khas
sabun
Khas
sabun
Khas
labu
Khas
labu
Khas
labu
Khas
labu
Khas
labu
Khas
labu
Keterangan: F0 = Sediaan tanpa ekstrak; F1 = Sediaan dengan ekstrak 2%; F2 = Sediaan
dengan ekstrak 10%; F3 = Sediaan dengan ekstrak 20%
159
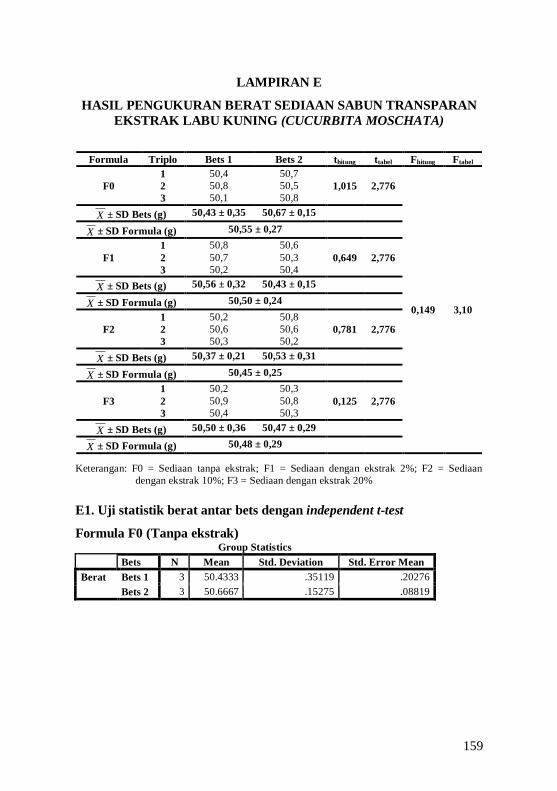
LAMPIRAN E
HASIL PENGUKURAN BERAT SEDIAAN SABUN TRANSPARAN
EKSTRAK LABU KUNING (CUCURBITA MOSCHATA)
Formula Triplo Bets 1 Bets 2 thitung ttabel Fhitung Ftabel
F0
1 50,4 50,7
1,015 2,776
0,149 3,10
2 50,8 50,5
3 50,1 50,8
X ± SD Bets (g) 50,43 ± 0,35 50,67 ± 0,15
X ± SD Formula (g) 50,55 ± 0,27
F1
1 50,8 50,6
0,649 2,776 2 50,7 50,3
3 50,2 50,4
X ± SD Bets (g) 50,56 ± 0,32 50,43 ± 0,15
X ± SD Formula (g) 50,50 ± 0,24
F2
1 50,2 50,8
0,781 2,776 2 50,6 50,6
3 50,3 50,2
X ± SD Bets (g) 50,37 ± 0,21 50,53 ± 0,31
X ± SD Formula (g) 50,45 ± 0,25
F3
1 50,2 50,3
0,125 2,776 2 50,9 50,8
3 50,4 50,3
X ± SD Bets (g) 50,50 ± 0,36 50,47 ± 0,29
X ± SD Formula (g) 50,48 ± 0,29
Keterangan: F0 = Sediaan tanpa ekstrak; F1 = Sediaan dengan ekstrak 2%; F2 = Sediaan
dengan ekstrak 10%; F3 = Sediaan dengan ekstrak 20%
E1. Uji statistik berat antar bets dengan independent t-test
Formula F0 (Tanpa ekstrak)
Group Statistics
Bets N Mean Std. Deviation Std. Error Mean
Berat Bets 1 3 50.4333 .35119 .20276
Bets 2 3 50.6667 .15275 .08819

160
Independent Samples Test
Levene's Test
for Equality
of Variances
t-test for Equality of Means
F Sig. t df
Sig.
(2-
tailed)
Mean
Difference
Std. Error
Difference
95% Confidence
Interval of the
Difference
Lower Upper
Berat Equal
variances
assumed
1.385 .305 -1.055 4 .351 -.23333 .22111 -.84723 .38056
Equal
variances
not assumed
-1.055 2.731 .376 -.23333 .22111 -.97795 .51128
Formula F1 (Ekstrak 2%)
Group Statistics
Bets N Mean Std. Deviation Std. Error Mean
Berat Bets1 3 50.5667 .32146 .18559
Bets2 3 50.4333 .15275 .08819
Independent Samples Test
Levene's Test
for Equality
of Variances t-test for Equality of Means
F Sig. t df
Sig.
(2-
tailed)
Mean
Difference
Std. Error
Difference
95% Confidence
Interval of the
Difference
Lower Upper
Berat Equal
variances
assumed
2.880 .165 .649 4 .552 .13333 .20548 -.43717 .70384
Equal
variances
not assumed
.649 2.859 .565 .13333 .20548 -.53917 .80584
Formula F2 (Ekstrak 10%)
Group Statistics
Best N Mean Std. Deviation Std. Error Mean
Berat Bets 1 3 50.3667 .20817 .12019
Bets 2 3 50.5333 .30551 .17638
161
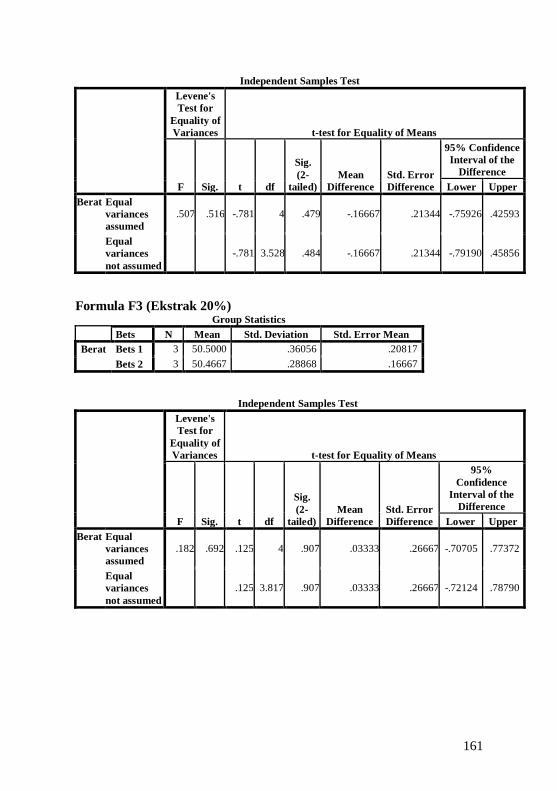
Independent Samples Test
Levene's
Test for
Equality of
Variances t-test for Equality of Means
F Sig. t df
Sig.
(2-
tailed)
Mean
Difference
Std. Error
Difference
95% Confidence
Interval of the
Difference
Lower Upper
Berat Equal
variances
assumed
.507 .516 -.781 4 .479 -.16667 .21344 -.75926 .42593
Equal
variances
not assumed
-.781 3.528 .484 -.16667 .21344 -.79190 .45856
Formula F3 (Ekstrak 20%) Group Statistics
Bets N Mean Std. Deviation Std. Error Mean
Berat Bets 1 3 50.5000 .36056 .20817
Bets 2 3 50.4667 .28868 .16667
Independent Samples Test
Levene's
Test for
Equality of
Variances t-test for Equality of Means
F Sig. t df
Sig.
(2-
tailed)
Mean
Difference
Std. Error
Difference
95%
Confidence
Interval of the
Difference
Lower Upper
Berat Equal
variances
assumed
.182 .692 .125 4 .907 .03333 .26667 -.70705 .77372
Equal
variances
not assumed
.125 3.817 .907 .03333 .26667 -.72124 .78790
162
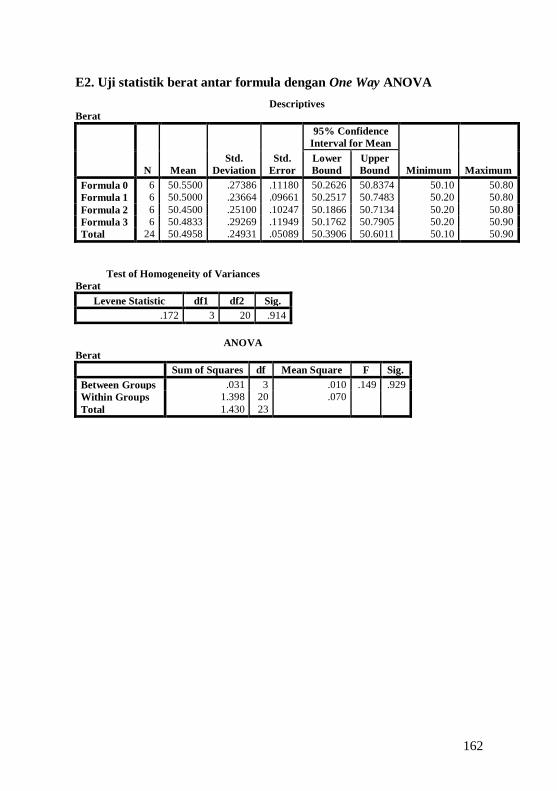
E2. Uji statistik berat antar formula dengan One Way ANOVA
Descriptives
Berat
N Mean
Std.
Deviation
Std.
Error
95% Confidence
Interval for Mean
Minimum Maximum
Lower
Bound
Upper
Bound
Formula 0 6 50.5500 .27386 .11180 50.2626 50.8374 50.10 50.80
Formula 1 6 50.5000 .23664 .09661 50.2517 50.7483 50.20 50.80
Formula 2 6 50.4500 .25100 .10247 50.1866 50.7134 50.20 50.80
Formula 3 6 50.4833 .29269 .11949 50.1762 50.7905 50.20 50.90
Total 24 50.4958 .24931 .05089 50.3906 50.6011 50.10 50.90
Test of Homogeneity of Variances
Berat
Levene Statistic df1 df2 Sig.
.172 3 20 .914
ANOVA
Berat
Sum of Squares df Mean Square F Sig.
Between Groups .031 3 .010 .149 .929
Within Groups 1.398 20 .070
Total 1.430 23
163
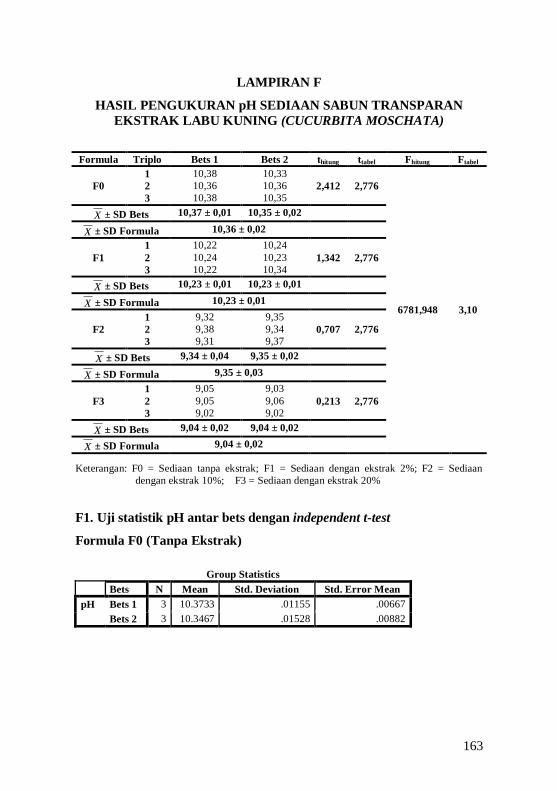
LAMPIRAN F
HASIL PENGUKURAN pH SEDIAAN SABUN TRANSPARAN
EKSTRAK LABU KUNING (CUCURBITA MOSCHATA)
Formula Triplo Bets 1 Bets 2 thitung ttabel Fhitung Ftabel
F0
1 10,38 10,33
2,412 2,776
6781,948 3,10
2 10,36 10,36
3 10,38 10,35
X ± SD Bets 10,37 ± 0,01 10,35 ± 0,02
X ± SD Formula 10,36 ± 0,02
F1
1 10,22 10,24
1,342 2,776 2 10,24 10,23
3 10,22 10,34
X ± SD Bets 10,23 ± 0,01 10,23 ± 0,01
X ± SD Formula 10,23 ± 0,01
F2
1 9,32 9,35
0,707 2,776 2 9,38 9,34
3 9,31 9,37
X ± SD Bets 9,34 ± 0,04 9,35 ± 0,02
X ± SD Formula 9,35 ± 0,03
F3
1 9,05 9,03
0,213 2,776 2 9,05 9,06
3 9,02 9,02
X ± SD Bets 9,04 ± 0,02 9,04 ± 0,02
X ± SD Formula 9,04 ± 0,02
Keterangan: F0 = Sediaan tanpa ekstrak; F1 = Sediaan dengan ekstrak 2%; F2 = Sediaan
dengan ekstrak 10%; F3 = Sediaan dengan ekstrak 20%
F1. Uji statistik pH antar bets dengan independent t-test
Formula F0 (Tanpa Ekstrak)
Group Statistics
Bets N Mean Std. Deviation Std. Error Mean
pH Bets 1 3 10.3733 .01155 .00667
Bets 2 3 10.3467 .01528 .00882
164
Independent Samples Test
Levene's
Test for
Equality of
Variances t-test for Equality of Means
F Sig. T df
Sig.
(2-
tailed)
Mean
Difference
Std. Error
Difference
95% Confidence
Interval of the
Difference
Lower Upper
pH Equal
variances
assumed
.235 .653 2.412 4 .073 .02667 .01106 -.00403 .05736
Equal
variances
not assumed
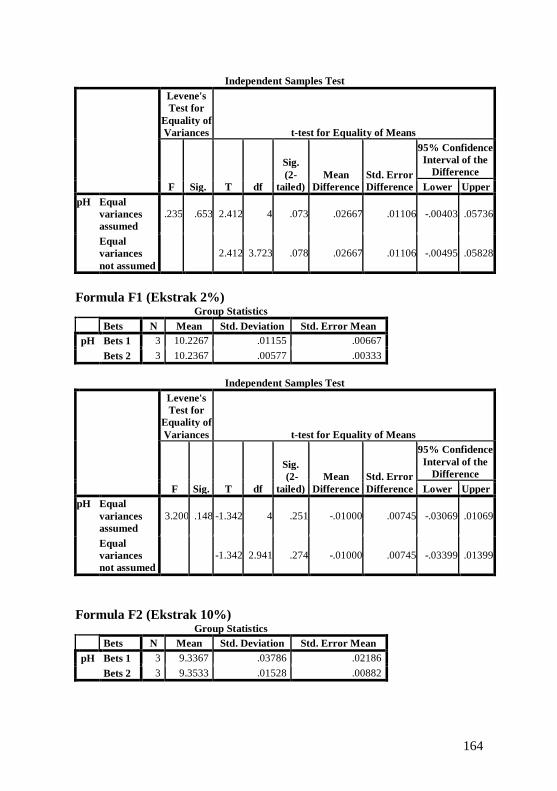
2.412 3.723 .078 .02667 .01106 -.00495 .05828
Formula F1 (Ekstrak 2%)
Group Statistics
Bets N Mean Std. Deviation Std. Error Mean
pH Bets 1 3 10.2267 .01155 .00667
Bets 2 3 10.2367 .00577 .00333
Independent Samples Test
Levene's
Test for
Equality of
Variances t-test for Equality of Means
F Sig. T df
Sig.
(2-
tailed)
Mean
Difference
Std. Error
Difference
95% Confidence
Interval of the
Difference
Lower Upper
pH Equal
variances
assumed
3.200 .148 -1.342 4 .251 -.01000 .00745 -.03069 .01069
Equal
variances
not assumed
-1.342 2.941 .274 -.01000 .00745 -.03399 .01399
Formula F2 (Ekstrak 10%)
Group Statistics
Bets N Mean Std. Deviation Std. Error Mean
pH Bets 1 3 9.3367 .03786 .02186
Bets 2 3 9.3533 .01528 .00882

165
Independent Samples Test
Levene's
Test for
Equality of
Variances t-test for Equality of Means
F Sig. t Df
Sig.
(2-
tailed)
Mean
Difference
Std. Error
Difference
95% Confidence
Interval of the
Difference
Lower Upper
pH Equal
variances
assumed
4.129 .112 -.707 4 .519 -.01667 .02357 -.08211 .04877
Equal
variances
not assumed
-.707 2.634 .537 -.01667 .02357 -.09793 .06459
Formula F3 (Ekstrak 20%)
Group Statistics
Bets N Mean Std. Deviation Std. Error Mean
pH Bets 1 3 9.0400 .01732 .01000
Bets 2 3 9.0367 .02082 .01202
,.Independent Samples Test
Levene's
Test for
Equality of
Variances t-test for Equality of Means
F Sig. t Df
Sig.
(2-
tailed)
Mean
Difference
Std. Error
Difference
95% Confidence
Interval of the
Difference
Lower Upper
pH Equal
variances
assumed
.143 .725 .213 4 .842 .00333 .01563 -.04008 .04674
Equal
variances
not assumed
.213 3.872 .842 .00333 .01563 -.04065 .04731
166
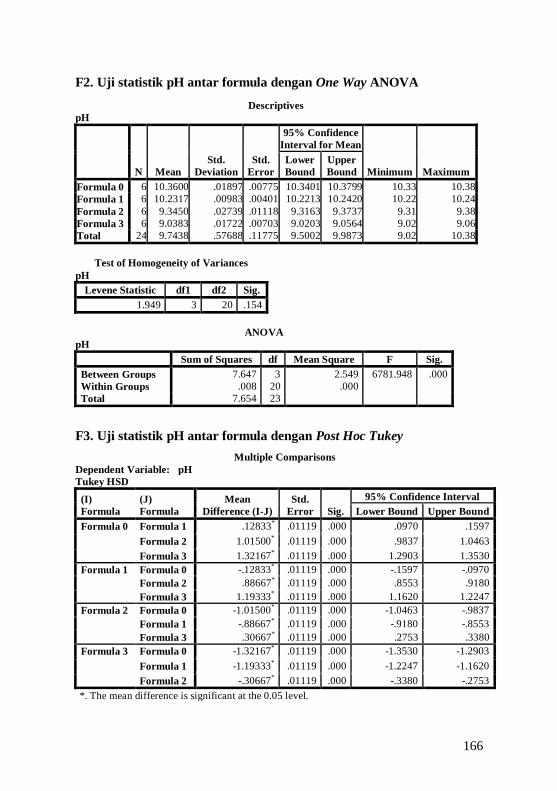
F2. Uji statistik pH antar formula dengan One Way ANOVA
Descriptives
pH
N Mean
Std.
Deviation
Std.
Error
95% Confidence
Interval for Mean
Minimum Maximum
Lower
Bound
Upper
Bound
Formula 0 6 10.3600 .01897 .00775 10.3401 10.3799 10.33 10.38
Formula 1 6 10.2317 .00983 .00401 10.2213 10.2420 10.22 10.24
Formula 2 6 9.3450 .02739 .01118 9.3163 9.3737 9.31 9.38
Formula 3 6 9.0383 .01722 .00703 9.0203 9.0564 9.02 9.06
Total 24 9.7438 .57688 .11775 9.5002 9.9873 9.02 10.38
Test of Homogeneity of Variances
pH
Levene Statistic df1 df2 Sig.
1.949 3 20 .154
ANOVA
pH
Sum of Squares df Mean Square F Sig.
Between Groups 7.647 3 2.549 6781.948 .000
Within Groups .008 20 .000
Total 7.654 23
F3. Uji statistik pH antar formula dengan Post Hoc Tukey
Multiple Comparisons
Dependent Variable: pH
Tukey HSD
(I)
Formula
(J)
Formula
Mean
Difference (I-J)
Std.
Error Sig.
95% Confidence Interval
Lower Bound Upper Bound
Formula 0 Formula 1 .12833* .01119 .000 .0970 .1597
Formula 2 1.01500* .01119 .000 .9837 1.0463
Formula 3 1.32167* .01119 .000 1.2903 1.3530
Formula 1 Formula 0 -.12833* .01119 .000 -.1597 -.0970
Formula 2 .88667* .01119 .000 .8553 .9180
Formula 3 1.19333* .01119 .000 1.1620 1.2247
Formula 2 Formula 0 -1.01500* .01119 .000 -1.0463 -.9837
Formula 1 -.88667* .01119 .000 -.9180 -.8553
Formula 3 .30667* .01119 .000 .2753 .3380
Formula 3 Formula 0 -1.32167* .01119 .000 -1.3530 -1.2903
Formula 1 -1.19333* .01119 .000 -1.2247 -1.1620
Formula 2 -.30667* .01119 .000 -.3380 -.2753
*. The mean difference is significant at the 0.05 level.
167
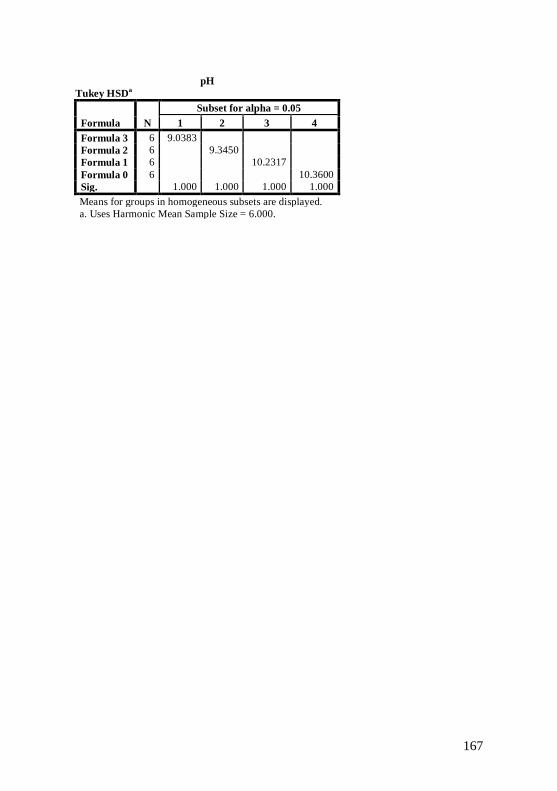
pH
Tukey HSDa
Formula N
Subset for alpha = 0.05
1 2 3 4
Formula 3 6 9.0383
Formula 2 6 9.3450
Formula 1 6 10.2317
Formula 0 6 10.3600
Sig. 1.000 1.000 1.000 1.000
Means for groups in homogeneous subsets are displayed.
a. Uses Harmonic Mean Sample Size = 6.000.
168
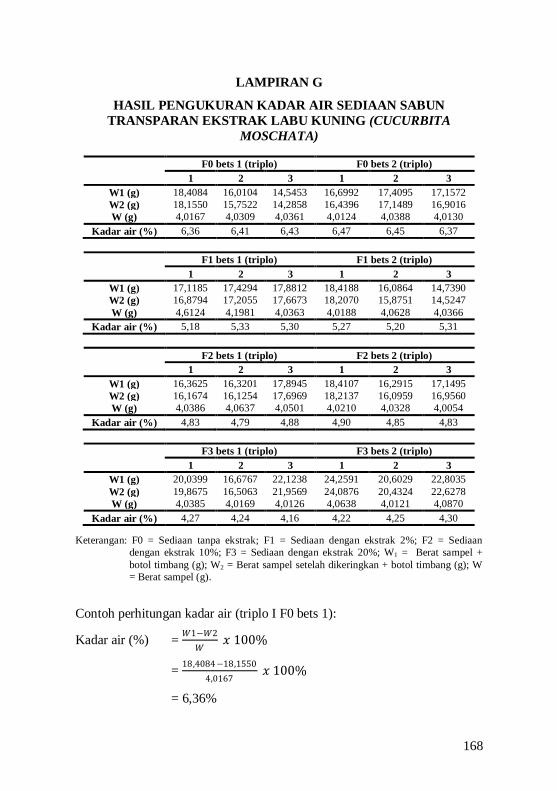
LAMPIRAN G
HASIL PENGUKURAN KADAR AIR SEDIAAN SABUN
TRANSPARAN EKSTRAK LABU KUNING (CUCURBITA
MOSCHATA)
F0 bets 1 (triplo) F0 bets 2 (triplo)
1 2 3 1 2 3
W1 (g) 18,4084 16,0104 14,5453 16,6992 17,4095 17,1572
W2 (g) 18,1550 15,7522 14,2858 16,4396 17,1489 16,9016
W (g) 4,0167 4,0309 4,0361 4,0124 4,0388 4,0130
Kadar air (%) 6,36 6,41 6,43 6,47 6,45 6,37
F1 bets 1 (triplo) F1 bets 2 (triplo)
1 2 3 1 2 3
W1 (g) 17,1185 17,4294 17,8812 18,4188 16,0864 14,7390
W2 (g) 16,8794 17,2055 17,6673 18,2070 15,8751 14,5247
W (g) 4,6124 4,1981 4,0363 4,0188 4,0628 4,0366
Kadar air (%) 5,18 5,33 5,30 5,27 5,20 5,31
F2 bets 1 (triplo) F2 bets 2 (triplo)
1 2 3 1 2 3
W1 (g) 16,3625 16,3201 17,8945 18,4107 16,2915 17,1495
W2 (g) 16,1674 16,1254 17,6969 18,2137 16,0959 16,9560
W (g) 4,0386 4,0637 4,0501 4,0210 4,0328 4,0054
Kadar air (%) 4,83 4,79 4,88 4,90 4,85 4,83
F3 bets 1 (triplo) F3 bets 2 (triplo)
1 2 3 1 2 3
W1 (g) 20,0399 16,6767 22,1238 24,2591 20,6029 22,8035
W2 (g) 19,8675 16,5063 21,9569 24,0876 20,4324 22,6278
W (g) 4,0385 4,0169 4,0126 4,0638 4,0121 4,0870
Kadar air (%) 4,27 4,24 4,16 4,22 4,25 4,30
Keterangan: F0 = Sediaan tanpa ekstrak; F1 = Sediaan dengan ekstrak 2%; F2 = Sediaan
dengan ekstrak 10%; F3 = Sediaan dengan ekstrak 20%; W1 = Berat sampel +
botol timbang (g); W2 = Berat sampel setelah dikeringkan + botol timbang (g); W
= Berat sampel (g).
Contoh perhitungan kadar air (triplo I F0 bets 1):
Kadar air (%) = 𝑊1−𝑊2
𝑊 𝑥 100%
= 18,4084−18,1550
4,0167 𝑥 100%
= 6,36%

169
Formula Triplo Bets 1 Bets 2 thitung ttabel Fhitung Ftabel
F0
1 6,36 6,47
0,812 2,776
2121,271 3,10
2 6,41 6,45
3 6,43 6,37
X ± SD Bets (%) 6,40 ± 0,04 6,43 ± 0,05
X ± SD Formula (%) 6,42 ± 0,04
F1
1 5,18 5,27
0,179 2,776 2 5,33 5,20
3 5,30 5,31
X ± SD Bets (%) 5,27 ± 0,08 5,26 ± 0,06
X ± SD Formula (%) 5,27 ± 0,06
F2
1 4,83 4,90
0,800 2,776 2 4,79 4,85
3 4,88 4,83
X ± SD Bets (%) 4,83 ± 0,05 4,86 ± 0,04
X ± SD Formula (%) 4,85 ± 0,04
F3
1 4,27 4,22
0,828 2,776 2 4,24 4,25
3 4,16 4,30
X ± SD Bets (%) 4,22 ± 0,06 4,26 ± 0,04
X ± SD Formula (%) 4,24 ± 0,05
G1. Uji statistik kadar air antar bets dengan independent t-test
Formula F0 (Tanpa Ekstrak)
Group Statistics
Bets N Mean Std. Deviation Std. Error Mean
Kadar air Bets 1 3 6.4000 .03606 .02082
Bets 2 3 6.4300 .05292 .03055
Independent Samples Test
Levene's
Test for
Equality of
Variances t-test for Equality of Means
F Sig. t df
Sig.
(2-
tailed)
Mean
Difference
Std. Error
Difference
95% Confidence
Interval of the
Difference
Lower Upper
Kadar
air
Equal
variances
assumed
.842 .411 -.812 4 .463 -.03000 .03697 -.13264 .07264
Equal
variances
not assumed
-.812 3.528 .468 -.03000 .03697 -.13829 .07829
170
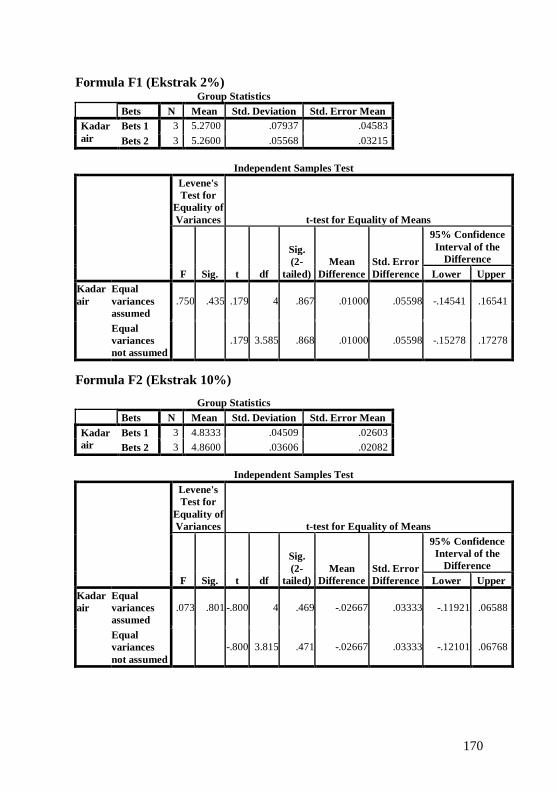
Formula F1 (Ekstrak 2%)
Group Statistics
Bets N Mean Std. Deviation Std. Error Mean
Kadar
air
Bets 1 3 5.2700 .07937 .04583
Bets 2 3 5.2600 .05568 .03215
Independent Samples Test
Levene's
Test for
Equality of
Variances t-test for Equality of Means
F Sig. t df
Sig.
(2-
tailed)
Mean
Difference
Std. Error
Difference
95% Confidence
Interval of the
Difference
Lower Upper
Kadar
air
Equal
variances
assumed
.750 .435 .179 4 .867 .01000 .05598 -.14541 .16541
Equal
variances
not assumed
.179 3.585 .868 .01000 .05598 -.15278 .17278
Formula F2 (Ekstrak 10%)
Group Statistics
Bets N Mean Std. Deviation Std. Error Mean
Kadar
air
Bets 1 3 4.8333 .04509 .02603
Bets 2 3 4.8600 .03606 .02082
Independent Samples Test
Levene's
Test for
Equality of
Variances t-test for Equality of Means
F Sig. t df
Sig.
(2-
tailed)
Mean
Difference
Std. Error
Difference
95% Confidence
Interval of the
Difference
Lower Upper
Kadar
air
Equal
variances
assumed
.073 .801 -.800 4 .469 -.02667 .03333 -.11921 .06588
Equal
variances
not assumed
-.800 3.815 .471 -.02667 .03333 -.12101 .06768
171
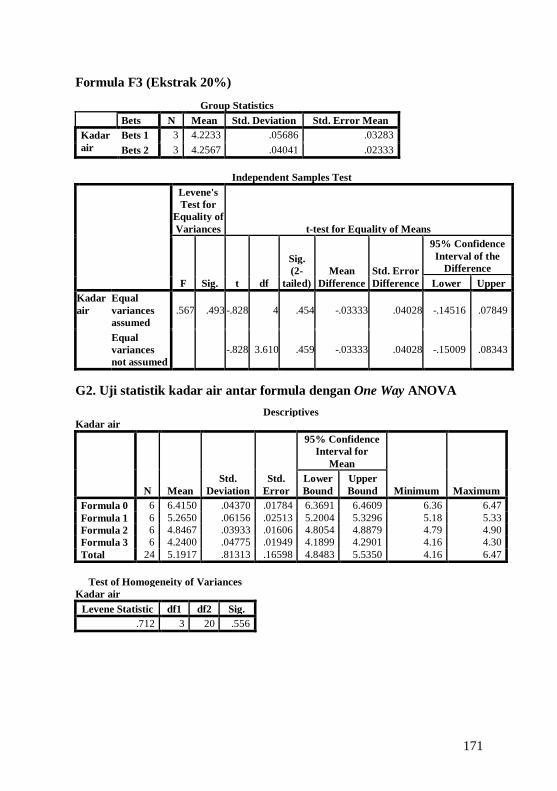
Formula F3 (Ekstrak 20%)
Group Statistics
Bets N Mean Std. Deviation Std. Error Mean
Kadar
air
Bets 1 3 4.2233 .05686 .03283
Bets 2 3 4.2567 .04041 .02333
Independent Samples Test
Levene's
Test for
Equality of
Variances t-test for Equality of Means
F Sig. t df
Sig.
(2-
tailed)
Mean
Difference
Std. Error
Difference
95% Confidence
Interval of the
Difference
Lower Upper
Kadar
air
Equal
variances
assumed
.567 .493 -.828 4 .454 -.03333 .04028 -.14516 .07849
Equal
variances
not assumed
-.828 3.610 .459 -.03333 .04028 -.15009 .08343
G2. Uji statistik kadar air antar formula dengan One Way ANOVA
Descriptives
Kadar air
N Mean
Std.
Deviation
Std.
Error
95% Confidence
Interval for
Mean
Minimum Maximum
Lower
Bound
Upper
Bound
Formula 0 6 6.4150 .04370 .01784 6.3691 6.4609 6.36 6.47
Formula 1 6 5.2650 .06156 .02513 5.2004 5.3296 5.18 5.33
Formula 2 6 4.8467 .03933 .01606 4.8054 4.8879 4.79 4.90
Formula 3 6 4.2400 .04775 .01949 4.1899 4.2901 4.16 4.30
Total 24 5.1917 .81313 .16598 4.8483 5.5350 4.16 6.47
Test of Homogeneity of Variances
Kadar air
Levene Statistic df1 df2 Sig.
.712 3 20 .556
172
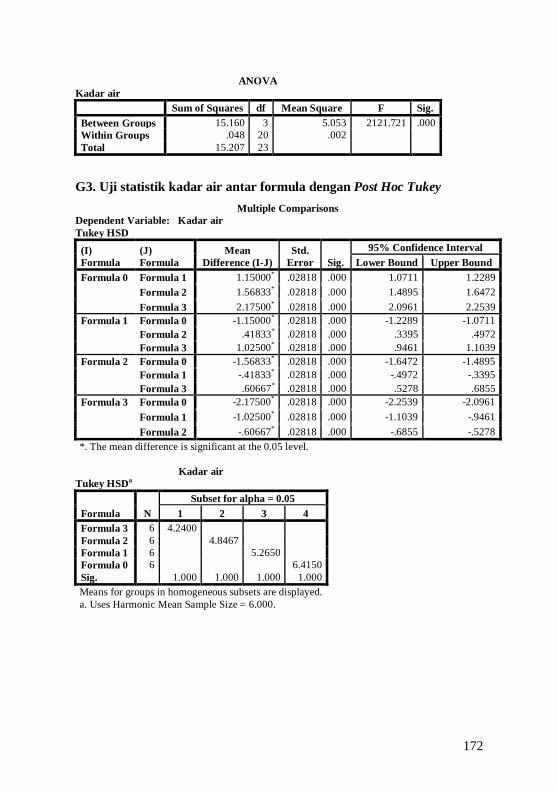
ANOVA
Kadar air
Sum of Squares df Mean Square F Sig.
Between Groups 15.160 3 5.053 2121.721 .000
Within Groups .048 20 .002
Total 15.207 23
G3. Uji statistik kadar air antar formula dengan Post Hoc Tukey
Multiple Comparisons
Dependent Variable: Kadar air
Tukey HSD
(I)
Formula
(J)
Formula
Mean
Difference (I-J)
Std.
Error Sig.
95% Confidence Interval
Lower Bound Upper Bound
Formula 0 Formula 1 1.15000* .02818 .000 1.0711 1.2289
Formula 2 1.56833* .02818 .000 1.4895 1.6472
Formula 3 2.17500* .02818 .000 2.0961 2.2539
Formula 1 Formula 0 -1.15000* .02818 .000 -1.2289 -1.0711
Formula 2 .41833* .02818 .000 .3395 .4972
Formula 3 1.02500* .02818 .000 .9461 1.1039
Formula 2 Formula 0 -1.56833* .02818 .000 -1.6472 -1.4895
Formula 1 -.41833* .02818 .000 -.4972 -.3395
Formula 3 .60667* .02818 .000 .5278 .6855
Formula 3 Formula 0 -2.17500* .02818 .000 -2.2539 -2.0961
Formula 1 -1.02500* .02818 .000 -1.1039 -.9461
Formula 2 -.60667* .02818 .000 -.6855 -.5278
*. The mean difference is significant at the 0.05 level.
Kadar air
Tukey HSDa
Formula N
Subset for alpha = 0.05
1 2 3 4
Formula 3 6 4.2400
Formula 2 6 4.8467
Formula 1 6 5.2650
Formula 0 6 6.4150
Sig. 1.000 1.000 1.000 1.000
Means for groups in homogeneous subsets are displayed.
a. Uses Harmonic Mean Sample Size = 6.000.

173
LAMPIRAN H
HASIL PENGUKURAN KEKERASAN SEDIAAN SABUN
TRANSPARAN EKSTRAK LABU KUNING (CUCURBITA
MOSCHATA)
Formula Triplo Bets 1 Bets 2 thitung ttabel Fhitung Ftabel
F0
1 0,01 0,03
0,500 2,776
2,698 3,10
2 0,03 0,02
3 0,02 0,02
X ± SD Bets (mm g/detik) 0,020 ± 0,0100 0,023 ± 0,0058
X ± SD Formula (mm
g/detik) 0,022 ± 0,0075
F1
1 0,01 0,02
0,000 2,776 2 0,02 0,01
3 0,01 0,01
X ± SD Bets (mm g/detik) 0,013 ± 0,0057 0,013 ± 0,0057
X ± SD Formula (mm
g/detik) 0,013 ± 0,0052
F2
1 0,02 0,02
0,707 2,776 2 0,01 0,02
3 0,01 0,01
X ± SD Bets (mm g/detik) 0,013 ± 0,0057 0,017 ± 0,0057
X ± SD Formula (mm
g/detik) 0,015 ± 0,0055
F3
1 0,02 0,02
0,000 2,776 2 0,01 0,01
3 0,01 0,01
X ± SD Bets (mm g/detik) 0,013 ± 0,0057 0,013 ± 0,0057
X ± SD Formula (mm
g/detik) 0,013 ± 0,0052
Keterangan: F0 = Sediaan tanpa ekstrak; F1 = Sediaan dengan ekstrak 2%; F2 = Sediaan
dengan ekstrak 10%; F3 = Sediaan dengan ekstrak 20%
H1. Uji statistik kekerasan antar bets dengan independent t-test
Formula F0 (Tanpa Ekstrak)
Group Statistics
Bets N Mean Std. Deviation Std. Error Mean
Kekerasan Bets 1 3 .0200 .01000 .00577
Bets 2 3 .0233 .00577 .00333
174
Independent Samples Test
Levene's
Test for
Equality of
Variances t-test for Equality of Means
F Sig. t Df
Sig.
(2-
tailed)
Mean
Difference
Std. Error
Difference
95% Confidence
Interval of the
Difference
Lower Upper
Kekerasan Equal
variances
assumed
.400 .561 -.500 4 .643 -.00333 .00667 -.02184 .01518
Equal
variances
not assumed
-.500 3.200 .649 -.00333 .00667 -.02382 .01715
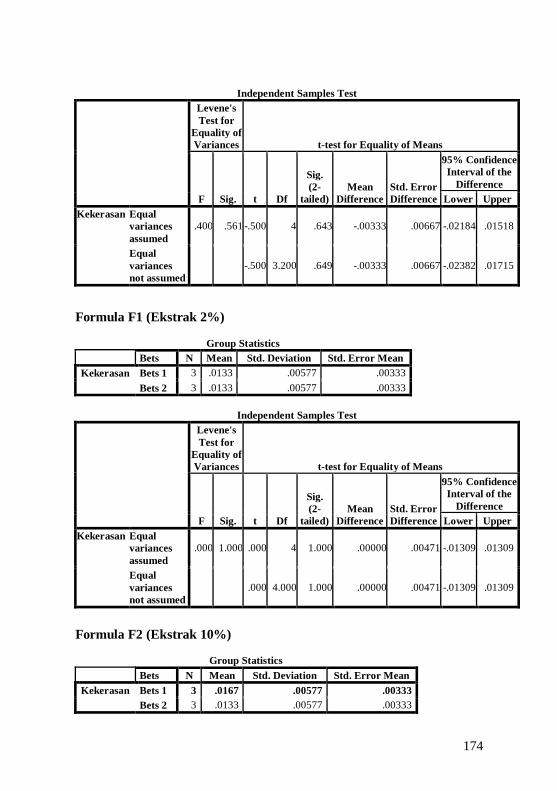
Formula F1 (Ekstrak 2%)
Group Statistics
Bets N Mean Std. Deviation Std. Error Mean
Kekerasan Bets 1 3 .0133 .00577 .00333
Bets 2 3 .0133 .00577 .00333
Independent Samples Test
Levene's
Test for
Equality of
Variances t-test for Equality of Means
F Sig. t Df
Sig.
(2-
tailed)
Mean
Difference
Std. Error
Difference
95% Confidence
Interval of the
Difference
Lower Upper
Kekerasan Equal
variances
assumed
.000 1.000 .000 4 1.000 .00000 .00471 -.01309 .01309
Equal
variances
not assumed
.000 4.000 1.000 .00000 .00471 -.01309 .01309
Formula F2 (Ekstrak 10%)
Group Statistics
Bets N Mean Std. Deviation Std. Error Mean
Kekerasan Bets 1 3 .0167 .00577 .00333
Bets 2 3 .0133 .00577 .00333
175
Independent Samples Test
Levene's
Test for
Equality of
Variances t-test for Equality of Means
F Sig. t df
Sig.
(2-
tailed)
Mean
Difference
Std. Error
Difference
95% Confidence
Interval of the
Difference
Lower Upper
Kekerasan Equal
variances
assumed
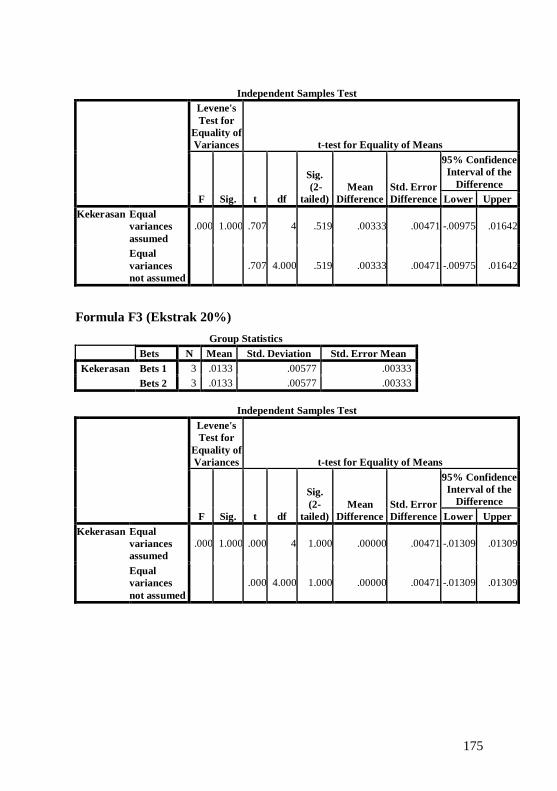
.000 1.000 .707 4 .519 .00333 .00471 -.00975 .01642
Equal
variances
not assumed
.707 4.000 .519 .00333 .00471 -.00975 .01642
Formula F3 (Ekstrak 20%)
Group Statistics
Bets N Mean Std. Deviation Std. Error Mean
Kekerasan Bets 1 3 .0133 .00577 .00333
Bets 2 3 .0133 .00577 .00333
Independent Samples Test
Levene's
Test for
Equality of
Variances t-test for Equality of Means
F Sig. t df
Sig.
(2-
tailed)
Mean
Difference
Std. Error
Difference
95% Confidence
Interval of the
Difference
Lower Upper
Kekerasan Equal
variances
assumed
.000 1.000 .000 4 1.000 .00000 .00471 -.01309 .01309
Equal
variances
not assumed
.000 4.000 1.000 .00000 .00471 -.01309 .01309

176
H2. Uji statistik kekerasan antar formula dengan One Way ANOVA
Descriptives
Kekerasan
N Mean
Std.
Deviation
Std.
Error
95% Confidence
Interval for Mean
Minimum Maximum
Lower
Bound
Upper
Bound
Formula 0 6 .0217 .00753 .00307 .0138 .0296 .01 .03
Formula 1 6 .0133 .00516 .00211 .0079 .0188 .01 .02
Formula 2 6 .0150 .00548 .00224 .0093 .0207 .01 .02
Formula 3 6 .0133 .00516 .00211 .0079 .0188 .01 .02
Total 24 .0158 .00654 .00133 .0131 .0186 .01 .03
Test of Homogeneity of Variances
Kekerasan
Levene Statistic df1 df2 Sig.
.266 3 20 .849
ANOVA
Kekerasan
Sum of
Squares Df
Mean
Square F Sig.
Between Groups .000 3 .000 2.698 .073
Within Groups .001 20 .000
Total .001 23
177
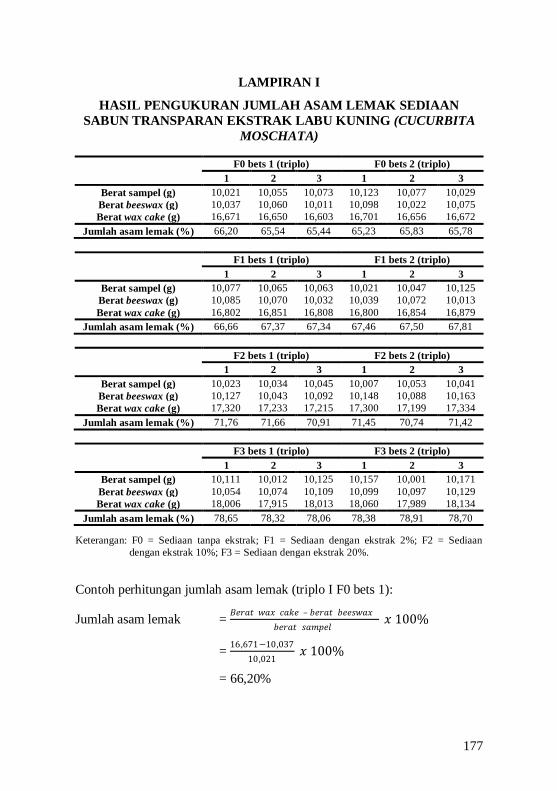
LAMPIRAN I
HASIL PENGUKURAN JUMLAH ASAM LEMAK SEDIAAN
SABUN TRANSPARAN EKSTRAK LABU KUNING (CUCURBITA
MOSCHATA)
F0 bets 1 (triplo) F0 bets 2 (triplo)
1 2 3 1 2 3
Berat sampel (g) 10,021 10,055 10,073 10,123 10,077 10,029
Berat beeswax (g) 10,037 10,060 10,011 10,098 10,022 10,075
Berat wax cake (g) 16,671 16,650 16,603 16,701 16,656 16,672
Jumlah asam lemak (%) 66,20 65,54 65,44 65,23 65,83 65,78
F1 bets 1 (triplo) F1 bets 2 (triplo)
1 2 3 1 2 3
Berat sampel (g) 10,077 10,065 10,063 10,021 10,047 10,125
Berat beeswax (g) 10,085 10,070 10,032 10,039 10,072 10,013
Berat wax cake (g) 16,802 16,851 16,808 16,800 16,854 16,879
Jumlah asam lemak (%) 66,66 67,37 67,34 67,46 67,50 67,81
F2 bets 1 (triplo) F2 bets 2 (triplo)
1 2 3 1 2 3
Berat sampel (g) 10,023 10,034 10,045 10,007 10,053 10,041
Berat beeswax (g) 10,127 10,043 10,092 10,148 10,088 10,163
Berat wax cake (g) 17,320 17,233 17,215 17,300 17,199 17,334
Jumlah asam lemak (%) 71,76 71,66 70,91 71,45 70,74 71,42
F3 bets 1 (triplo) F3 bets 2 (triplo)
1 2 3 1 2 3
Berat sampel (g) 10,111 10,012 10,125 10,157 10,001 10,171
Berat beeswax (g) 10,054 10,074 10,109 10,099 10,097 10,129
Berat wax cake (g) 18,006 17,915 18,013 18,060 17,989 18,134
Jumlah asam lemak (%) 78,65 78,32 78,06 78,38 78,91 78,70
Keterangan: F0 = Sediaan tanpa ekstrak; F1 = Sediaan dengan ekstrak 2%; F2 = Sediaan
dengan ekstrak 10%; F3 = Sediaan dengan ekstrak 20%.
Contoh perhitungan jumlah asam lemak (triplo I F0 bets 1):
Jumlah asam lemak = 𝐵𝑒𝑟𝑎𝑡 𝑤𝑎𝑥 𝑐𝑎𝑘𝑒 – 𝑏𝑒𝑟𝑎𝑡 𝑏𝑒𝑒𝑠𝑤𝑎𝑥
𝑏𝑒𝑟𝑎𝑡 𝑠𝑎𝑚𝑝𝑒𝑙 𝑥 100%
= 16,671−10,037
10,021 𝑥 100%
= 66,20%
178
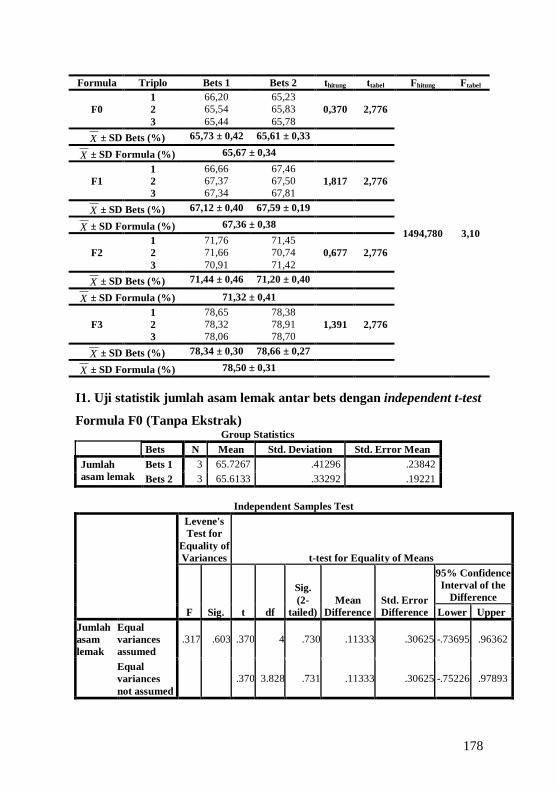
Formula Triplo Bets 1 Bets 2 thitung ttabel Fhitung Ftabel
F0
1 66,20 65,23
0,370 2,776
1494,780 3,10
2 65,54 65,83
3 65,44 65,78
X ± SD Bets (%) 65,73 ± 0,42 65,61 ± 0,33
X ± SD Formula (%) 65,67 ± 0,34
F1
1 66,66 67,46
1,817 2,776 2 67,37 67,50
3 67,34 67,81
X ± SD Bets (%) 67,12 ± 0,40 67,59 ± 0,19
X ± SD Formula (%) 67,36 ± 0,38
F2
1 71,76 71,45
0,677 2,776 2 71,66 70,74
3 70,91 71,42
X ± SD Bets (%) 71,44 ± 0,46 71,20 ± 0,40
X ± SD Formula (%) 71,32 ± 0,41
F3
1 78,65 78,38
1,391 2,776 2 78,32 78,91
3 78,06 78,70
X ± SD Bets (%) 78,34 ± 0,30 78,66 ± 0,27
X ± SD Formula (%) 78,50 ± 0,31
I1. Uji statistik jumlah asam lemak antar bets dengan independent t-test
Formula F0 (Tanpa Ekstrak)
Group Statistics
Bets N Mean Std. Deviation Std. Error Mean
Jumlah
asam lemak
Bets 1 3 65.7267 .41296 .23842
Bets 2 3 65.6133 .33292 .19221
Independent Samples Test
Levene's
Test for
Equality of
Variances t-test for Equality of Means
F Sig. t df
Sig.
(2-
tailed)
Mean
Difference
Std. Error
Difference
95% Confidence
Interval of the
Difference
Lower Upper
Jumlah
asam
lemak
Equal
variances
assumed
.317 .603 .370 4 .730 .11333 .30625 -.73695 .96362
Equal
variances
not assumed
.370 3.828 .731 .11333 .30625 -.75226 .97893

179
Formula F1 (Ekstrak 2%)
Group Statistics
Bets N Mean Std. Deviation Std. Error Mean
Jumlah asam
lemak
Bets 1 3 67.1233 .40154 .23183
Bets 2 3 67.5900 .19157 .11060
Independent Samples Test
Levene's Test
for Equality
of Variances t-test for Equality of Means
F Sig. t df
Sig.
(2-
tailed)
Mean
Difference
Std. Error
Difference
95% Confidence
Interval of the
Difference
Lower Upper
Jumlah
asam
lemak
Equal
variances
assumed
3.501 .135 -1.817 4 .143 -.46667 .25686 -1.17983 .24649
Equal
variances
not
assumed
-1.817 2.866 .171 -.46667 .25686 -1.30623 .37290
Formula F2 (Ekstrak 10%)
Group Statistics
Bets N Mean Std. Deviation Std. Error Mean
Jumlah
asam lemak
Bets 1 3 71.4433 .46458 .26822
Bets 2 3 71.2033 .40154 .23183
Independent Samples Test
Levene's Test
for Equality of
Variances t-test for Equality of Means
F Sig. t df
Sig.
(2-
tailed)
Mean
Difference
Std. Error
Difference
95%
Confidence
Interval of the
Difference
Lower Upper
Jumlah
asam
lemak
Equal
variances
assumed
.147 .721 .677 4 .536 .24000 .35453 -.74432 1.22432
Equal
variances
not
assumed
.677 3.918 .536 .24000 .35453 -.75252 1.23252
180
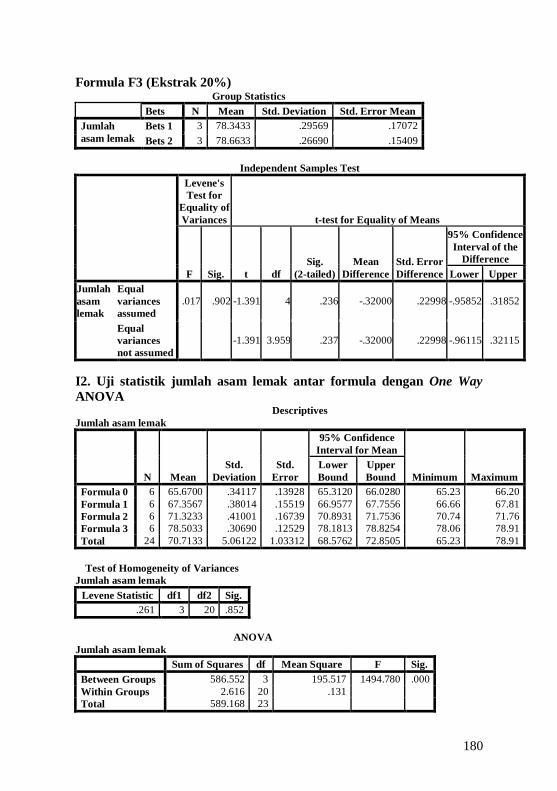
Formula F3 (Ekstrak 20%)
Group Statistics
Bets N Mean Std. Deviation Std. Error Mean
Jumlah
asam lemak
Bets 1 3 78.3433 .29569 .17072
Bets 2 3 78.6633 .26690 .15409
Independent Samples Test
Levene's
Test for
Equality of
Variances t-test for Equality of Means
F Sig. t df
Sig.
(2-tailed)
Mean
Difference
Std. Error
Difference
95% Confidence
Interval of the
Difference
Lower Upper
Jumlah
asam
lemak
Equal
variances
assumed
.017 .902 -1.391 4 .236 -.32000 .22998 -.95852 .31852
Equal
variances
not assumed
-1.391 3.959 .237 -.32000 .22998 -.96115 .32115
I2. Uji statistik jumlah asam lemak antar formula dengan One Way
ANOVA Descriptives
Jumlah asam lemak
N Mean
Std.
Deviation
Std.
Error
95% Confidence
Interval for Mean
Minimum Maximum
Lower
Bound
Upper
Bound
Formula 0 6 65.6700 .34117 .13928 65.3120 66.0280 65.23 66.20
Formula 1 6 67.3567 .38014 .15519 66.9577 67.7556 66.66 67.81
Formula 2 6 71.3233 .41001 .16739 70.8931 71.7536 70.74 71.76
Formula 3 6 78.5033 .30690 .12529 78.1813 78.8254 78.06 78.91
Total 24 70.7133 5.06122 1.03312 68.5762 72.8505 65.23 78.91
Test of Homogeneity of Variances
Jumlah asam lemak
Levene Statistic df1 df2 Sig.
.261 3 20 .852
ANOVA
Jumlah asam lemak
Sum of Squares df Mean Square F Sig.
Between Groups 586.552 3 195.517 1494.780 .000
Within Groups 2.616 20 .131
Total 589.168 23
181
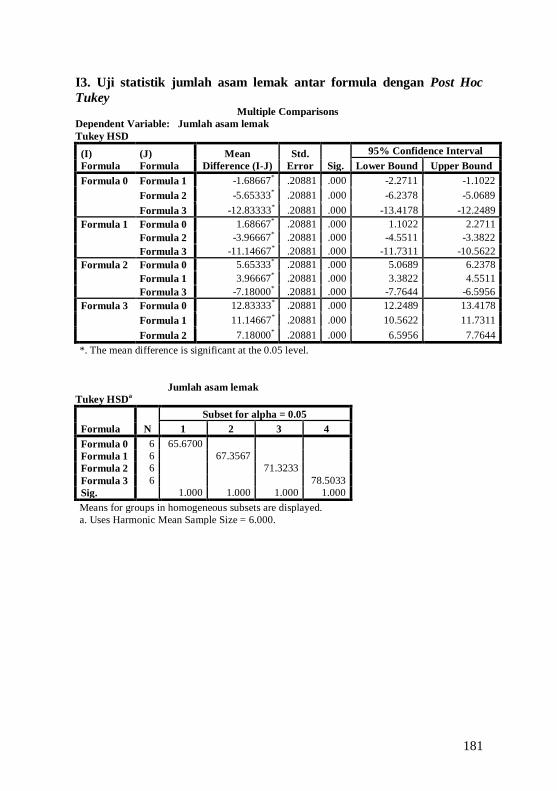
I3. Uji statistik jumlah asam lemak antar formula dengan Post Hoc
Tukey Multiple Comparisons
Dependent Variable: Jumlah asam lemak
Tukey HSD
(I)
Formula
(J)
Formula
Mean
Difference (I-J)
Std.
Error Sig.
95% Confidence Interval
Lower Bound Upper Bound
Formula 0 Formula 1 -1.68667* .20881 .000 -2.2711 -1.1022
Formula 2 -5.65333* .20881 .000 -6.2378 -5.0689
Formula 3 -12.83333* .20881 .000 -13.4178 -12.2489
Formula 1 Formula 0 1.68667* .20881 .000 1.1022 2.2711
Formula 2 -3.96667* .20881 .000 -4.5511 -3.3822
Formula 3 -11.14667* .20881 .000 -11.7311 -10.5622
Formula 2 Formula 0 5.65333* .20881 .000 5.0689 6.2378
Formula 1 3.96667* .20881 .000 3.3822 4.5511
Formula 3 -7.18000* .20881 .000 -7.7644 -6.5956
Formula 3 Formula 0 12.83333* .20881 .000 12.2489 13.4178
Formula 1 11.14667* .20881 .000 10.5622 11.7311
Formula 2 7.18000* .20881 .000 6.5956 7.7644
*. The mean difference is significant at the 0.05 level.
Jumlah asam lemak
Tukey HSDa
Formula N
Subset for alpha = 0.05
1 2 3 4
Formula 0 6 65.6700
Formula 1 6 67.3567
Formula 2 6 71.3233
Formula 3 6 78.5033
Sig. 1.000 1.000 1.000 1.000
Means for groups in homogeneous subsets are displayed.
a. Uses Harmonic Mean Sample Size = 6.000.

182
I4. Skema kerja pengujian jumlah asam lemak
Perhitungan larutan H2SO4 20% 150 ml
Mr H2SO4 = 98 g/mol. Konsentrasi H2SO4 pekat = 97%
N = 𝑔
𝑀𝑟 x
1000
𝑉𝑝𝑒𝑙 x ρ x valensi
Normalitas H2SO4 pekat = 97
98 x
1000
100 x 1,84 x 2 = 36,4245 N
Normalitas H2SO4 20% = 20
98 x
1000
100 x 1,84 x 2 = 7,5102 N
V1N1 = V2N2
150 x 7,5102 = V2 x 36,4245
V2 = 30,9278 ml + akuades ad 150 ml
+ metil jingga, + H2SO4 20% ad merah
+ 100 ml akuades, dipanaskan di hot plate
10 g sediaan dalam beker 250 ml
Ditutup dengan gelas arloji, dipanaskan ada terbentuk 2 lapisan jernih
+ 10 g beeswax, dipanaskan ad jernih
Wax cake dikeluarkan dan ditimbang
183
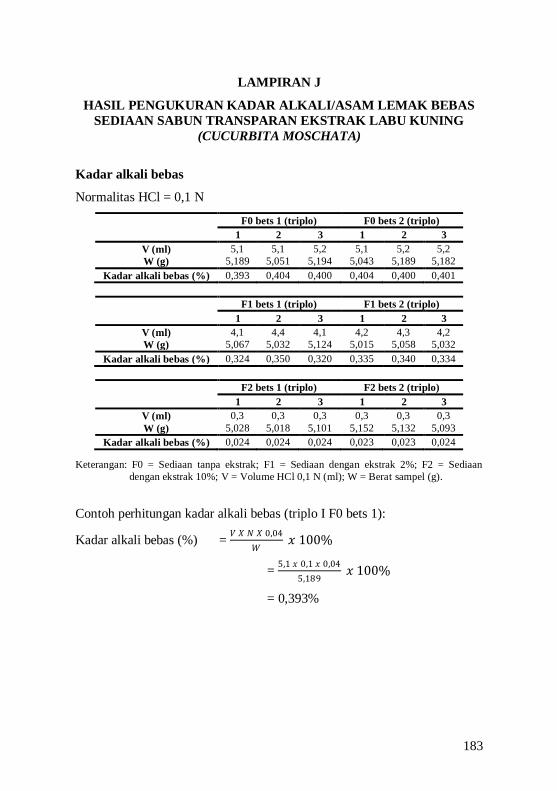
LAMPIRAN J
HASIL PENGUKURAN KADAR ALKALI/ASAM LEMAK BEBAS
SEDIAAN SABUN TRANSPARAN EKSTRAK LABU KUNING
(CUCURBITA MOSCHATA)
Kadar alkali bebas
Normalitas HCl = 0,1 N
F0 bets 1 (triplo) F0 bets 2 (triplo)
1 2 3 1 2 3
V (ml) 5,1 5,1 5,2 5,1 5,2 5,2
W (g) 5,189 5,051 5,194 5,043 5,189 5,182
Kadar alkali bebas (%) 0,393 0,404 0,400 0,404 0,400 0,401
F1 bets 1 (triplo) F1 bets 2 (triplo)
1 2 3 1 2 3
V (ml) 4,1 4,4 4,1 4,2 4,3 4,2
W (g) 5,067 5,032 5,124 5,015 5,058 5,032
Kadar alkali bebas (%) 0,324 0,350 0,320 0,335 0,340 0,334
F2 bets 1 (triplo) F2 bets 2 (triplo)
1 2 3 1 2 3
V (ml) 0,3 0,3 0,3 0,3 0,3 0,3
W (g) 5,028 5,018 5,101 5,152 5,132 5,093
Kadar alkali bebas (%) 0,024 0,024 0,024 0,023 0,023 0,024
Keterangan: F0 = Sediaan tanpa ekstrak; F1 = Sediaan dengan ekstrak 2%; F2 = Sediaan
dengan ekstrak 10%; V = Volume HCl 0,1 N (ml); W = Berat sampel (g).
Contoh perhitungan kadar alkali bebas (triplo I F0 bets 1):
Kadar alkali bebas (%) = 𝑉 𝑋 𝑁 𝑋 0,04
𝑊 𝑥 100%
= 5,1 𝑥 0,1 𝑥 0,04
5,189 𝑥 100%
= 0,393%
184
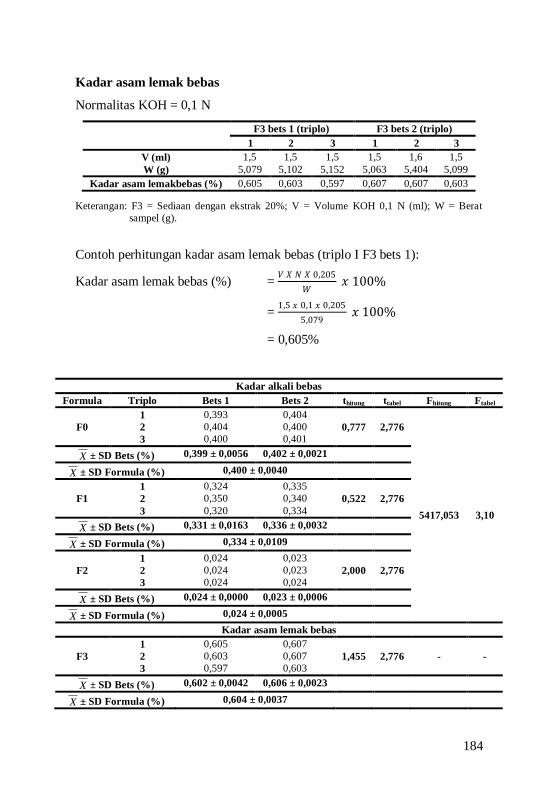
Kadar asam lemak bebas
Normalitas KOH = 0,1 N
F3 bets 1 (triplo) F3 bets 2 (triplo)
1 2 3 1 2 3
V (ml) 1,5 1,5 1,5 1,5 1,6 1,5
W (g) 5,079 5,102 5,152 5,063 5,404 5,099
Kadar asam lemakbebas (%) 0,605 0,603 0,597 0,607 0,607 0,603
Keterangan: F3 = Sediaan dengan ekstrak 20%; V = Volume KOH 0,1 N (ml); W = Berat
sampel (g).
Contoh perhitungan kadar asam lemak bebas (triplo I F3 bets 1):
Kadar asam lemak bebas (%) = 𝑉 𝑋 𝑁 𝑋 0,205
𝑊 𝑥 100%
= 1,5 𝑥 0,1 𝑥 0,205
5,079 𝑥 100%
= 0,605%
Kadar alkali bebas
Formula Triplo Bets 1 Bets 2 thitung ttabel Fhitung Ftabel
F0
1 0,393 0,404
0,777 2,776
5417,053 3,10
2 0,404 0,400
3 0,400 0,401
X ± SD Bets (%) 0,399 ± 0,0056 0,402 ± 0,0021
X ± SD Formula (%) 0,400 ± 0,0040
F1
1 0,324 0,335
0,522 2,776 2 0,350 0,340
3 0,320 0,334
X ± SD Bets (%) 0,331 ± 0,0163 0,336 ± 0,0032
X ± SD Formula (%) 0,334 ± 0,0109
F2
1 0,024 0,023
2,000 2,776 2 0,024 0,023
3 0,024 0,024
X ± SD Bets (%) 0,024 ± 0,0000 0,023 ± 0,0006
X ± SD Formula (%) 0,024 ± 0,0005
Kadar asam lemak bebas
F3
1 0,605 0,607
1,455 2,776
2 0,603 0,607 - -
3 0,597 0,603
X ± SD Bets (%) 0,602 ± 0,0042 0,606 ± 0,0023
X ± SD Formula (%) 0,604 ± 0,0037
185
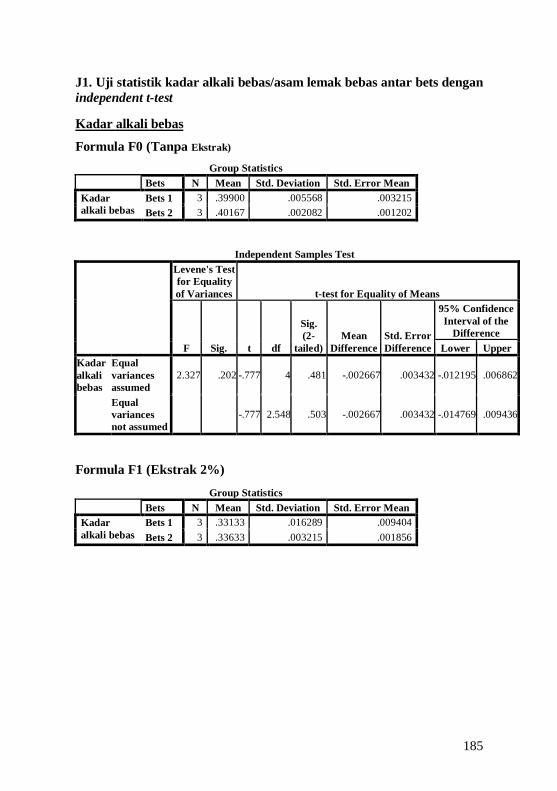
J1. Uji statistik kadar alkali bebas/asam lemak bebas antar bets dengan
independent t-test
Kadar alkali bebas
Formula F0 (Tanpa Ekstrak)
Group Statistics
Bets N Mean Std. Deviation Std. Error Mean
Kadar
alkali bebas
Bets 1 3 .39900 .005568 .003215
Bets 2 3 .40167 .002082 .001202
Independent Samples Test
Levene's Test
for Equality
of Variances t-test for Equality of Means
F Sig. t df
Sig.
(2-
tailed)
Mean
Difference
Std. Error
Difference
95% Confidence
Interval of the
Difference
Lower Upper
Kadar
alkali
bebas
Equal
variances
assumed
2.327 .202 -.777 4 .481 -.002667 .003432 -.012195 .006862
Equal
variances
not assumed
-.777 2.548 .503 -.002667 .003432 -.014769 .009436
Formula F1 (Ekstrak 2%)
Group Statistics
Bets N Mean Std. Deviation Std. Error Mean
Kadar
alkali bebas
Bets 1 3 .33133 .016289 .009404
Bets 2 3 .33633 .003215 .001856
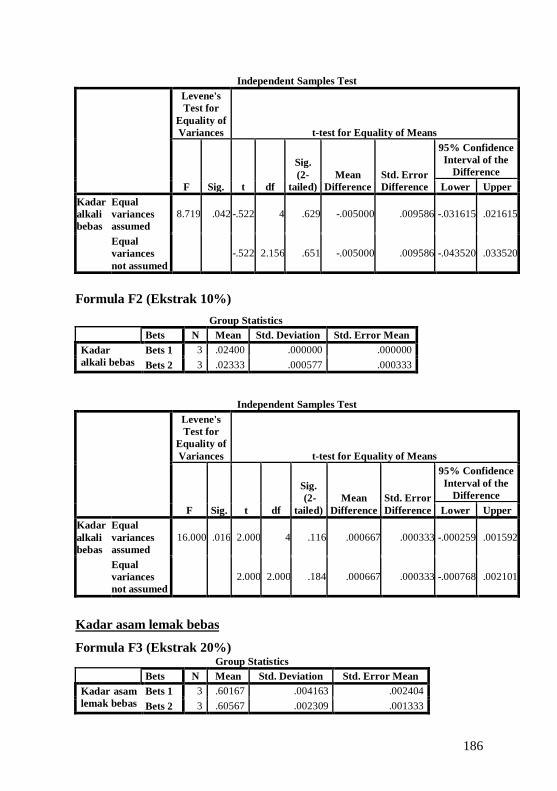
186
Independent Samples Test
Levene's
Test for
Equality of
Variances t-test for Equality of Means
F Sig. t df
Sig.
(2-
tailed)
Mean
Difference
Std. Error
Difference
95% Confidence
Interval of the
Difference
Lower Upper
Kadar
alkali
bebas
Equal
variances
assumed
8.719 .042 -.522 4 .629 -.005000 .009586 -.031615 .021615
Equal
variances
not assumed
-.522 2.156 .651 -.005000 .009586 -.043520 .033520
Formula F2 (Ekstrak 10%)
Group Statistics
Bets N Mean Std. Deviation Std. Error Mean
Kadar
alkali bebas
Bets 1 3 .02400 .000000 .000000
Bets 2 3 .02333 .000577 .000333
Independent Samples Test
Levene's
Test for
Equality of
Variances t-test for Equality of Means
F Sig. t df
Sig.
(2-
tailed)
Mean
Difference
Std. Error
Difference
95% Confidence
Interval of the
Difference
Lower Upper
Kadar
alkali
bebas
Equal
variances
assumed
16.000 .016 2.000 4 .116 .000667 .000333 -.000259 .001592
Equal
variances
not assumed
2.000 2.000 .184 .000667 .000333 -.000768 .002101
Kadar asam lemak bebas
Formula F3 (Ekstrak 20%) Group Statistics
Bets N Mean Std. Deviation Std. Error Mean
Kadar asam
lemak bebas
Bets 1 3 .60167 .004163 .002404
Bets 2 3 .60567 .002309 .001333
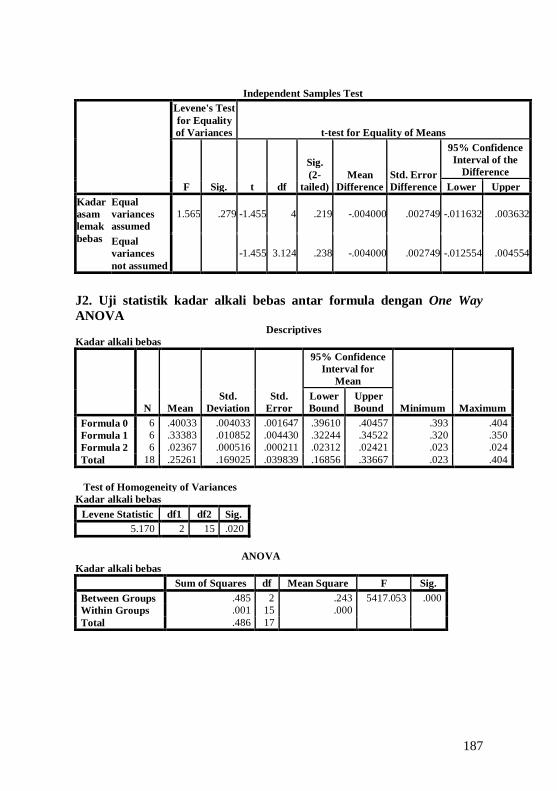
187
Independent Samples Test
Levene's Test
for Equality
of Variances t-test for Equality of Means
F Sig. t df
Sig.
(2-
tailed)
Mean
Difference
Std. Error
Difference
95% Confidence
Interval of the
Difference
Lower Upper
Kadar
asam
lemak
bebas
Equal
variances
assumed
1.565 .279 -1.455 4 .219 -.004000 .002749 -.011632 .003632
Equal
variances
not assumed
-1.455 3.124 .238 -.004000 .002749 -.012554 .004554
J2. Uji statistik kadar alkali bebas antar formula dengan One Way
ANOVA
Descriptives
Kadar alkali bebas
N Mean
Std.
Deviation
Std.
Error
95% Confidence
Interval for
Mean
Minimum Maximum
Lower
Bound
Upper
Bound
Formula 0 6 .40033 .004033 .001647 .39610 .40457 .393 .404
Formula 1 6 .33383 .010852 .004430 .32244 .34522 .320 .350
Formula 2 6 .02367 .000516 .000211 .02312 .02421 .023 .024
Total 18 .25261 .169025 .039839 .16856 .33667 .023 .404
Test of Homogeneity of Variances
Kadar alkali bebas
Levene Statistic df1 df2 Sig.
5.170 2 15 .020
ANOVA
Kadar alkali bebas
Sum of Squares df Mean Square F Sig.
Between Groups .485 2 .243 5417.053 .000
Within Groups .001 15 .000
Total .486 17

188
J3. Uji statistik kadar alkali bebas antar formula dengan Post Hoc
Tukey Multiple Comparisons
Dependent Variable: Kadar alkali bebas
Tukey HSD
(I)
Formula (J) Formula
Mean
Difference (I-J)
Std.
Error Sig.
95% Confidence
Interval
Lower
Bound
Upper
Bound
Formula 0 Formula 1 .066500* .003863 .000 .05647 .07653
Formula 2 .376667* .003863 .000 .36663 .38670
Formula 1 Formula 0 -.066500* .003863 .000 -.07653 -.05647
Formula 2 .310167* .003863 .000 .30013 .32020
Formula 2 Formula 0 -.376667* .003863 .000 -.38670 -.36663
Formula 1 -.310167* .003863 .000 -.32020 -.30013
*. The mean difference is significant at the 0.05 level.
Kadar alkali bebas
Tukey HSDa
Formula N
Subset for alpha = 0.05
1 2 3
Formula 2 6 .02367
Formula 1 6 .33383
Formula 0 6 .40033
Sig. 1.000 1.000 1.000
Means for groups in homogeneous subsets are
displayed.
a. Uses Harmonic Mean Sample Size = 6.000.
J4. Skema kerja pengujian kadar alkali/asam lemak bebas.
Berwarna merah
Titrasi dengan HCl 0,1 N
atau
Tidak berwarna merah
Titrasi dengan KOH 0,1 N
Kadar alkali bebas Kadar asam lemak bebas
+ 5 g sediaan
Alkohol netral
100 ml alkohol dihangatkan + fenolftalein + KOH 0,1 N
direfluks selama 30 menit

189
Perhitungan larutan KOH 0,1 N alkoholis 150 ml
Mr KOH = 56 g/mol
N = 𝑔
𝑀𝑟 x
1000
𝑉𝑝𝑒𝑙 x valensi
KOH 0,1 N = 𝑥
56 x
1000
150 x 1
x = 1,1905 g + etanol 96% ad 150 ml
Perhitungan larutan HCl 0,1 N alkoholis 300 ml
Normalitas HCl pekat = 12 N
V1N1 = V2N2
300 x 0,1 = V2 x 12
V2 = 2,5 ml + etanol 96% ad 300 ml
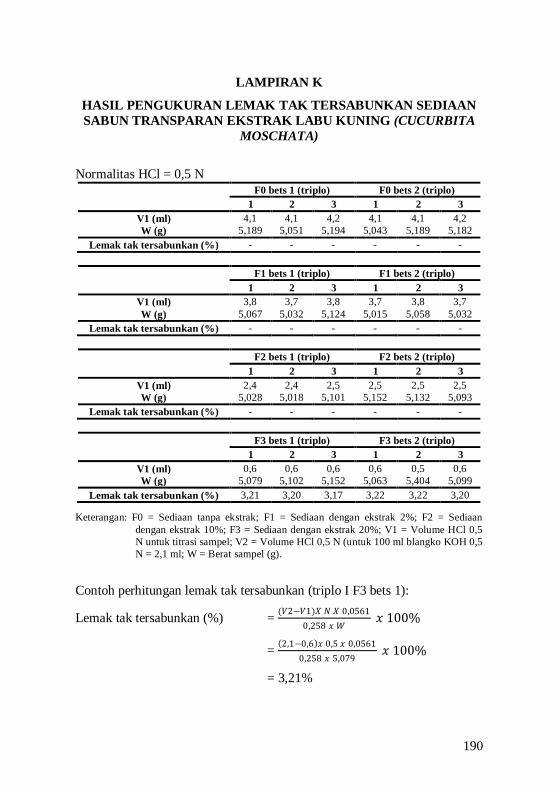
190
LAMPIRAN K
HASIL PENGUKURAN LEMAK TAK TERSABUNKAN SEDIAAN
SABUN TRANSPARAN EKSTRAK LABU KUNING (CUCURBITA
MOSCHATA)
Normalitas HCl = 0,5 N
F0 bets 1 (triplo) F0 bets 2 (triplo)
1 2 3 1 2 3
V1 (ml) 4,1 4,1 4,2 4,1 4,1 4,2
W (g) 5,189 5,051 5,194 5,043 5,189 5,182
Lemak tak tersabunkan (%) - - - - - -
F1 bets 1 (triplo) F1 bets 2 (triplo)
1 2 3 1 2 3
V1 (ml) 3,8 3,7 3,8 3,7 3,8 3,7
W (g) 5,067 5,032 5,124 5,015 5,058 5,032
Lemak tak tersabunkan (%) - - - - - -
F2 bets 1 (triplo) F2 bets 2 (triplo)
1 2 3 1 2 3
V1 (ml) 2,4 2,4 2,5 2,5 2,5 2,5
W (g) 5,028 5,018 5,101 5,152 5,132 5,093
Lemak tak tersabunkan (%) - - - - - -
F3 bets 1 (triplo) F3 bets 2 (triplo)
1 2 3 1 2 3
V1 (ml) 0,6 0,6 0,6 0,6 0,5 0,6
W (g) 5,079 5,102 5,152 5,063 5,404 5,099
Lemak tak tersabunkan (%) 3,21 3,20 3,17 3,22 3,22 3,20
Keterangan: F0 = Sediaan tanpa ekstrak; F1 = Sediaan dengan ekstrak 2%; F2 = Sediaan
dengan ekstrak 10%; F3 = Sediaan dengan ekstrak 20%; V1 = Volume HCl 0,5
N untuk titrasi sampel; V2 = Volume HCl 0,5 N (untuk 100 ml blangko KOH 0,5
N = 2,1 ml; W = Berat sampel (g).
Contoh perhitungan lemak tak tersabunkan (triplo I F3 bets 1):
Lemak tak tersabunkan (%) = (𝑉2−𝑉1)𝑋 𝑁 𝑋 0,0561
0,258 𝑥 𝑊 𝑥 100%
= 2,1−0,6 𝑥 0,5 𝑥 0,0561
0,258 𝑥 5,079 𝑥 100%
= 3,21%
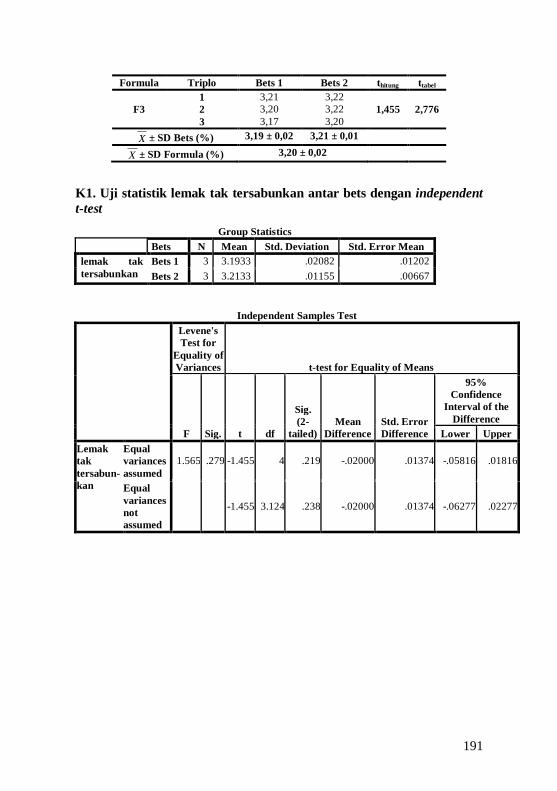
191
Formula Triplo Bets 1 Bets 2 thitung ttabel
F3
1 3,21 3,22
1,455 2,776 2 3,20 3,22
3 3,17 3,20
X ± SD Bets (%) 3,19 ± 0,02 3,21 ± 0,01
X ± SD Formula (%) 3,20 ± 0,02
K1. Uji statistik lemak tak tersabunkan antar bets dengan independent
t-test
Group Statistics
Bets N Mean Std. Deviation Std. Error Mean
lemak tak
tersabunkan
Bets 1 3 3.1933 .02082 .01202
Bets 2 3 3.2133 .01155 .00667
Independent Samples Test
Levene's
Test for
Equality of
Variances t-test for Equality of Means
F Sig. t df
Sig.
(2-
tailed)
Mean
Difference
Std. Error
Difference
95%
Confidence
Interval of the
Difference
Lower Upper
Lemak
tak
tersabun-
kan
Equal
variances
assumed
1.565 .279 -1.455 4 .219 -.02000 .01374 -.05816 .01816
Equal
variances
not
assumed
-1.455 3.124 .238 -.02000 .01374 -.06277 .02277
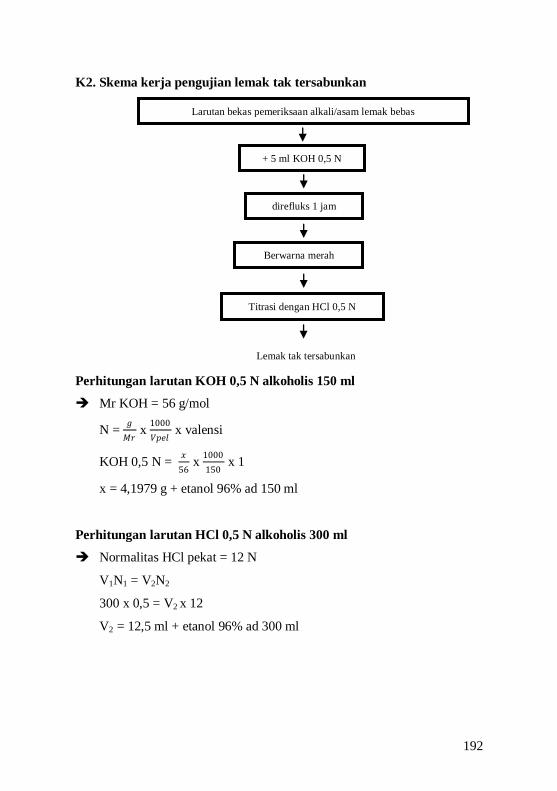
192
K2. Skema kerja pengujian lemak tak tersabunkan
Perhitungan larutan KOH 0,5 N alkoholis 150 ml
Mr KOH = 56 g/mol
N = 𝑔
𝑀𝑟 x
1000
𝑉𝑝𝑒𝑙 x valensi
KOH 0,5 N = 𝑥
56 x
1000
150 x 1
x = 4,1979 g + etanol 96% ad 150 ml
Perhitungan larutan HCl 0,5 N alkoholis 300 ml
Normalitas HCl pekat = 12 N
V1N1 = V2N2
300 x 0,5 = V2 x 12
V2 = 12,5 ml + etanol 96% ad 300 ml
direfluks 1 jam
+ 5 ml KOH 0,5 N
Larutan bekas pemeriksaan alkali/asam lemak bebas
Berwarna merah
Titrasi dengan HCl 0,5 N
Lemak tak tersabunkan
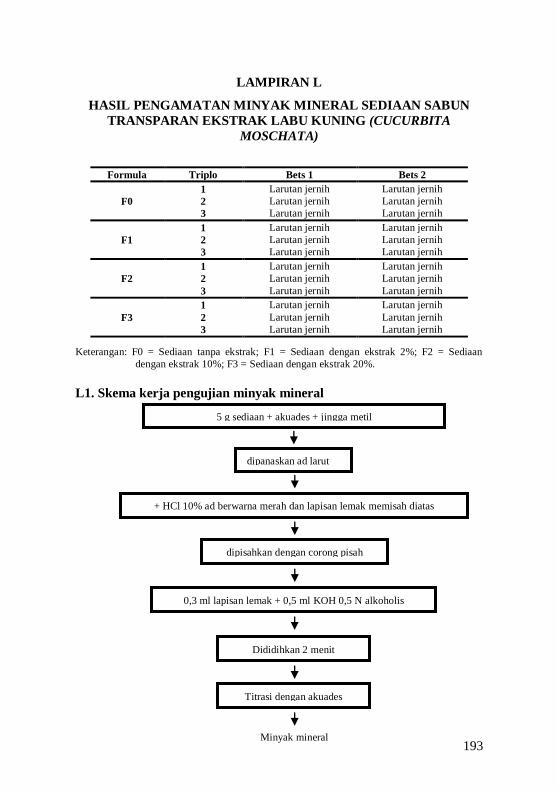
193
LAMPIRAN L
HASIL PENGAMATAN MINYAK MINERAL SEDIAAN SABUN
TRANSPARAN EKSTRAK LABU KUNING (CUCURBITA
MOSCHATA)
Formula Triplo Bets 1 Bets 2
F0
1 Larutan jernih Larutan jernih
2 Larutan jernih Larutan jernih
3 Larutan jernih Larutan jernih
F1
1 Larutan jernih Larutan jernih
2 Larutan jernih Larutan jernih
3 Larutan jernih Larutan jernih
F2
1 Larutan jernih Larutan jernih
2 Larutan jernih Larutan jernih
3 Larutan jernih Larutan jernih
F3
1 Larutan jernih Larutan jernih
2 Larutan jernih Larutan jernih
3 Larutan jernih Larutan jernih
Keterangan: F0 = Sediaan tanpa ekstrak; F1 = Sediaan dengan ekstrak 2%; F2 = Sediaan
dengan ekstrak 10%; F3 = Sediaan dengan ekstrak 20%.
L1. Skema kerja pengujian minyak mineral
+ HCl 10% ad berwarna merah dan lapisan lemak memisah diatas
dipanaskan ad larut
5 g sediaan + akuades + jingga metil
dipisahkan dengan corong pisah
0,3 ml lapisan lemak + 0,5 ml KOH 0,5 N alkoholis
Minyak mineral
Dididihkan 2 menit
Titrasi dengan akuades
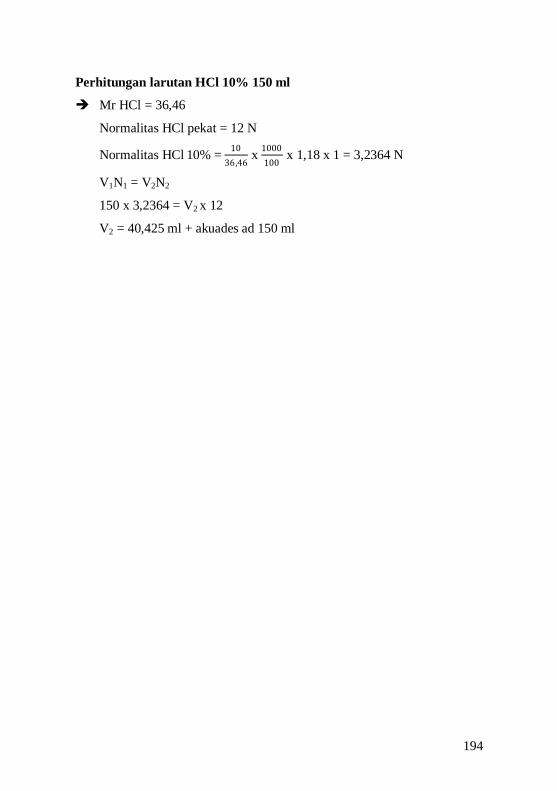
194
Perhitungan larutan HCl 10% 150 ml
Mr HCl = 36,46
Normalitas HCl pekat = 12 N
Normalitas HCl 10% = 10
36,46 x
1000
100 x 1,18 x 1 = 3,2364 N
V1N1 = V2N2
150 x 3,2364 = V2 x 12
V2 = 40,425 ml + akuades ad 150 ml

195
LAMPIRAN M
HASIL PENGAMATAN STABILITAS FISIK SEDIAAN SABUN
TRANSPARAN EKSTRAK LABU KUNING (CUCURBITA
MOSCHATA)
A. pH
Formula Bets Triplo Minggu I Minggu II Minggu III Minggu IV
F0
1
1 10,38 10,33 10,35 10,31
2 10,36 10,39 10,30 10,37
3 10,38 10,37 10,33 10,36
X ± SD Bets 10,37 ± 0,01 10,36 ± 0,03 10,33 ± 0,03 10,35 ± 0,03
2
1 10,33 10,37 10,33 10,32
2 10,36 10,39 10,33 10,35
3 10,35 10,41 10,32 10,36
X ± SD Bets 10,35 ± 0,02 10,39 ± 0,02 10,33 ± 0,01 10,34 ± 0,02
X ± SD Formula 10,36 ± 0,02 10,38 ± 0,03 10,33 ± 0,02 10,35 ± 0,02
F1
1
1 10,22 10,23 10,19 10,06
2 10,24 10,22 10,12 10,02
3 10,22 10,18 10,17 10,09
X ± SD Bets 10,23 ± 0,01 10,21 ± 0,03 10,16 ± 0,04 10,06 ± 0,04
2
1 10,24 10,21 10,18 10,06
2 10,23 10,24 10,13 10,10
3 10,24 10,23 10,17 10,11
X ± SD Bets 10,23 ± 0,01 10,23 ± 0,02 10,16 ± 0,03 10,09 ± 0,03
X ± SD Formula 10,23 ± 0,01 10,22 ± 0,02 10,16 ± 0,03 10,07 ± 0,03
F2
1
1 9,32 9,33 9,27 9,19
2 9,38 9,35 9,27 9,16
3 9,31 9,35 9,30 9,15
X ± SD Bets 9,34 ± 0,04 9,34 ± 0,01 9,28 ± 0,02 9,17 ± 0,02
2
1 9,35 9,33 9,27 9,22
2 9,34 9,30 9,31 9,18
3 9,37 9,31 9,28 9,19
X ± SD Bets 9,35 ± 0,02 9,31 ± 0,02 9,29 ± 0,02 9,19 ± 0,01
X ± SD Formula 9,35 ± 0,03 9,33 ± 0,02 9,28 ± 0,02 9,18 ± 0,02
F3
1
1 9,05 9,03 9,01 8,97
2 9,05 9,02 8,98 8,97
3 9,02 9,05 9,01 8,90
X ± SD Bets 9,04 ± 0,02 9,03 ± 0,02 9,00 ± 0,02 8,95 ± 0,04
2
1 9,03 9,01 9,08 8,97
2 9,06 9,04 9,07 8,91
3 9,02 9,05 9,16 8,98
X ± SD Bets 9,04 ± 0,02 9,03 ± 0,02 9,10 ± 0,05 8,95 ± 0,04
X ± SD Formula 9,04 ± 0,02 9,03 ± 0,02 9,05 ± 0,07 8,95 ± 0,04
Keterangan: F0 (blangko tanpa ekstrak), F1 (sediaan dengan ekstrak 2%), F2 (sediaan dengan
ekstrak 10%), F3 (sediaan dengan ekstrak 20%).
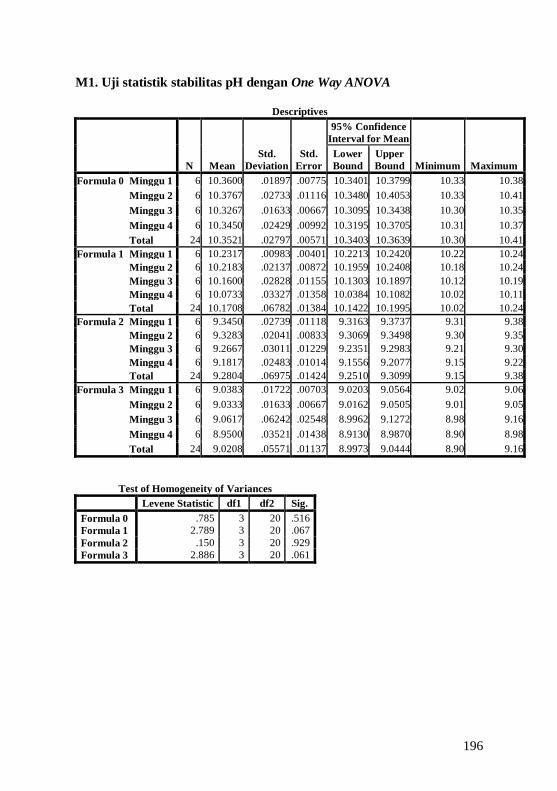
196
M1. Uji statistik stabilitas pH dengan One Way ANOVA
Descriptives
N Mean
Std.
Deviation
Std.
Error
95% Confidence
Interval for Mean
Minimum Maximum
Lower
Bound
Upper
Bound
Formula 0 Minggu 1 6 10.3600 .01897 .00775 10.3401 10.3799 10.33 10.38
Minggu 2 6 10.3767 .02733 .01116 10.3480 10.4053 10.33 10.41
Minggu 3 6 10.3267 .01633 .00667 10.3095 10.3438 10.30 10.35
Minggu 4 6 10.3450 .02429 .00992 10.3195 10.3705 10.31 10.37
Total 24 10.3521 .02797 .00571 10.3403 10.3639 10.30 10.41
Formula 1 Minggu 1 6 10.2317 .00983 .00401 10.2213 10.2420 10.22 10.24
Minggu 2 6 10.2183 .02137 .00872 10.1959 10.2408 10.18 10.24
Minggu 3 6 10.1600 .02828 .01155 10.1303 10.1897 10.12 10.19
Minggu 4 6 10.0733 .03327 .01358 10.0384 10.1082 10.02 10.11
Total 24 10.1708 .06782 .01384 10.1422 10.1995 10.02 10.24
Formula 2 Minggu 1 6 9.3450 .02739 .01118 9.3163 9.3737 9.31 9.38
Minggu 2 6 9.3283 .02041 .00833 9.3069 9.3498 9.30 9.35
Minggu 3 6 9.2667 .03011 .01229 9.2351 9.2983 9.21 9.30
Minggu 4 6 9.1817 .02483 .01014 9.1556 9.2077 9.15 9.22
Total 24 9.2804 .06975 .01424 9.2510 9.3099 9.15 9.38
Formula 3 Minggu 1 6 9.0383 .01722 .00703 9.0203 9.0564 9.02 9.06
Minggu 2 6 9.0333 .01633 .00667 9.0162 9.0505 9.01 9.05
Minggu 3 6 9.0617 .06242 .02548 8.9962 9.1272 8.98 9.16
Minggu 4 6 8.9500 .03521 .01438 8.9130 8.9870 8.90 8.98
Total 24 9.0208 .05571 .01137 8.9973 9.0444 8.90 9.16
Test of Homogeneity of Variances
Levene Statistic df1 df2 Sig.
Formula 0 .785 3 20 .516
Formula 1 2.789 3 20 .067
Formula 2 .150 3 20 .929
Formula 3 2.886 3 20 .061

197
ANOVA
Sum of Squares df Mean Square F Sig.
Formula 0 Between Groups .008 3 .003 5.555 .006
Within Groups .010 20 .000
Total .018 23
Formula 1
Between Groups .093 3 .031 50.668 .000
Within Groups .012 20 .001
Total .106 23
Formula 2 Between Groups .098 3 .033 48.796 .000
Within Groups .013 20 .001
Total .112 23
Formula 3 Between Groups .043 3 .014 10.031 .000
Within Groups .029 20 .001
Total .071 23
M2. Uji statistik stabilitas pH dengan Post Hoc Tukey
Multiple Comparisons
Tukey HSD
Dependent
Variable
(I) Minggu
ke-
(J) Minggu
ke-
Mean
Difference (I-J)
Std.
Error Sig.
95% Confidence
Interval
Lower
Bound
Upper
Bound
Formula 0 Minggu 1 Minggu 2 -.01667 .01279 .572 -.0525 .0191
Minggu 3 .03333 .01279 .074 -.0025 .0691
Minggu 4 .01500 .01279 .650 -.0208 .0508
Minggu 2 Minggu 1 .01667 .01279 .572 -.0191 .0525
Minggu 3 .05000* .01279 .004 .0142 .0858
Minggu 4 .03167 .01279 .095 -.0041 .0675
Minggu 3 Minggu 1 -.03333 .01279 .074 -.0691 .0025
Minggu 2 -.05000* .01279 .004 -.0858 -.0142
Minggu 4 -.01833 .01279 .494 -.0541 .0175
Minggu 4 Minggu 1 -.01500 .01279 .650 -.0508 .0208
Minggu 2 -.03167 .01279 .095 -.0675 .0041
Minggu 3 .01833 .01279 .494 -.0175 .0541
Formula 1 Minggu 1 Minggu 2 .01333 .01432 .789 -.0267 .0534
Minggu 3 .07167* .01432 .000 .0316 .1117
Minggu 4 .15833* .01432 .000 .1183 .1984
Minggu 2 Minggu 1 -.01333 .01432 .789 -.0534 .0267
Minggu 3 .05833* .01432 .003 .0183 .0984
Minggu 4 .14500* .01432 .000 .1049 .1851
Minggu 3 Minggu 1 -.07167* .01432 .000 -.1117 -.0316
Minggu 2 -.05833* .01432 .003 -.0984 -.0183
Minggu 4 .08667* .01432 .000 .0466 .1267

198
Minggu 4 Minggu 1 -.15833* .01432 .000 -.1984 -.1183
Minggu 2 -.14500* .01432 .000 -.1851 -.1049
Minggu 3 -.08667* .01432 .000 -.1267 -.0466
Formula 2 Minggu 1 Minggu 2 .01667 .01497 .686 -.0252 .0586
Minggu 3 .07833* .01497 .000 .0364 .1202
Minggu 4 .16333* .01497 .000 .1214 .2052
Minggu 2 Minggu 1 -.01667 .01497 .686 -.0586 .0252
Minggu 3 .06167* .01497 .003 .0198 .1036
Minggu 4 .14667* .01497 .000 .1048 .1886
Minggu 3 Minggu 1 -.07833* .01497 .000 -.1202 -.0364
Minggu 2 -.06167* .01497 .003 -.1036 -.0198
Minggu 4 .08500* .01497 .000 .0431 .1269
Minggu 4 Minggu 1 -.16333* .01497 .000 -.2052 -.1214
Minggu 2 -.14667* .01497 .000 -.1886 -.1048
Minggu 3 -.08500* .01497 .000 -.1269 -.0431
Formula 3 Minggu 1 Minggu 2 .00500 .02179 .996 -.0560 .0660
Minggu 3 -.02333 .02179 .711 -.0843 .0377
Minggu 4 .08833* .02179 .003 .0273 .1493
Minggu 2 Minggu 1 -.00500 .02179 .996 -.0660 .0560
Minggu 3 -.02833 .02179 .573 -.0893 .0327
Minggu 4 .08333* .02179 .005 .0223 .1443
Minggu 3 Minggu 1 .02333 .02179 .711 -.0377 .0843
Minggu 2 .02833 .02179 .573 -.0327 .0893
Minggu 4 .11167* .02179 .000 .0507 .1727
Minggu 4 Minggu 1 -.08833* .02179 .003 -.1493 -.0273
Minggu 2 -.08333* .02179 .005 -.1443 -.0223
Minggu 3 -.11167* .02179 .000 -.1727 -.0507
*. The mean difference is significant at the 0.05 level.
Formula 0
Tukey HSDa
Minggu ke- N
Subset for alpha = 0.05
1 2
Minggu 3 6 10.3267
Minggu 4 6 10.3450 10.3450
Minggu 1 6 10.3600 10.3600
Minggu 2 6 10.3767
Sig. .074 .095
Means for groups in homogeneous subsets are
displayed.
a. Uses Harmonic Mean Sample Size = 6.000.
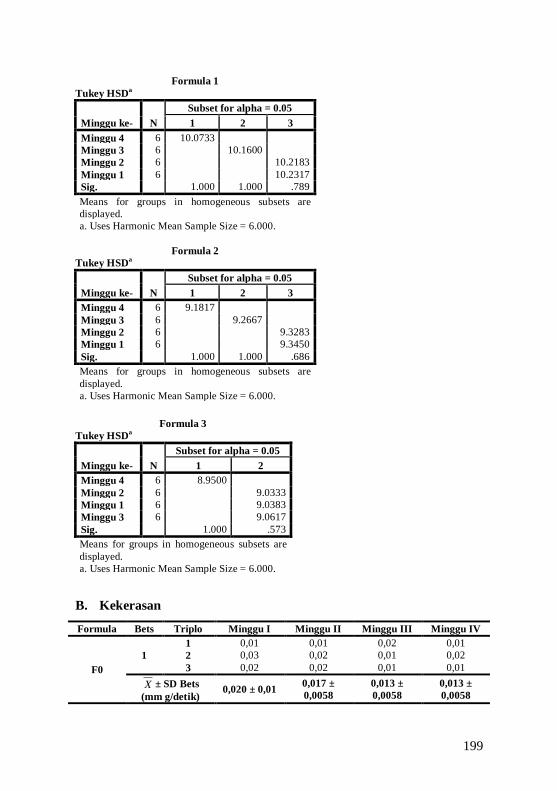
199
Formula 1
Tukey HSDa
Minggu ke- N
Subset for alpha = 0.05
1 2 3
Minggu 4 6 10.0733
Minggu 3 6 10.1600
Minggu 2 6 10.2183
Minggu 1 6 10.2317
Sig. 1.000 1.000 .789
Means for groups in homogeneous subsets are
displayed.
a. Uses Harmonic Mean Sample Size = 6.000.
Formula 2
Tukey HSDa
Minggu ke- N
Subset for alpha = 0.05
1 2 3
Minggu 4 6 9.1817
Minggu 3 6 9.2667
Minggu 2 6 9.3283
Minggu 1 6 9.3450
Sig. 1.000 1.000 .686
Means for groups in homogeneous subsets are
displayed.
a. Uses Harmonic Mean Sample Size = 6.000.
Formula 3
Tukey HSDa
Minggu ke- N
Subset for alpha = 0.05
1 2
Minggu 4 6 8.9500
Minggu 2 6 9.0333
Minggu 1 6 9.0383
Minggu 3 6 9.0617
Sig. 1.000 .573
Means for groups in homogeneous subsets are
displayed.
a. Uses Harmonic Mean Sample Size = 6.000.
B. Kekerasan
Formula Bets Triplo Minggu I Minggu II Minggu III Minggu IV
F0
1
1 0,01 0,01 0,02 0,01
2 0,03 0,02 0,01 0,02
3 0,02 0,02 0,01 0,01
X ± SD Bets
(mm g/detik) 0,020 ± 0,01
0,017 ±
0,0058
0,013 ±
0,0058
0,013 ±
0,0058
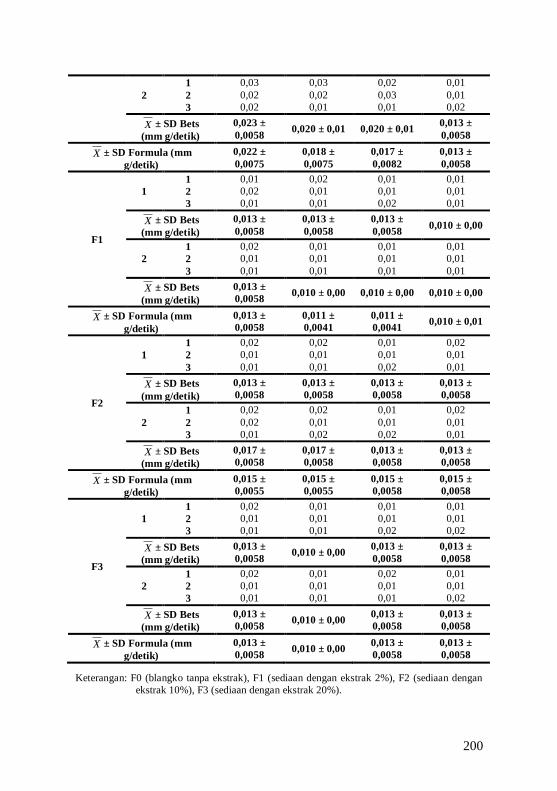
200
2
1 0,03 0,03 0,02 0,01
2 0,02 0,02 0,03 0,01
3 0,02 0,01 0,01 0,02
X ± SD Bets
(mm g/detik)
0,023 ±
0,0058 0,020 ± 0,01 0,020 ± 0,01
0,013 ±
0,0058
X ± SD Formula (mm
g/detik)
0,022 ±
0,0075
0,018 ±
0,0075
0,017 ±
0,0082
0,013 ±
0,0058
F1
1
1 0,01 0,02 0,01 0,01
2 0,02 0,01 0,01 0,01
3 0,01 0,01 0,02 0,01
X ± SD Bets
(mm g/detik)
0,013 ±
0,0058
0,013 ±
0,0058
0,013 ±
0,0058 0,010 ± 0,00
2
1 0,02 0,01 0,01 0,01
2 0,01 0,01 0,01 0,01
3 0,01 0,01 0,01 0,01
X ± SD Bets
(mm g/detik)
0,013 ±
0,0058 0,010 ± 0,00 0,010 ± 0,00 0,010 ± 0,00
X ± SD Formula (mm
g/detik)
0,013 ±
0,0058
0,011 ±
0,0041
0,011 ±
0,0041 0,010 ± 0,01
F2
1
1 0,02 0,02 0,01 0,02
2 0,01 0,01 0,01 0,01
3 0,01 0,01 0,02 0,01
X ± SD Bets
(mm g/detik)
0,013 ±
0,0058
0,013 ±
0,0058
0,013 ±
0,0058
0,013 ±
0,0058
2
1 0,02 0,02 0,01 0,02
2 0,02 0,01 0,01 0,01
3 0,01 0,02 0,02 0,01
X ± SD Bets
(mm g/detik)
0,017 ±
0,0058
0,017 ±
0,0058
0,013 ±
0,0058
0,013 ±
0,0058
X ± SD Formula (mm
g/detik)
0,015 ±
0,0055
0,015 ±
0,0055
0,015 ±
0,0058
0,015 ±
0,0058
F3
1
1 0,02 0,01 0,01 0,01
2 0,01 0,01 0,01 0,01
3 0,01 0,01 0,02 0,02
X ± SD Bets
(mm g/detik)
0,013 ±
0,0058 0,010 ± 0,00
0,013 ±
0,0058
0,013 ±
0,0058
2
1 0,02 0,01 0,02 0,01
2 0,01 0,01 0,01 0,01
3 0,01 0,01 0,01 0,02
X ± SD Bets
(mm g/detik)
0,013 ±
0,0058 0,010 ± 0,00
0,013 ±
0,0058
0,013 ±
0,0058
X ± SD Formula (mm
g/detik)
0,013 ±
0,0058 0,010 ± 0,00
0,013 ±
0,0058
0,013 ±
0,0058
Keterangan: F0 (blangko tanpa ekstrak), F1 (sediaan dengan ekstrak 2%), F2 (sediaan dengan
ekstrak 10%), F3 (sediaan dengan ekstrak 20%).
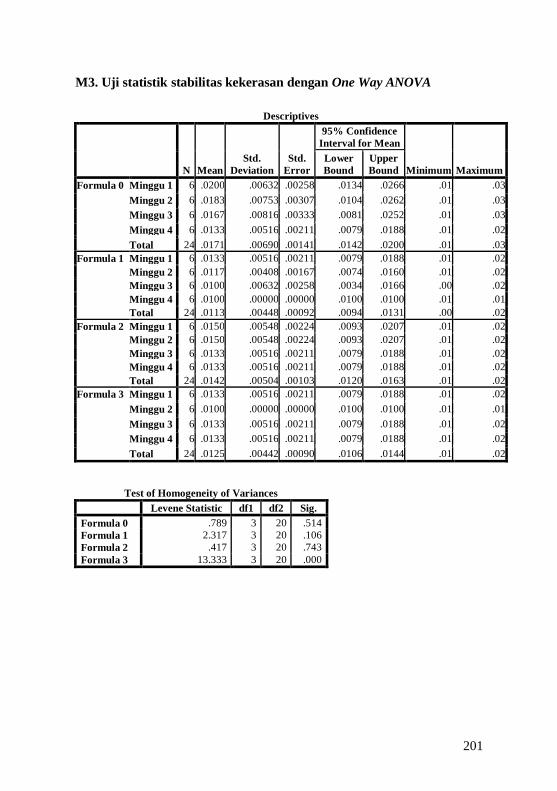
201
M3. Uji statistik stabilitas kekerasan dengan One Way ANOVA
Descriptives
N Mean
Std.
Deviation
Std.
Error
95% Confidence
Interval for Mean
Minimum Maximum
Lower
Bound
Upper
Bound
Formula 0 Minggu 1 6 .0200 .00632 .00258 .0134 .0266 .01 .03
Minggu 2 6 .0183 .00753 .00307 .0104 .0262 .01 .03
Minggu 3 6 .0167 .00816 .00333 .0081 .0252 .01 .03
Minggu 4 6 .0133 .00516 .00211 .0079 .0188 .01 .02
Total 24 .0171 .00690 .00141 .0142 .0200 .01 .03
Formula 1 Minggu 1 6 .0133 .00516 .00211 .0079 .0188 .01 .02
Minggu 2 6 .0117 .00408 .00167 .0074 .0160 .01 .02
Minggu 3 6 .0100 .00632 .00258 .0034 .0166 .00 .02
Minggu 4 6 .0100 .00000 .00000 .0100 .0100 .01 .01
Total 24 .0113 .00448 .00092 .0094 .0131 .00 .02
Formula 2 Minggu 1 6 .0150 .00548 .00224 .0093 .0207 .01 .02
Minggu 2 6 .0150 .00548 .00224 .0093 .0207 .01 .02
Minggu 3 6 .0133 .00516 .00211 .0079 .0188 .01 .02
Minggu 4 6 .0133 .00516 .00211 .0079 .0188 .01 .02
Total 24 .0142 .00504 .00103 .0120 .0163 .01 .02
Formula 3 Minggu 1 6 .0133 .00516 .00211 .0079 .0188 .01 .02
Minggu 2 6 .0100 .00000 .00000 .0100 .0100 .01 .01
Minggu 3 6 .0133 .00516 .00211 .0079 .0188 .01 .02
Minggu 4 6 .0133 .00516 .00211 .0079 .0188 .01 .02
Total 24 .0125 .00442 .00090 .0106 .0144 .01 .02
Test of Homogeneity of Variances
Levene Statistic df1 df2 Sig.
Formula 0 .789 3 20 .514
Formula 1 2.317 3 20 .106
Formula 2 .417 3 20 .743
Formula 3 13.333 3 20 .000
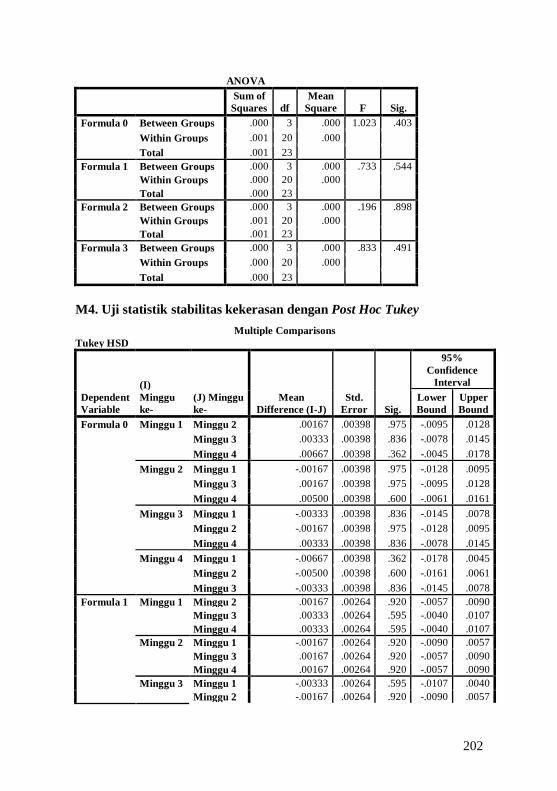
202
ANOVA
Sum of
Squares df
Mean
Square F Sig.
Formula 0 Between Groups .000 3 .000 1.023 .403
Within Groups .001 20 .000
Total .001 23
Formula 1 Between Groups .000 3 .000 .733 .544
Within Groups .000 20 .000
Total .000 23
Formula 2 Between Groups .000 3 .000 .196 .898
Within Groups .001 20 .000
Total .001 23
Formula 3 Between Groups .000 3 .000 .833 .491
Within Groups .000 20 .000
Total .000 23
M4. Uji statistik stabilitas kekerasan dengan Post Hoc Tukey
Multiple Comparisons
Tukey HSD
Dependent
Variable
(I)
Minggu
ke-
(J) Minggu
ke-
Mean
Difference (I-J)
Std.
Error Sig.
95%
Confidence
Interval
Lower
Bound
Upper
Bound
Formula 0 Minggu 1 Minggu 2 .00167 .00398 .975 -.0095 .0128
Minggu 3 .00333 .00398 .836 -.0078 .0145
Minggu 4 .00667 .00398 .362 -.0045 .0178
Minggu 2 Minggu 1 -.00167 .00398 .975 -.0128 .0095
Minggu 3 .00167 .00398 .975 -.0095 .0128
Minggu 4 .00500 .00398 .600 -.0061 .0161
Minggu 3 Minggu 1 -.00333 .00398 .836 -.0145 .0078
Minggu 2 -.00167 .00398 .975 -.0128 .0095
Minggu 4 .00333 .00398 .836 -.0078 .0145
Minggu 4 Minggu 1 -.00667 .00398 .362 -.0178 .0045
Minggu 2 -.00500 .00398 .600 -.0161 .0061
Minggu 3 -.00333 .00398 .836 -.0145 .0078
Formula 1 Minggu 1 Minggu 2 .00167 .00264 .920 -.0057 .0090
Minggu 3 .00333 .00264 .595 -.0040 .0107
Minggu 4 .00333 .00264 .595 -.0040 .0107
Minggu 2 Minggu 1 -.00167 .00264 .920 -.0090 .0057
Minggu 3 .00167 .00264 .920 -.0057 .0090
Minggu 4 .00167 .00264 .920 -.0057 .0090
Minggu 3 Minggu 1 -.00333 .00264 .595 -.0107 .0040
Minggu 2 -.00167 .00264 .920 -.0090 .0057
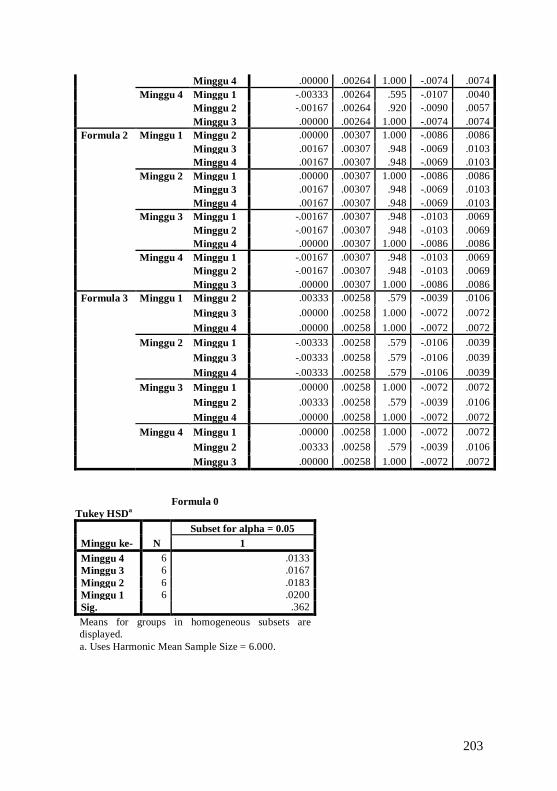
203
Minggu 4 .00000 .00264 1.000 -.0074 .0074
Minggu 4 Minggu 1 -.00333 .00264 .595 -.0107 .0040
Minggu 2 -.00167 .00264 .920 -.0090 .0057
Minggu 3 .00000 .00264 1.000 -.0074 .0074
Formula 2 Minggu 1 Minggu 2 .00000 .00307 1.000 -.0086 .0086
Minggu 3 .00167 .00307 .948 -.0069 .0103
Minggu 4 .00167 .00307 .948 -.0069 .0103
Minggu 2 Minggu 1 .00000 .00307 1.000 -.0086 .0086
Minggu 3 .00167 .00307 .948 -.0069 .0103
Minggu 4 .00167 .00307 .948 -.0069 .0103
Minggu 3 Minggu 1 -.00167 .00307 .948 -.0103 .0069
Minggu 2 -.00167 .00307 .948 -.0103 .0069
Minggu 4 .00000 .00307 1.000 -.0086 .0086
Minggu 4 Minggu 1 -.00167 .00307 .948 -.0103 .0069
Minggu 2 -.00167 .00307 .948 -.0103 .0069
Minggu 3 .00000 .00307 1.000 -.0086 .0086
Formula 3 Minggu 1 Minggu 2 .00333 .00258 .579 -.0039 .0106
Minggu 3 .00000 .00258 1.000 -.0072 .0072
Minggu 4 .00000 .00258 1.000 -.0072 .0072
Minggu 2 Minggu 1 -.00333 .00258 .579 -.0106 .0039
Minggu 3 -.00333 .00258 .579 -.0106 .0039
Minggu 4 -.00333 .00258 .579 -.0106 .0039
Minggu 3 Minggu 1 .00000 .00258 1.000 -.0072 .0072
Minggu 2 .00333 .00258 .579 -.0039 .0106
Minggu 4 .00000 .00258 1.000 -.0072 .0072
Minggu 4 Minggu 1 .00000 .00258 1.000 -.0072 .0072
Minggu 2 .00333 .00258 .579 -.0039 .0106
Minggu 3 .00000 .00258 1.000 -.0072 .0072
Formula 0
Tukey HSDa
Minggu ke- N
Subset for alpha = 0.05
1
Minggu 4 6 .0133
Minggu 3 6 .0167
Minggu 2 6 .0183
Minggu 1 6 .0200
Sig. .362
Means for groups in homogeneous subsets are
displayed.
a. Uses Harmonic Mean Sample Size = 6.000.
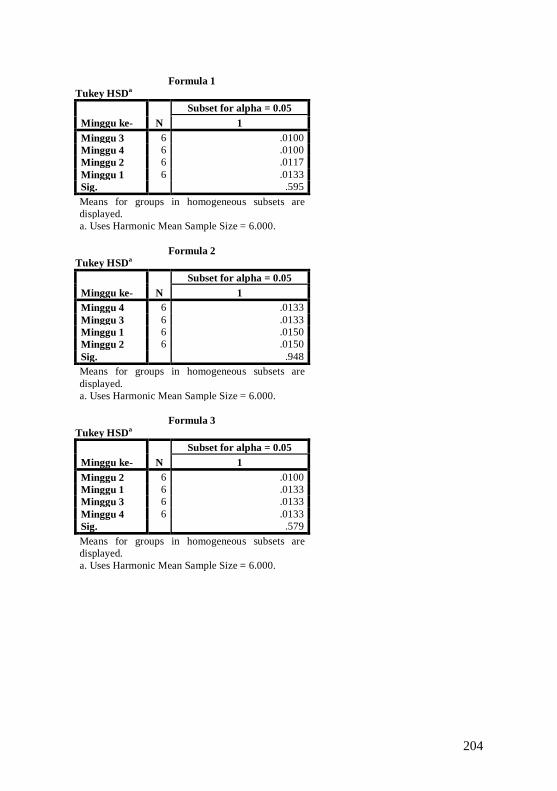
204
Formula 1
Tukey HSDa
Minggu ke- N
Subset for alpha = 0.05
1
Minggu 3 6 .0100
Minggu 4 6 .0100
Minggu 2 6 .0117
Minggu 1 6 .0133
Sig. .595
Means for groups in homogeneous subsets are
displayed.
a. Uses Harmonic Mean Sample Size = 6.000.
Formula 2
Tukey HSDa
Minggu ke- N
Subset for alpha = 0.05
1
Minggu 4 6 .0133
Minggu 3 6 .0133
Minggu 1 6 .0150
Minggu 2 6 .0150
Sig. .948
Means for groups in homogeneous subsets are
displayed.
a. Uses Harmonic Mean Sample Size = 6.000.
Formula 3
Tukey HSDa
Minggu ke- N
Subset for alpha = 0.05
1
Minggu 2 6 .0100
Minggu 1 6 .0133
Minggu 3 6 .0133
Minggu 4 6 .0133
Sig. .579
Means for groups in homogeneous subsets are
displayed.
a. Uses Harmonic Mean Sample Size = 6.000.
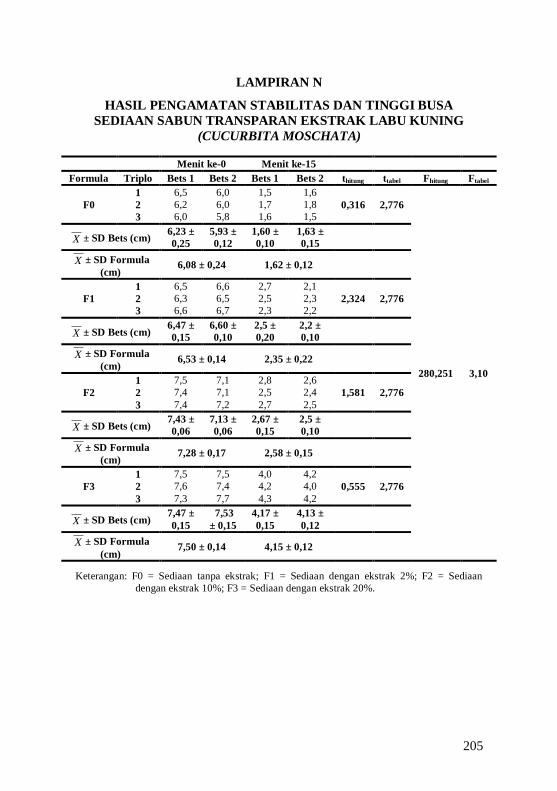
205
LAMPIRAN N
HASIL PENGAMATAN STABILITAS DAN TINGGI BUSA
SEDIAAN SABUN TRANSPARAN EKSTRAK LABU KUNING
(CUCURBITA MOSCHATA)
Menit ke-0 Menit ke-15
Formula Triplo Bets 1 Bets 2 Bets 1 Bets 2 thitung ttabel Fhitung Ftabel
F0
1 6,5 6,0 1,5 1,6
0,316 2,776
280,251 3,10
2 6,2 6,0 1,7 1,8
3 6,0 5,8 1,6 1,5
X ± SD Bets (cm) 6,23 ±
0,25
5,93 ±
0,12
1,60 ±
0,10
1,63 ±
0,15
X ± SD Formula
(cm) 6,08 ± 0,24 1,62 ± 0,12
F1
1 6,5 6,6 2,7 2,1
2,324 2,776 2 6,3 6,5 2,5 2,3
3 6,6 6,7 2,3 2,2
X ± SD Bets (cm) 6,47 ±
0,15
6,60 ±
0,10
2,5 ±
0,20
2,2 ±
0,10
X ± SD Formula
(cm) 6,53 ± 0,14 2,35 ± 0,22
F2
1 7,5 7,1 2,8 2,6
1,581 2,776 2 7,4 7,1 2,5 2,4
3 7,4 7,2 2,7 2,5
X ± SD Bets (cm) 7,43 ±
0,06
7,13 ±
0,06
2,67 ±
0,15
2,5 ±
0,10
X ± SD Formula
(cm) 7,28 ± 0,17 2,58 ± 0,15
F3
1 7,5 7,5 4,0 4,2
0,555 2,776 2 7,6 7,4 4,2 4,0
3 7,3 7,7 4,3 4,2
X ± SD Bets (cm) 7,47 ±
0,15
7,53
± 0,15
4,17 ±
0,15
4,13 ±
0,12
X ± SD Formula
(cm) 7,50 ± 0,14 4,15 ± 0,12
Keterangan: F0 = Sediaan tanpa ekstrak; F1 = Sediaan dengan ekstrak 2%; F2 = Sediaan
dengan ekstrak 10%; F3 = Sediaan dengan ekstrak 20%.

206
N1. Uji statistik stabilitas dan tinggi busa antar bets dengan
independent t-test
Formula F0 (Tanpa Ekstrak)
Group Statistics
Bets N Mean Std. Deviation Std. Error Mean
Stabilitas dan
tinggi busa
Bets 1 3 1.6000 .10000 .05774
Bets 2 3 1.6333 .15275 .08819
Independent Samples Test
Levene's
Test for
Equality of
Variances t-test for Equality of Means
F Sig. t df
Sig.
(2-
tailed)
Mean
Difference
Std. Error
Difference
95%
Confidence
Interval of the
Difference
Lower Upper
Stabilitas
dan tinggi
busa
Equal
variances
assumed
.727 .442 -.316 4 .768 -.03333 .10541 -.32600 .25933
Equal
variances
not assumed
-.316 3.448 .770 -.03333 .10541 -.34542 .27876
Formula F1 (Ekstrak 2%)
Group Statistics
Bets N Mean Std. Deviation Std. Error Mean
Stabilitas dan
tinggi busa
Bets 1 3 2.5000 .20000 .11547
Bets 2 3 2.2000 .10000 .05774
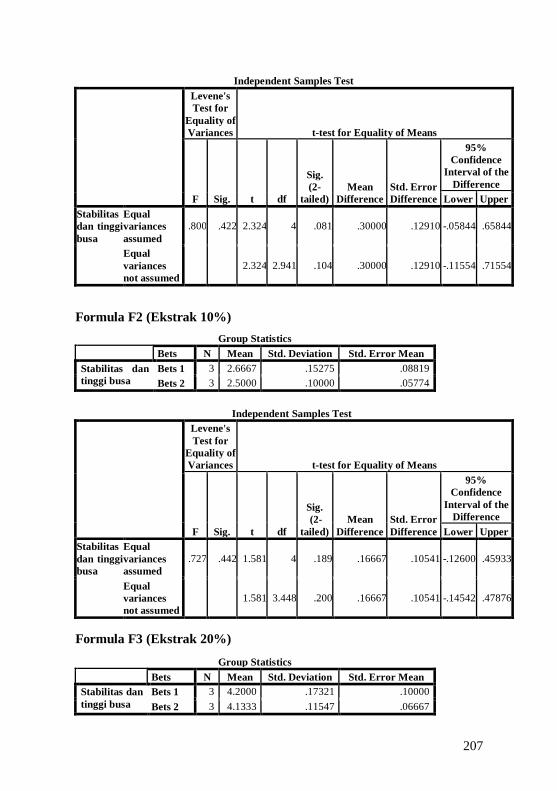
207
Independent Samples Test
Levene's
Test for
Equality of
Variances t-test for Equality of Means
F Sig. t df
Sig.
(2-
tailed)
Mean
Difference
Std. Error
Difference
95%
Confidence
Interval of the
Difference
Lower Upper
Stabilitas
dan tinggi
busa
Equal
variances
assumed
.800 .422 2.324 4 .081 .30000 .12910 -.05844 .65844
Equal
variances
not assumed
2.324 2.941 .104 .30000 .12910 -.11554 .71554
Formula F2 (Ekstrak 10%)
Group Statistics Bets N Mean Std. Deviation Std. Error Mean
Stabilitas dan
tinggi busa
Bets 1 3 2.6667 .15275 .08819
Bets 2 3 2.5000 .10000 .05774
Independent Samples Test
Levene's
Test for
Equality of
Variances t-test for Equality of Means
F Sig. t df
Sig.
(2-
tailed)
Mean
Difference
Std. Error
Difference
95%
Confidence
Interval of the
Difference
Lower Upper
Stabilitas
dan tinggi
busa
Equal
variances
assumed
.727 .442 1.581 4 .189 .16667 .10541 -.12600 .45933
Equal
variances
not assumed
1.581 3.448 .200 .16667 .10541 -.14542 .47876
Formula F3 (Ekstrak 20%)
Group Statistics
Bets N Mean Std. Deviation Std. Error Mean
Stabilitas dan
tinggi busa
Bets 1 3 4.2000 .17321 .10000
Bets 2 3 4.1333 .11547 .06667
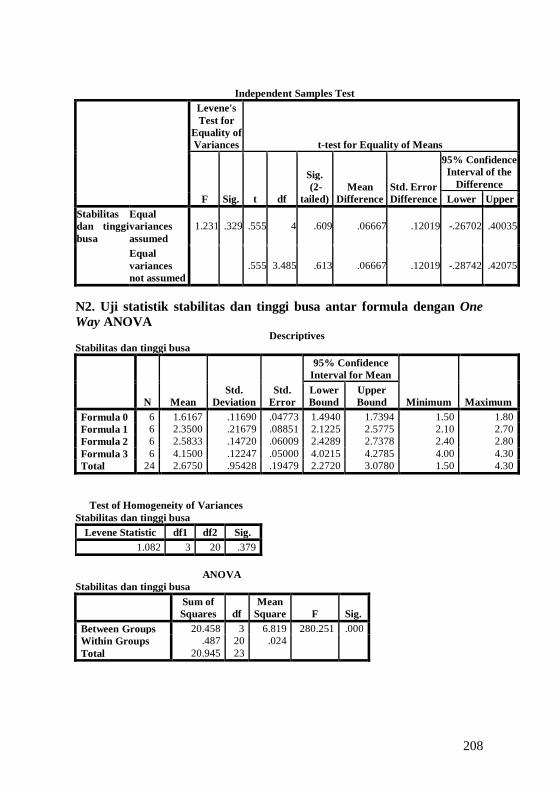
208
Independent Samples Test
Levene's
Test for
Equality of
Variances t-test for Equality of Means
F Sig. t df
Sig.
(2-
tailed)
Mean
Difference
Std. Error
Difference
95% Confidence
Interval of the
Difference
Lower Upper
Stabilitas
dan tinggi
busa
Equal
variances
assumed
1.231 .329 .555 4 .609 .06667 .12019 -.26702 .40035
Equal
variances
not assumed
.555 3.485 .613 .06667 .12019 -.28742 .42075
N2. Uji statistik stabilitas dan tinggi busa antar formula dengan One
Way ANOVA Descriptives
Stabilitas dan tinggi busa
N Mean
Std.
Deviation
Std.
Error
95% Confidence
Interval for Mean
Minimum Maximum
Lower
Bound
Upper
Bound
Formula 0 6 1.6167 .11690 .04773 1.4940 1.7394 1.50 1.80
Formula 1 6 2.3500 .21679 .08851 2.1225 2.5775 2.10 2.70
Formula 2 6 2.5833 .14720 .06009 2.4289 2.7378 2.40 2.80
Formula 3 6 4.1500 .12247 .05000 4.0215 4.2785 4.00 4.30
Total 24 2.6750 .95428 .19479 2.2720 3.0780 1.50 4.30
Test of Homogeneity of Variances
Stabilitas dan tinggi busa
Levene Statistic df1 df2 Sig.
1.082 3 20 .379
ANOVA
Stabilitas dan tinggi busa
Sum of
Squares df
Mean
Square F Sig.
Between Groups 20.458 3 6.819 280.251 .000
Within Groups .487 20 .024
Total 20.945 23
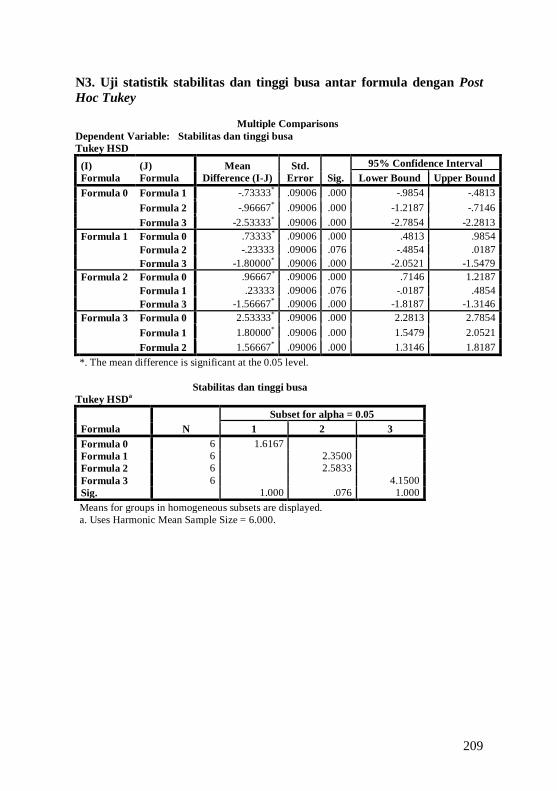
209
N3. Uji statistik stabilitas dan tinggi busa antar formula dengan Post
Hoc Tukey
Multiple Comparisons
Dependent Variable: Stabilitas dan tinggi busa
Tukey HSD
(I)
Formula
(J)
Formula
Mean
Difference (I-J)
Std.
Error Sig.
95% Confidence Interval
Lower Bound Upper Bound
Formula 0 Formula 1 -.73333* .09006 .000 -.9854 -.4813
Formula 2 -.96667* .09006 .000 -1.2187 -.7146
Formula 3 -2.53333* .09006 .000 -2.7854 -2.2813
Formula 1 Formula 0 .73333* .09006 .000 .4813 .9854
Formula 2 -.23333 .09006 .076 -.4854 .0187
Formula 3 -1.80000* .09006 .000 -2.0521 -1.5479
Formula 2 Formula 0 .96667* .09006 .000 .7146 1.2187
Formula 1 .23333 .09006 .076 -.0187 .4854
Formula 3 -1.56667* .09006 .000 -1.8187 -1.3146
Formula 3 Formula 0 2.53333* .09006 .000 2.2813 2.7854
Formula 1 1.80000* .09006 .000 1.5479 2.0521
Formula 2 1.56667* .09006 .000 1.3146 1.8187
*. The mean difference is significant at the 0.05 level.
Stabilitas dan tinggi busa
Tukey HSDa
Formula N
Subset for alpha = 0.05
1 2 3
Formula 0 6 1.6167
Formula 1 6 2.3500
Formula 2 6 2.5833
Formula 3 6 4.1500
Sig. 1.000 .076 1.000
Means for groups in homogeneous subsets are displayed.
a. Uses Harmonic Mean Sample Size = 6.000.
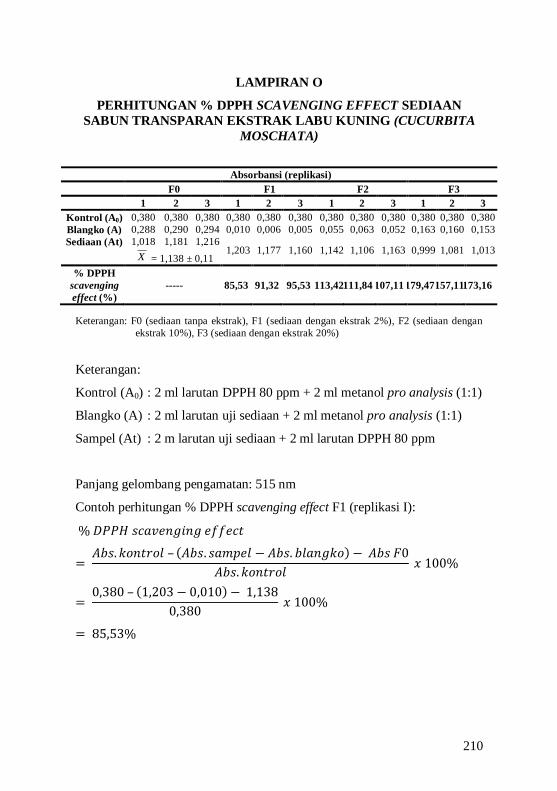
210
LAMPIRAN O
PERHITUNGAN % DPPH SCAVENGING EFFECT SEDIAAN
SABUN TRANSPARAN EKSTRAK LABU KUNING (CUCURBITA
MOSCHATA)
Absorbansi (replikasi)
F0 F1 F2 F3
1 2 3 1 2 3 1 2 3 1 2 3
Kontrol (A0) 0,380 0,380 0,380 0,380 0,380 0,380 0,380 0,380 0,380 0,380 0,380 0,380
Blangko (A) 0,288 0,290 0,294 0,010 0,006 0,005 0,055 0,063 0,052 0,163 0,160 0,153
Sediaan (At) 1,018 1,181 1,216 1,203 1,177 1,160 1,142 1,106 1,163 0,999 1,081 1,013
X = 1,138 ± 0,11
% DPPH
scavenging
effect (%)
----- 85,53 91,32 95,53 113,42 111,84 107,11 179,47 157,11 173,16
Keterangan: F0 (sediaan tanpa ekstrak), F1 (sediaan dengan ekstrak 2%), F2 (sediaan dengan
ekstrak 10%), F3 (sediaan dengan ekstrak 20%)
Keterangan:
Kontrol (A0) : 2 ml larutan DPPH 80 ppm + 2 ml metanol pro analysis (1:1)
Blangko (A) : 2 ml larutan uji sediaan + 2 ml metanol pro analysis (1:1)
Sampel (At) : 2 m larutan uji sediaan + 2 ml larutan DPPH 80 ppm
Panjang gelombang pengamatan: 515 nm
Contoh perhitungan % DPPH scavenging effect F1 (replikasi I):
% 𝐷𝑃𝑃𝐻 𝑠𝑐𝑎𝑣𝑒𝑛𝑔𝑖𝑛𝑔 𝑒𝑓𝑓𝑒𝑐𝑡
= 𝐴𝑏𝑠.𝑘𝑜𝑛𝑡𝑟𝑜𝑙 – 𝐴𝑏𝑠. 𝑠𝑎𝑚𝑝𝑒𝑙 − 𝐴𝑏𝑠. 𝑏𝑙𝑎𝑛𝑔𝑘𝑜 − 𝐴𝑏𝑠 𝐹0
𝐴𝑏𝑠.𝑘𝑜𝑛𝑡𝑟𝑜𝑙 𝑥 100%
= 0,380 – 1,203 − 0,010 − 1,138
0,380 𝑥 100%
= 85,53%
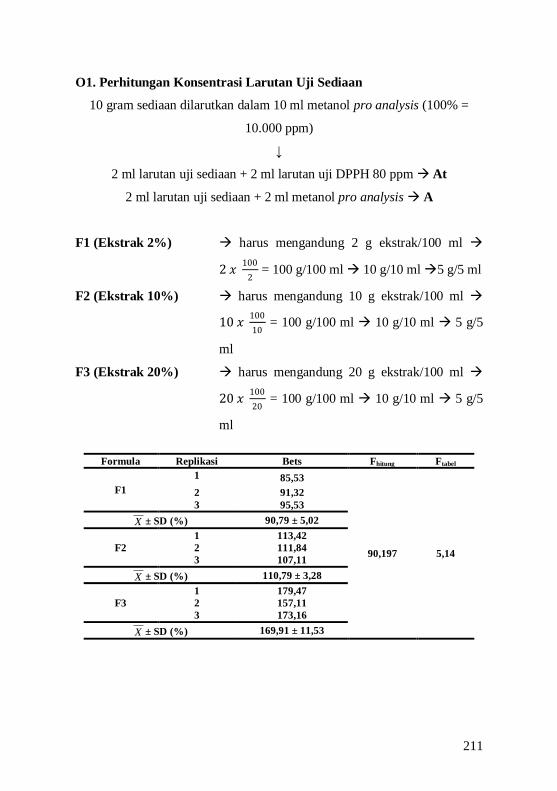
211
O1. Perhitungan Konsentrasi Larutan Uji Sediaan
10 gram sediaan dilarutkan dalam 10 ml metanol pro analysis (100% =
10.000 ppm)
↓
2 ml larutan uji sediaan + 2 ml larutan uji DPPH 80 ppm At
2 ml larutan uji sediaan + 2 ml metanol pro analysis A
F1 (Ekstrak 2%) harus mengandung 2 g ekstrak/100 ml
2 𝑥 100
2 = 100 g/100 ml 10 g/10 ml 5 g/5 ml
F2 (Ekstrak 10%) harus mengandung 10 g ekstrak/100 ml
10 𝑥 100
10 = 100 g/100 ml 10 g/10 ml 5 g/5
ml
F3 (Ekstrak 20%) harus mengandung 20 g ekstrak/100 ml
20 𝑥 100
20 = 100 g/100 ml 10 g/10 ml 5 g/5
ml
Formula Replikasi Bets Fhitung Ftabel
F1
1 85,53
90,197 5,14
2 91,32
3 95,53
X ± SD (%) 90,79 ± 5,02
F2
1 113,42
2 111,84
3 107,11
X ± SD (%) 110,79 ± 3,28
F3
1 179,47
2 157,11
3 173,16
X ± SD (%) 169,91 ± 11,53
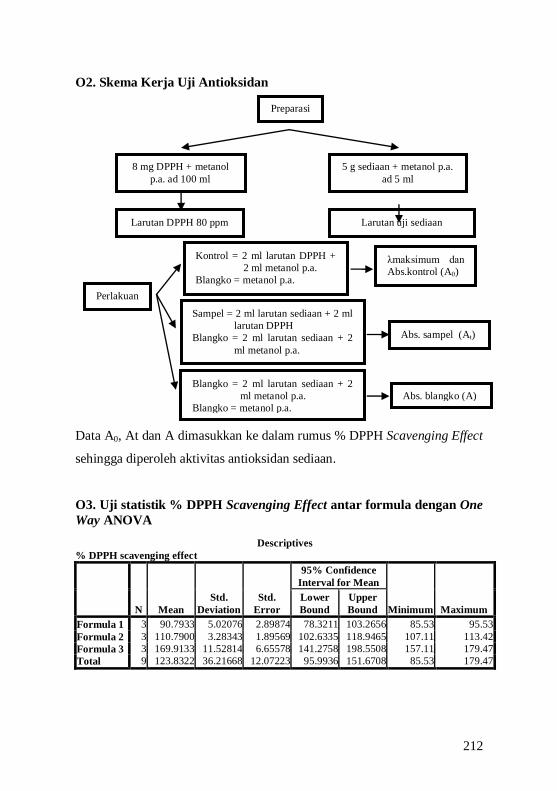
212
O2. Skema Kerja Uji Antioksidan
Data A0, At dan A dimasukkan ke dalam rumus % DPPH Scavenging Effect
sehingga diperoleh aktivitas antioksidan sediaan.
O3. Uji statistik % DPPH Scavenging Effect antar formula dengan One
Way ANOVA
Descriptives
% DPPH scavenging effect
N Mean
Std.
Deviation
Std.
Error
95% Confidence
Interval for Mean
Minimum Maximum
Lower
Bound
Upper
Bound
Formula 1 3 90.7933 5.02076 2.89874 78.3211 103.2656 85.53 95.53
Formula 2 3 110.7900 3.28343 1.89569 102.6335 118.9465 107.11 113.42
Formula 3 3 169.9133 11.52814 6.65578 141.2758 198.5508 157.11 179.47
Total 9 123.8322 36.21668 12.07223 95.9936 151.6708 85.53 179.47
Vortex, saring
Blangko = 2 ml larutan sediaan + 2
ml metanol p.a.
Blangko = metanol p.a.
Larutan DPPH 80 ppm
8 mg DPPH + metanol
p.a. ad 100 ml
Kontrol = 2 ml larutan DPPH +
2 ml metanol p.a.
Blangko = metanol p.a.
Larutan uji sediaan
5 g sediaan + metanol p.a.
ad 5 ml
λmaksimum dan
Abs.kontrol (A0)
Sampel = 2 ml larutan sediaan + 2 ml
larutan DPPH
Blangko = 2 ml larutan sediaan + 2
ml metanol p.a.
Perlakuan
Preparasi
Abs. sampel (At)
Abs. blangko (A)
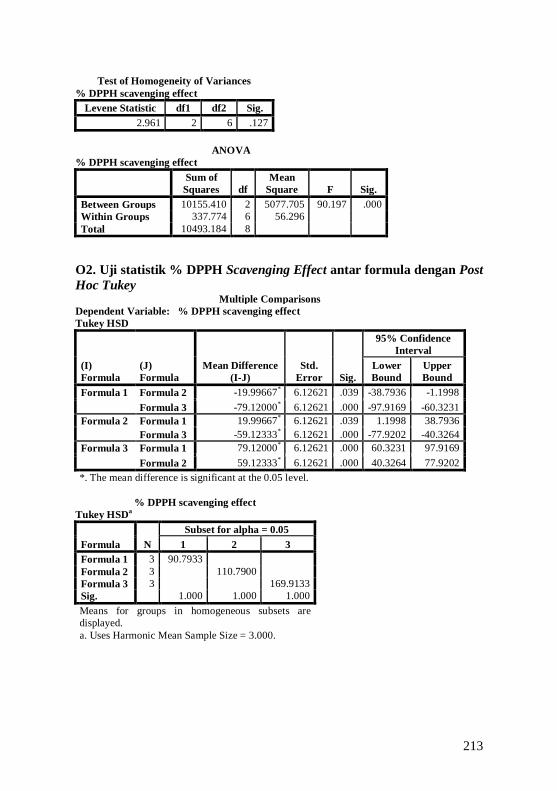
213
Test of Homogeneity of Variances
% DPPH scavenging effect
Levene Statistic df1 df2 Sig.
2.961 2 6 .127
ANOVA
% DPPH scavenging effect
Sum of
Squares df
Mean
Square F Sig.
Between Groups 10155.410 2 5077.705 90.197 .000
Within Groups 337.774 6 56.296
Total 10493.184 8
O2. Uji statistik % DPPH Scavenging Effect antar formula dengan Post
Hoc Tukey Multiple Comparisons
Dependent Variable: % DPPH scavenging effect
Tukey HSD
(I)
Formula
(J)
Formula
Mean Difference
(I-J)
Std.
Error Sig.
95% Confidence
Interval
Lower
Bound
Upper
Bound
Formula 1 Formula 2 -19.99667* 6.12621 .039 -38.7936 -1.1998
Formula 3 -79.12000* 6.12621 .000 -97.9169 -60.3231
Formula 2 Formula 1 19.99667* 6.12621 .039 1.1998 38.7936
Formula 3 -59.12333* 6.12621 .000 -77.9202 -40.3264
Formula 3 Formula 1 79.12000* 6.12621 .000 60.3231 97.9169
Formula 2 59.12333* 6.12621 .000 40.3264 77.9202
*. The mean difference is significant at the 0.05 level.
% DPPH scavenging effect
Tukey HSDa
Formula N
Subset for alpha = 0.05
1 2 3
Formula 1 3 90.7933
Formula 2 3 110.7900
Formula 3 3 169.9133
Sig. 1.000 1.000 1.000
Means for groups in homogeneous subsets are
displayed.
a. Uses Harmonic Mean Sample Size = 3.000.
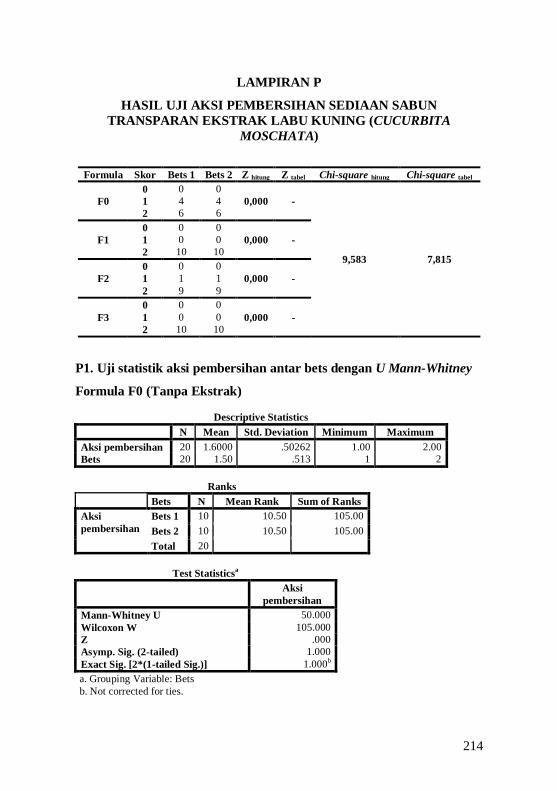
214
LAMPIRAN P
HASIL UJI AKSI PEMBERSIHAN SEDIAAN SABUN
TRANSPARAN EKSTRAK LABU KUNING (CUCURBITA
MOSCHATA)
Formula Skor Bets 1 Bets 2 Z hitung Z tabel Chi-square hitung Chi-square tabel
F0
0 0 0
0,000 -
9,583 7,815
1 4 4
2 6 6
F1
0 0 0
0,000 - 1 0 0
2 10 10
F2
0 0 0
0,000 - 1 1 1
2 9 9
F3
0 0 0
0,000 - 1 0 0
2 10 10
P1. Uji statistik aksi pembersihan antar bets dengan U Mann-Whitney
Formula F0 (Tanpa Ekstrak)
Descriptive Statistics
N Mean Std. Deviation Minimum Maximum
Aksi pembersihan 20 1.6000 .50262 1.00 2.00
Bets 20 1.50 .513 1 2
Ranks
Bets N Mean Rank Sum of Ranks
Aksi
pembersihan
Bets 1 10 10.50 105.00
Bets 2 10 10.50 105.00
Total 20
Test Statisticsa
Aksi
pembersihan
Mann-Whitney U 50.000
Wilcoxon W 105.000
Z .000
Asymp. Sig. (2-tailed) 1.000
Exact Sig. [2*(1-tailed Sig.)] 1.000b
a. Grouping Variable: Bets
b. Not corrected for ties.
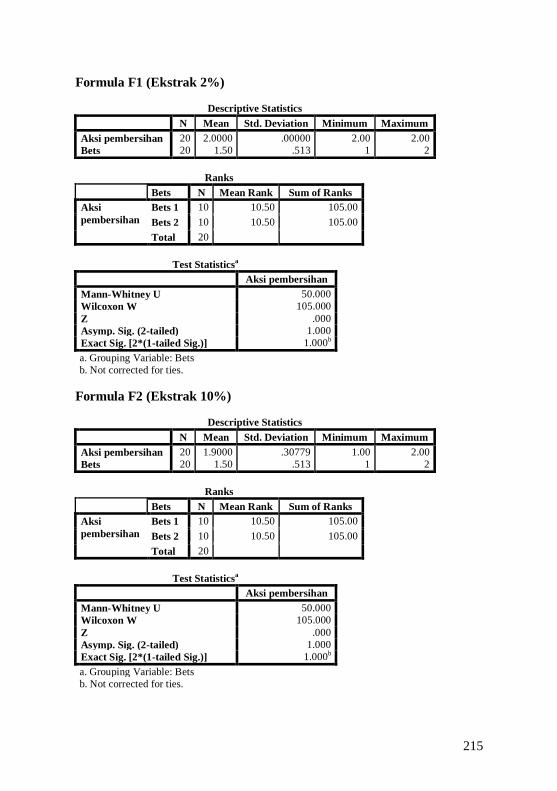
215
Formula F1 (Ekstrak 2%)
Descriptive Statistics
N Mean Std. Deviation Minimum Maximum
Aksi pembersihan 20 2.0000 .00000 2.00 2.00
Bets 20 1.50 .513 1 2
Ranks
Bets N Mean Rank Sum of Ranks
Aksi
pembersihan
Bets 1 10 10.50 105.00
Bets 2 10 10.50 105.00
Total 20
Test Statisticsa
Aksi pembersihan
Mann-Whitney U 50.000
Wilcoxon W 105.000
Z .000
Asymp. Sig. (2-tailed) 1.000
Exact Sig. [2*(1-tailed Sig.)] 1.000b
a. Grouping Variable: Bets
b. Not corrected for ties.
Formula F2 (Ekstrak 10%)
Descriptive Statistics
N Mean Std. Deviation Minimum Maximum
Aksi pembersihan 20 1.9000 .30779 1.00 2.00
Bets 20 1.50 .513 1 2
Ranks
Bets N Mean Rank Sum of Ranks
Aksi
pembersihan
Bets 1 10 10.50 105.00
Bets 2 10 10.50 105.00
Total 20
Test Statisticsa
Aksi pembersihan
Mann-Whitney U 50.000
Wilcoxon W 105.000
Z .000
Asymp. Sig. (2-tailed) 1.000
Exact Sig. [2*(1-tailed Sig.)] 1.000b
a. Grouping Variable: Bets
b. Not corrected for ties.
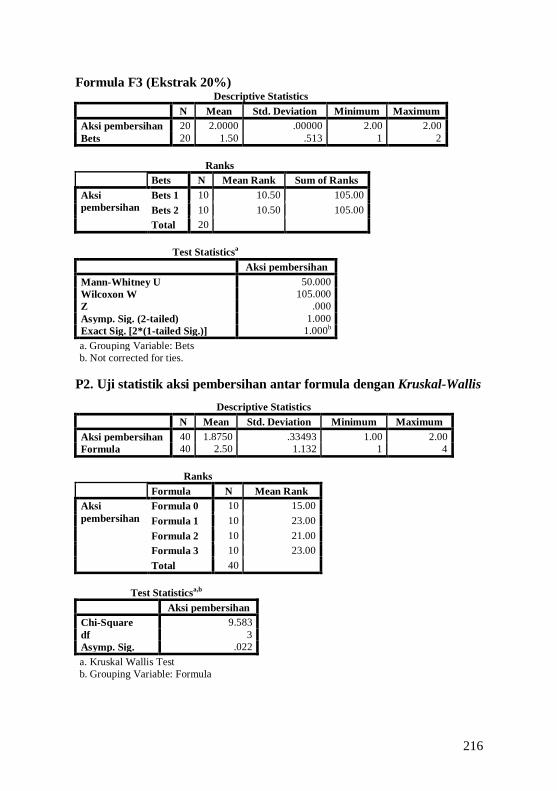
216
Formula F3 (Ekstrak 20%) Descriptive Statistics
N Mean Std. Deviation Minimum Maximum
Aksi pembersihan 20 2.0000 .00000 2.00 2.00
Bets 20 1.50 .513 1 2
Ranks
Bets N Mean Rank Sum of Ranks
Aksi
pembersihan
Bets 1 10 10.50 105.00
Bets 2 10 10.50 105.00
Total 20
Test Statisticsa
Aksi pembersihan
Mann-Whitney U 50.000
Wilcoxon W 105.000
Z .000
Asymp. Sig. (2-tailed) 1.000
Exact Sig. [2*(1-tailed Sig.)] 1.000b
a. Grouping Variable: Bets
b. Not corrected for ties.
P2. Uji statistik aksi pembersihan antar formula dengan Kruskal-Wallis
Descriptive Statistics
N Mean Std. Deviation Minimum Maximum
Aksi pembersihan 40 1.8750 .33493 1.00 2.00
Formula 40 2.50 1.132 1 4
Ranks
Formula N Mean Rank
Aksi
pembersihan
Formula 0 10 15.00
Formula 1 10 23.00
Formula 2 10 21.00
Formula 3 10 23.00
Total 40
Test Statisticsa,b
Aksi pembersihan
Chi-Square 9.583
df 3
Asymp. Sig. .022
a. Kruskal Wallis Test
b. Grouping Variable: Formula
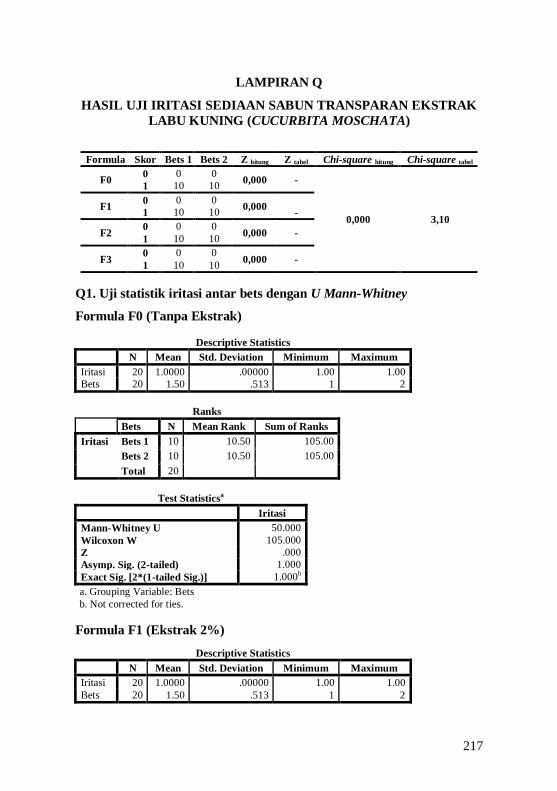
217
LAMPIRAN Q
HASIL UJI IRITASI SEDIAAN SABUN TRANSPARAN EKSTRAK
LABU KUNING (CUCURBITA MOSCHATA)
Formula Skor Bets 1 Bets 2 Z hitung Z tabel Chi-square hitung Chi-square tabel
F0 0 0 0
0,000 -
0,000 3,10
1 10 10
F1 0 0 0
0,000
- 1 10 10
F2 0 0 0
0,000 - 1 10 10
F3 0 0 0
0,000 - 1 10 10
Q1. Uji statistik iritasi antar bets dengan U Mann-Whitney
Formula F0 (Tanpa Ekstrak)
Descriptive Statistics
N Mean Std. Deviation Minimum Maximum
Iritasi 20 1.0000 .00000 1.00 1.00
Bets 20 1.50 .513 1 2
Ranks
Bets N Mean Rank Sum of Ranks
Iritasi Bets 1 10 10.50 105.00
Bets 2 10 10.50 105.00
Total 20
Test Statisticsa
Iritasi
Mann-Whitney U 50.000
Wilcoxon W 105.000
Z .000
Asymp. Sig. (2-tailed) 1.000
Exact Sig. [2*(1-tailed Sig.)] 1.000b
a. Grouping Variable: Bets
b. Not corrected for ties.
Formula F1 (Ekstrak 2%)
Descriptive Statistics
N Mean Std. Deviation Minimum Maximum
Iritasi 20 1.0000 .00000 1.00 1.00
Bets 20 1.50 .513 1 2
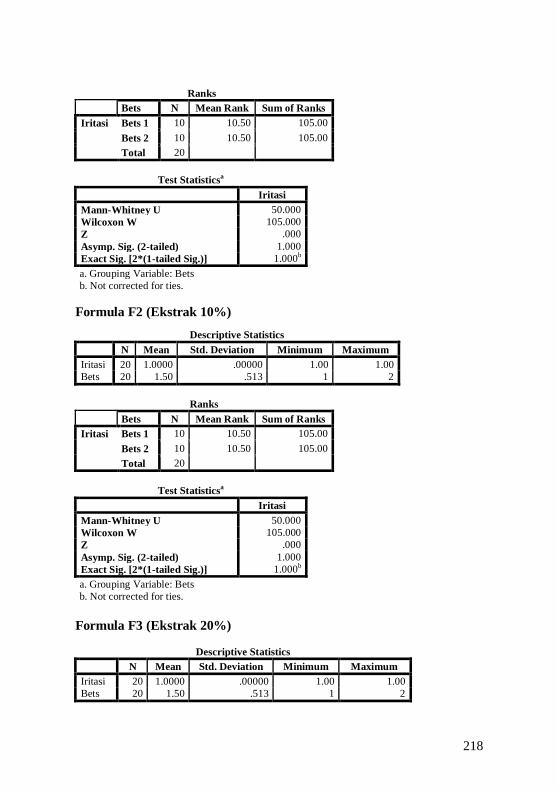
218
Ranks
Bets N Mean Rank Sum of Ranks
Iritasi Bets 1 10 10.50 105.00
Bets 2 10 10.50 105.00
Total 20
Test Statisticsa
Iritasi
Mann-Whitney U 50.000
Wilcoxon W 105.000
Z .000
Asymp. Sig. (2-tailed) 1.000
Exact Sig. [2*(1-tailed Sig.)] 1.000b
a. Grouping Variable: Bets
b. Not corrected for ties.
Formula F2 (Ekstrak 10%)
Descriptive Statistics
N Mean Std. Deviation Minimum Maximum
Iritasi 20 1.0000 .00000 1.00 1.00
Bets 20 1.50 .513 1 2
Ranks
Bets N Mean Rank Sum of Ranks
Iritasi Bets 1 10 10.50 105.00
Bets 2 10 10.50 105.00
Total 20
Test Statisticsa
Iritasi
Mann-Whitney U 50.000
Wilcoxon W 105.000
Z .000
Asymp. Sig. (2-tailed) 1.000
Exact Sig. [2*(1-tailed Sig.)] 1.000b
a. Grouping Variable: Bets
b. Not corrected for ties.
Formula F3 (Ekstrak 20%)
Descriptive Statistics
N Mean Std. Deviation Minimum Maximum
Iritasi 20 1.0000 .00000 1.00 1.00
Bets 20 1.50 .513 1 2

219
Ranks
Bets N Mean Rank Sum of Ranks
Iritasi Bets 1 10 10.50 105.00
Bets 2 10 10.50 105.00
Total 20
Test Statisticsa
Iritasi
Mann-Whitney U 50.000
Wilcoxon W 105.000
Z .000
Asymp. Sig. (2-tailed) 1.000
Exact Sig. [2*(1-tailed Sig.)] 1.000b
a. Grouping Variable: Bets
b. Not corrected for ties.
Q2. Uji statistik iritasi antar formula dengan Kruskal-Wallis
Descriptive Statistics
N Mean Std. Deviation Minimum Maximum
Iritasi 40 1.0000 .00000 1.00 1.00
Formula 40 2.50 1.132 1 4
Ranks
Formula N Mean Rank
Iritasi Formula 0 10 20.50
Formula 1 10 20.50
Formula 2 10 20.50
Formula 3 10 20.50
Total 40
Test Statisticsa,b
Iritasi
Chi-Square .000
df 3
Asymp. Sig. 1.000
a. Kruskal Wallis Test
b. Grouping Variable: Formula

220
LAMPIRAN R
HASIL UJI KESUKAAN SEDIAAN SABUN TRANSPARAN
EKSTRAK LABU KUNING (CUCURBITA MOSCHATA)
Formula Skor Bets 1 Bets 2 Z hitung Z tabel Chi-square hitung Chi-square tabel
F0
0 0 0
0,000 -
1,857 7,815
1 2 2
2 8 8
F1
0 0 0
0,000 - 1 3 3
2 7 7
F2
0 0 0
0,000 - 1 1 1
2 9 9
F3
0 0 0
0,000 - 1 1 1
2 9 9
R1. Uji statistik kesukaan antar bets dengan U Mann-Whitney
Formula F0 (Tanpa Ekstrak) Descriptive Statistics
N Mean Std. Deviation Minimum Maximum
Kesukaan 20 1.8000 .41039 1.00 2.00
Bets 20 1.50 .513 1 2
Ranks
Bets N Mean Rank Sum of Ranks
Kesukaan Bets 1 10 10.50 105.00
Bets 2 10 10.50 105.00
Total 20
Test Statisticsa
Kesukaan
Mann-Whitney U 50.000
Wilcoxon W 105.000
Z .000
Asymp. Sig. (2-tailed) 1.000
Exact Sig. [2*(1-tailed Sig.)] 1.000b
a. Grouping Variable: Bets
b. Not corrected for ties.
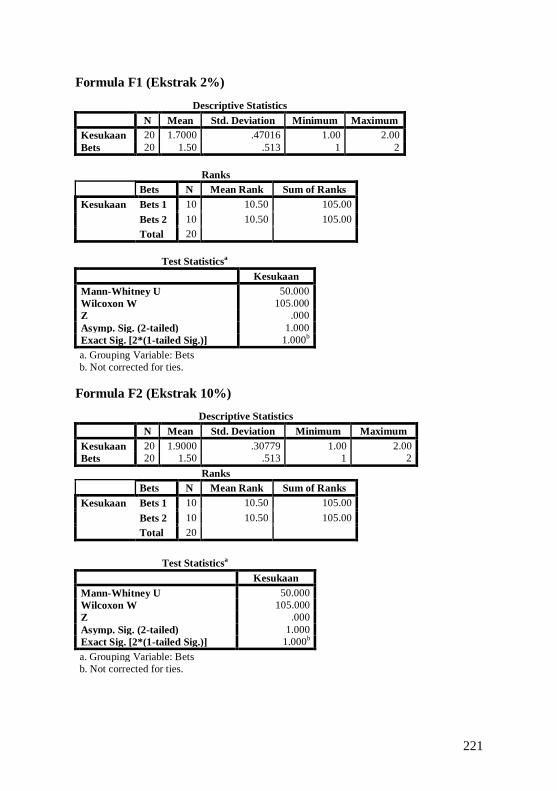
221
Formula F1 (Ekstrak 2%)
Descriptive Statistics
N Mean Std. Deviation Minimum Maximum
Kesukaan 20 1.7000 .47016 1.00 2.00
Bets 20 1.50 .513 1 2
Ranks
Bets N Mean Rank Sum of Ranks
Kesukaan Bets 1 10 10.50 105.00
Bets 2 10 10.50 105.00
Total 20
Test Statisticsa
Kesukaan
Mann-Whitney U 50.000
Wilcoxon W 105.000
Z .000
Asymp. Sig. (2-tailed) 1.000
Exact Sig. [2*(1-tailed Sig.)] 1.000b
a. Grouping Variable: Bets
b. Not corrected for ties.
Formula F2 (Ekstrak 10%)
Ranks
Bets N Mean Rank Sum of Ranks
Kesukaan Bets 1 10 10.50 105.00
Bets 2 10 10.50 105.00
Total 20
Descriptive Statistics
N Mean Std. Deviation Minimum Maximum
Kesukaan 20 1.9000 .30779 1.00 2.00
Bets 20 1.50 .513 1 2
Test Statisticsa
Kesukaan
Mann-Whitney U 50.000
Wilcoxon W 105.000
Z .000
Asymp. Sig. (2-tailed) 1.000
Exact Sig. [2*(1-tailed Sig.)] 1.000b
a. Grouping Variable: Bets
b. Not corrected for ties.

222
Formula F3 (Ekstrak 20%)
Descriptive Statistics
N Mean Std. Deviation Minimum Maximum
Kesukaan 20 1.9000 .30779 1.00 2.00
Bets 20 1.50 .513 1 2
Ranks
Bets N Mean Rank Sum of Ranks
Kesukaan Bets 1 10 10.50 105.00
Bets 2 10 10.50 105.00
Total 20
Test Statisticsa
Kesukaan
Mann-Whitney U 50.000
Wilcoxon W 105.000
Z .000
Asymp. Sig. (2-tailed) 1.000
Exact Sig. [2*(1-tailed Sig.)] 1.000b
a. Grouping Variable: Bets
b. Not corrected for ties.
R2. Uji statistik kesukaan antar formula dengan Kruskal-Wallis
Descriptive Statistics
N Mean Std. Deviation Minimum Maximum
Kesukaan 40 1.8250 .38481 1.00 2.00
Formula 40 2.50 1.132 1 4
Ranks
Formula N Mean Rank
Kesukaan Formula 0 10 20.00
Formula 1 10 18.00
Formula 2 10 22.00
Formula 3 10 22.00
Total 40
Test Statisticsa,b
Kesukaan
Chi-Square 1.857
df 3
Asymp. Sig. .603
a. Kruskal Wallis Test
b. Grouping Variable: Formula
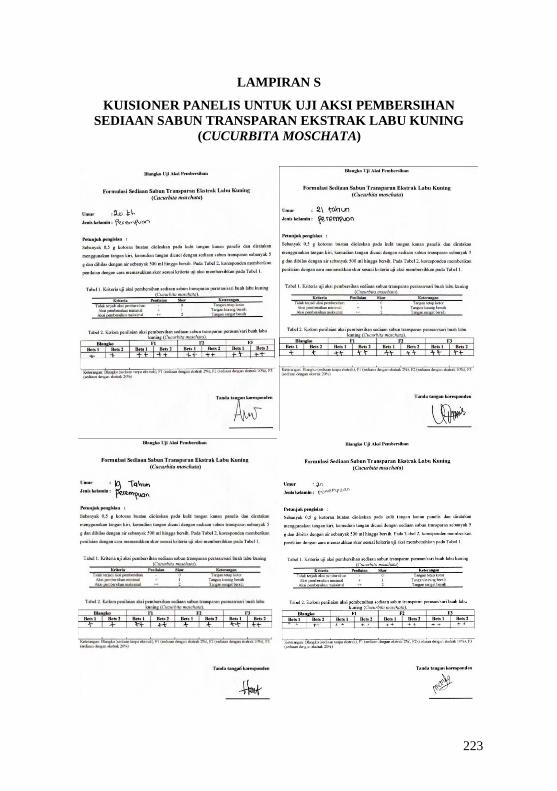
223
LAMPIRAN S
KUISIONER PANELIS UNTUK UJI AKSI PEMBERSIHAN
SEDIAAN SABUN TRANSPARAN EKSTRAK LABU KUNING
(CUCURBITA MOSCHATA)
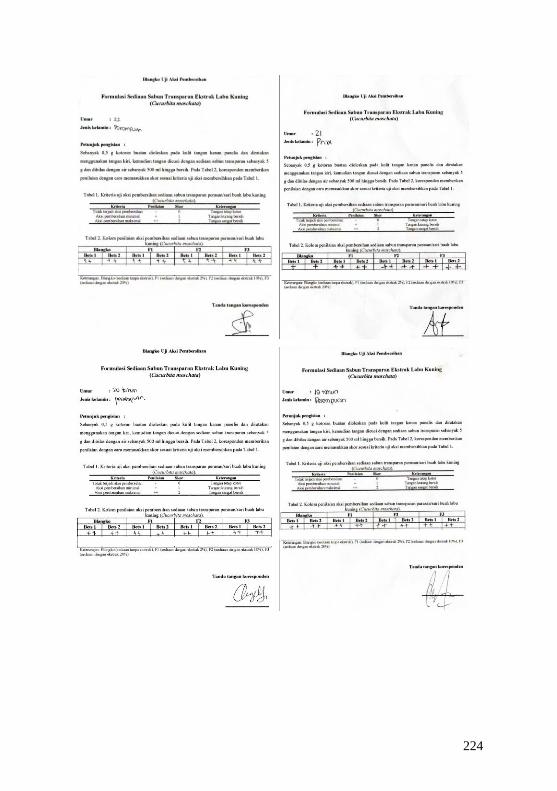
224

225
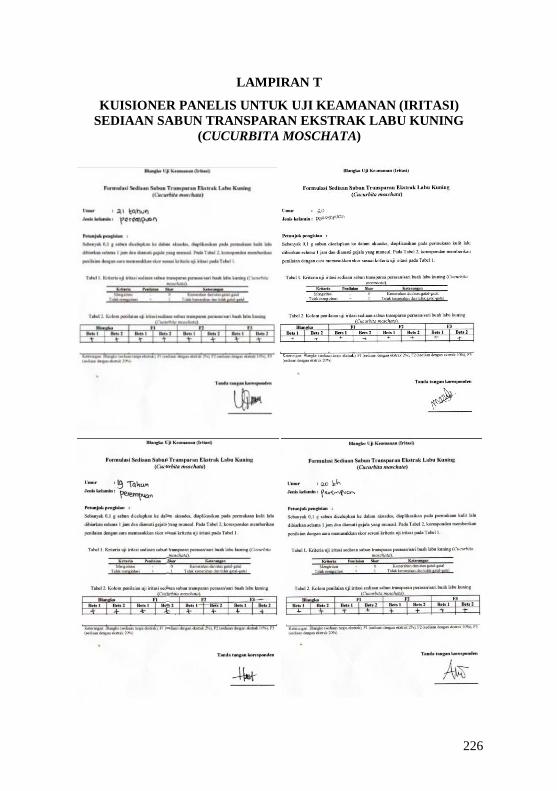
226
LAMPIRAN T
KUISIONER PANELIS UNTUK UJI KEAMANAN (IRITASI)
SEDIAAN SABUN TRANSPARAN EKSTRAK LABU KUNING
(CUCURBITA MOSCHATA)
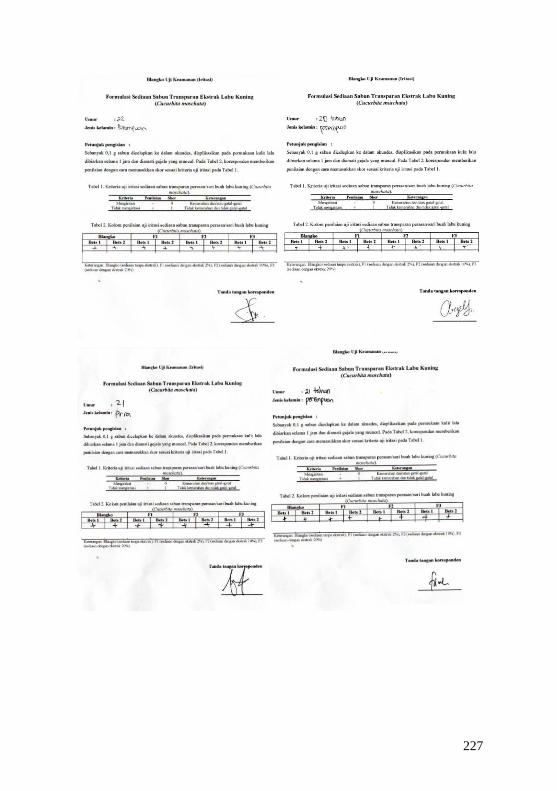
227

228
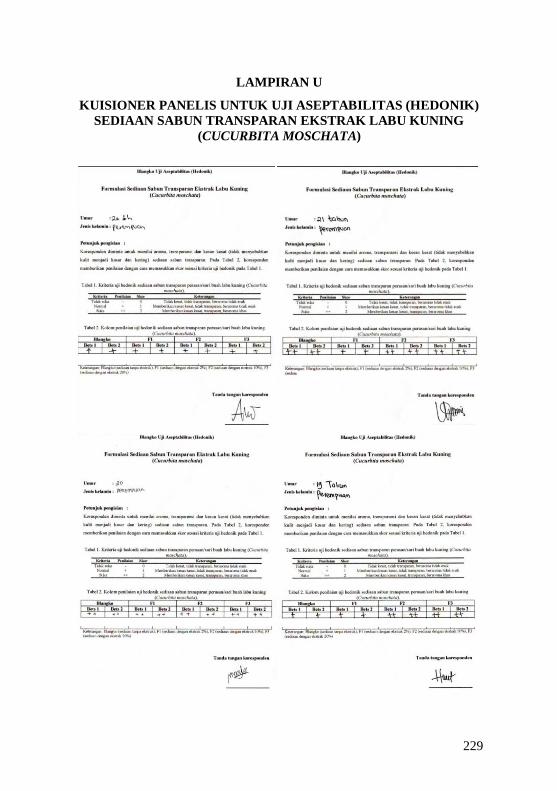
229
LAMPIRAN U
KUISIONER PANELIS UNTUK UJI ASEPTABILITAS (HEDONIK)
SEDIAAN SABUN TRANSPARAN EKSTRAK LABU KUNING
(CUCURBITA MOSCHATA)
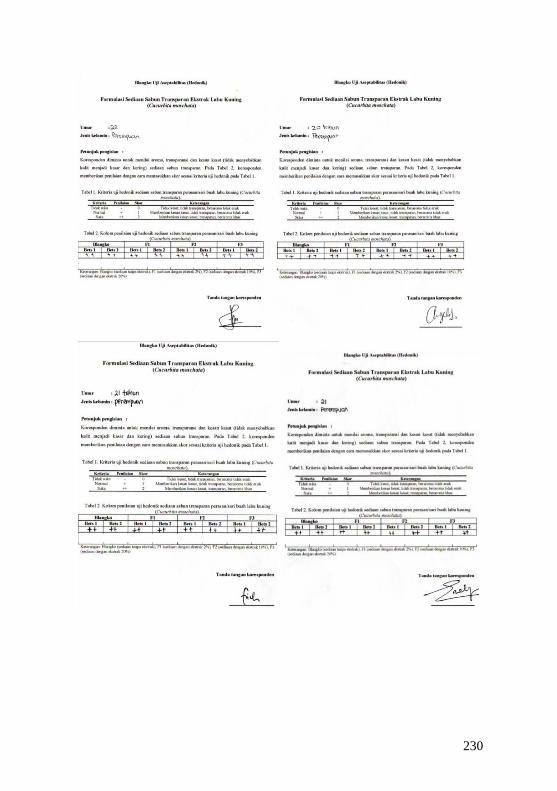
230

231

232
LAMPIRAN V
TABEL T
Cara membaca tabel t
Menentukan nilai df = n – k, dengan n = jumlah pengamatan; k =
jumlah variabel (bets)
Tentukan derajat kepercayaan
Contoh pembacaan
n = 6; k = 2; df = 6 – 2= 4
Derajat kepercayaan = 95%
ttabel = 2,776

233
LAMPIRAN W
TABEL F
Cara membaca tabel F
Menentukan nilai df df1 = (k – 1); df2 = (n – 1) – (k – 1), dengan n =
jumlah pengamatan; k = jumlah variabel (formula)
Tentukan derajat kepercayaan
df1 kolom; df2 baris
Contoh pembacaan
n = 24; k = 4; df1 = 4 – 1 = 3; df2 = (24 – 1) – (4 – 1) = 20
Derajat kepercayaan = 95%
Nilai F tabel adalah 3,10
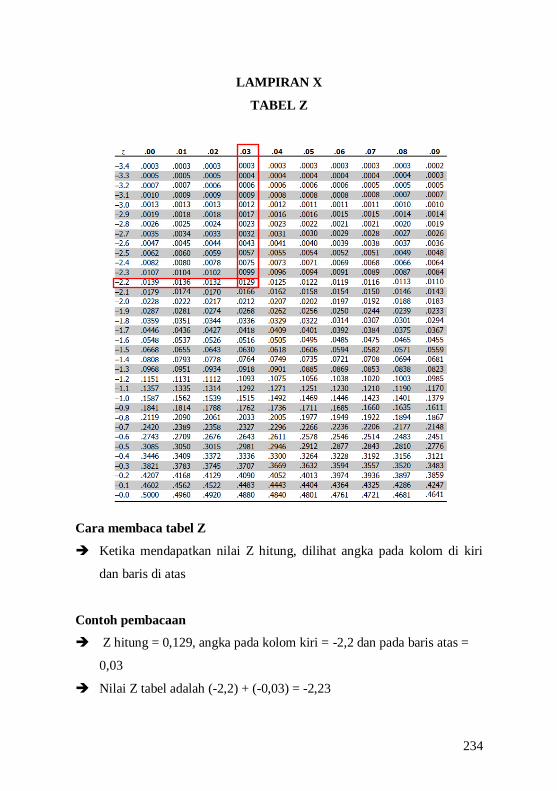
234
LAMPIRAN X
TABEL Z
Cara membaca tabel Z
Ketika mendapatkan nilai Z hitung, dilihat angka pada kolom di kiri
dan baris di atas
Contoh pembacaan
Z hitung = 0,129, angka pada kolom kiri = -2,2 dan pada baris atas =
0,03
Nilai Z tabel adalah (-2,2) + (-0,03) = -2,23

235
LAMPIRAN Y
TABEL CHI-SQUARE
Cara membaca tabel Chi-square
Menentukan nilai df df = K – 1; K = jumlah sampel
Tentukan derajat kepercayaan
n1 kolom; n2 baris
Contoh pembacaan
K = 4, df = 4 -1 = 3
Derajat kepercayaan = 95%
Nilai Chi-square tabel adalah 7,815
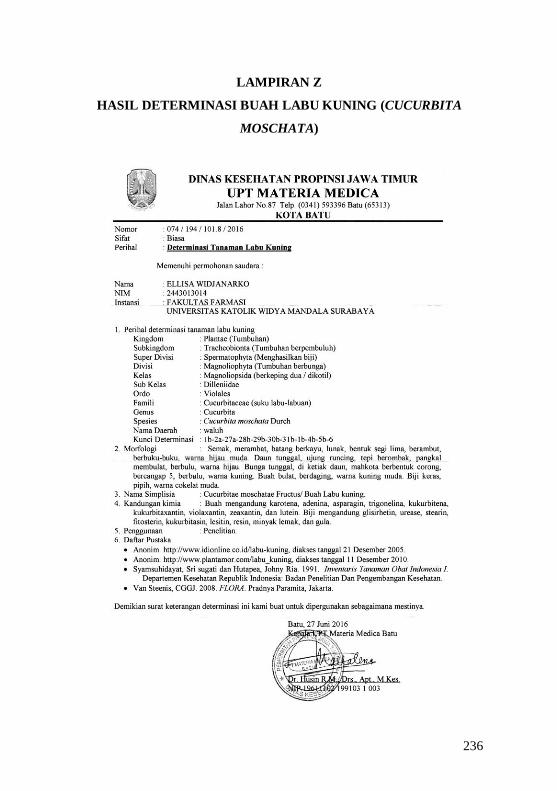
236
LAMPIRAN Z
HASIL DETERMINASI BUAH LABU KUNING (CUCURBITA
MOSCHATA)
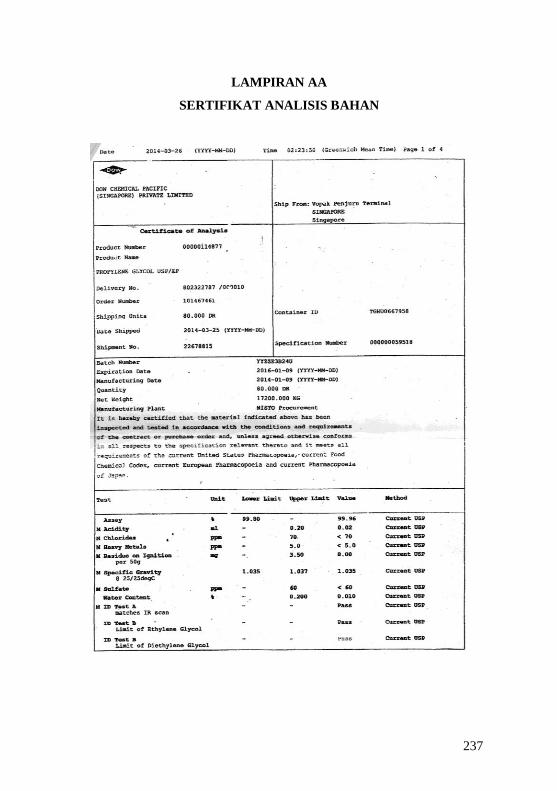
237
LAMPIRAN AA
SERTIFIKAT ANALISIS BAHAN
238
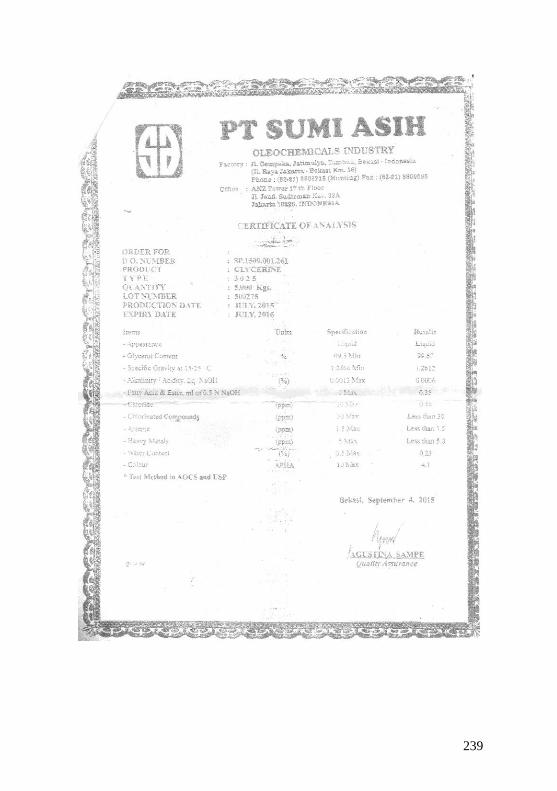
239
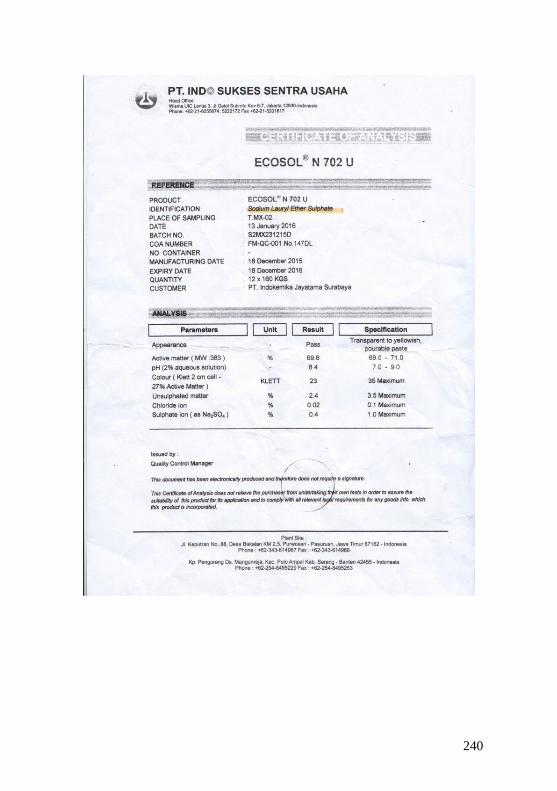
240
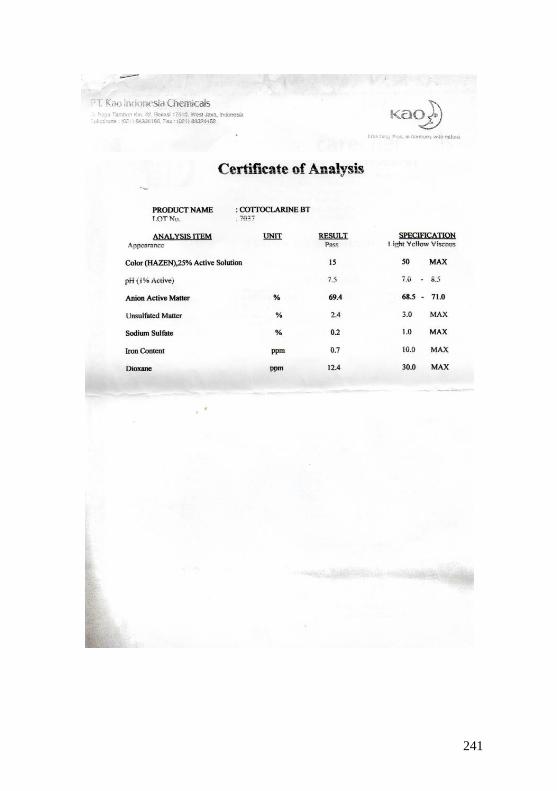
241
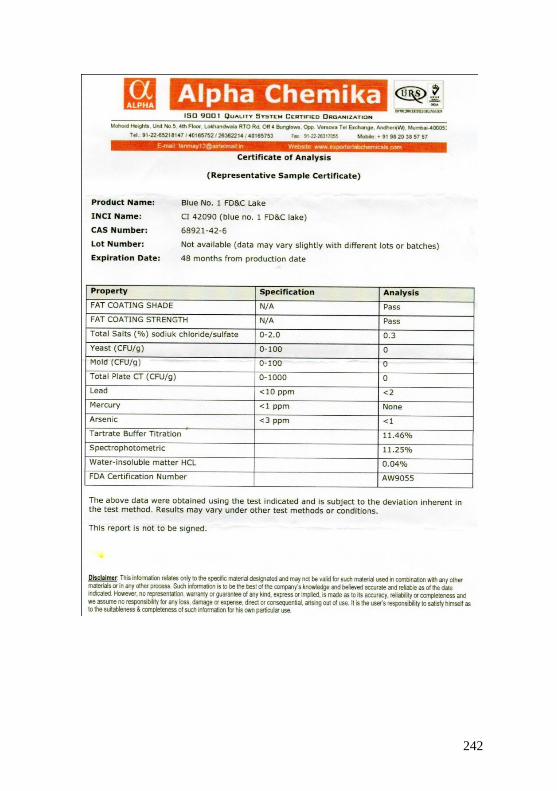
242

243
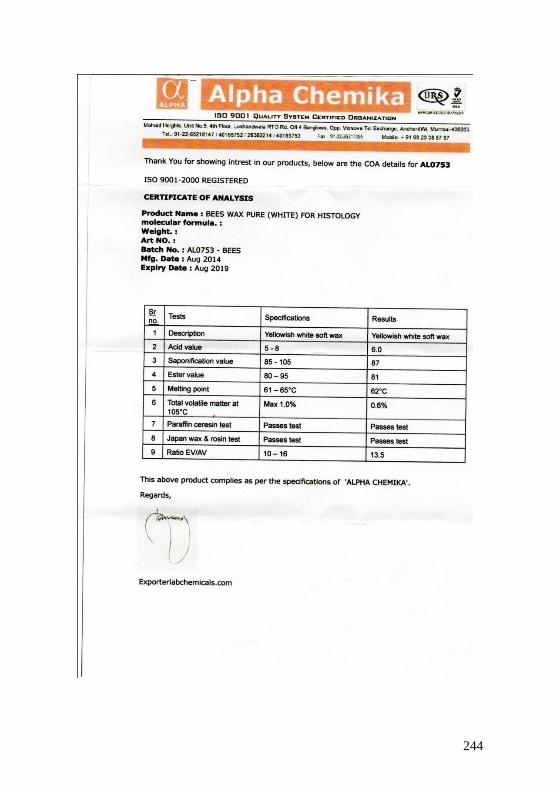
244
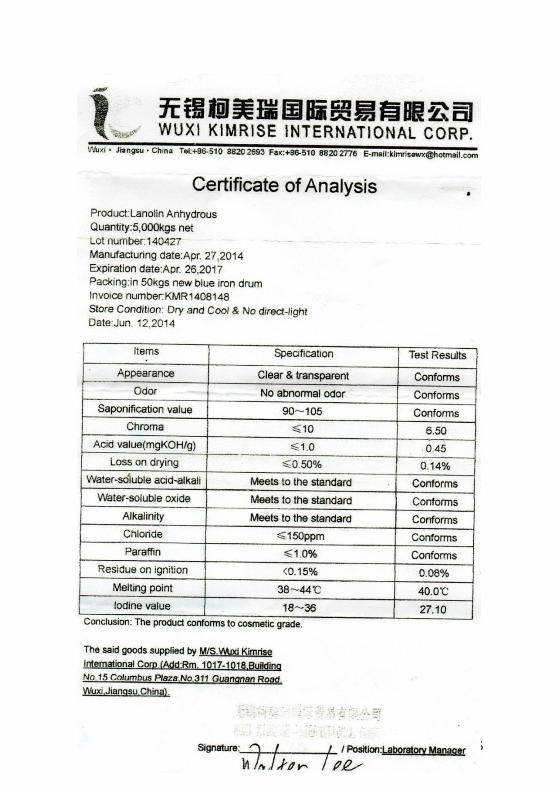
245
246